How to Build a Board Reporting Pack: The CFO’s Guide

There is a specific kind of silence that falls over a boardroom when a director flips to slide 14, squints at a table with 40 rows, and asks a question the board pack cannot answer.
Every CFO has lived that moment. The finance team spent two weeks assembling the pack. The numbers are accurate. The formatting is clean. And yet the meeting stalls, because the board reporting pack describes what happened without explaining what it means or what the board should do about it.
Read more: What Great Financial Reporting and Analytics Actually Look Like
That is the gap this article closes. A board reporting pack is not a data dump with a cover page. It is a decision-making tool. Its job is to give directors a clear, honest, forward-looking view of financial performance, risks, and strategic progress, in a format they can absorb and in the time they actually have.
This guide walks through how to build one properly. What goes in, what stays out, how to structure it, how to present it, and how to run the process behind it without losing two weeks every month. Along the way, I will show how a few of the key steps look inside a modern FP&A platform, so you can see where an FP&A tool removes the manual grind.
What a Board Pack Is Actually For
Start with purpose, because most of the bad reporting packs fail here.
The board does not sit in that room to audit your maths. Directors are there to govern. They approve strategy, monitor risk, challenge management, and make a small number of consequential decisions each year. The pack exists to support that work. Nothing else.
That reframing changes the CFO’s role. You are not the company’s reporter. You are its translator. Your job is to take complex financial data and turn it into something a director can act on: here is where we are, here is why, here is what is coming, and here is what we recommend.
For FP&A, the shift is even sharper. Traditional reporting looks backward. It says revenue was 4% below budget. A board-grade pack explains the drivers behind that miss, shows what it means for the full-year outlook, and frames the decision it forces. Reporting history is table stakes. Explaining drivers, forecasting outcomes, and supporting decisions is the actual job.
A useful test before anything goes in the pack: if a director reads this page, what can they do with it? If the honest answer is nothing, the page is filler.
Know Your Audience Before You Build a Single Slide
A board pack has a more varied audience than almost any other report finance produces.
Independent directors may see the business four to eight times a year. They need context that management takes for granted. Executive directors live in the detail and get impatient with material they already know. The audit committee cares about controls, judgments, and compliance. If investors or their representatives sit on the board, they bring their own lens on cash, returns, and covenants.
You cannot write a different pack for each of them. But you can structure one pack so each reader finds their layer.
The general rule: boards want material that is high-level, concise, and forward-looking, with a clear focus on risks, opportunities, and strategic alignment. They do not want to reverse-engineer insights from raw data. That is management’s job, done before the pack ships.
The practical technique is the “so what” discipline. Every chart, every table, every variance gets one line of plain-language interpretation. Revenue by region is data. “Germany drove the full miss; the pipeline recovered in March, so we hold full-year guidance” is a so what. Directors read the second sentence first, then look at the chart to verify it. Never make them do that in reverse.
One more audience point that gets missed. Directors read packs on planes, in hotel rooms, the night before the meeting. Assume the pack must work with nobody in the room to explain it. If a page needs a verbal walkthrough to make sense, rewrite the page.
Define the Objectives and Scope Upfront
Before designing content, settle three things with the CEO and the chair.
- Strategic priorities. The pack should mirror what the company is actually trying to do. If the strategy is built on growth, profitability, cash generation, and capital allocation, those four themes should be visible in the structure of the pack itself. A board pack organized around the strategy reads very differently from one organized around the chart of accounts.
- Cadence. Monthly, quarterly, or event-driven. Quarterly is the most common rhythm for full packs, often with a lighter monthly flash in between. The mistake is producing the same 60 pages at every cadence. A monthly update and a quarterly deep-dive should not look alike.
- Success criteria. Agree what good looks like before you build. Four criteria cover it: clarity, relevance, timeliness, and decision usefulness. Write them down. Then review the pack against them twice a year, ideally with feedback from the directors themselves. Most packs are never evaluated after they are first designed, which is why they slowly bloat into 90-page archives that nobody reads.
Scope discipline matters as much as content quality. Every function will lobby to get its slide into the board pack, because board visibility feels like status. Hold the line. The pack serves the board’s decisions, not the org chart’s ego.
Read: FP&A Monthly Calendar
The Anatomy of a Strong Board Pack
Now the substance. A complete board reporting pack typically contains seven sections. The order matters: summary first, detail behind it, so a director can stop reading at any point and still have the full picture.
1. Executive summary
The most important two pages in the pack, and usually the last ones written but which are read first by the board. The summary carries key highlights, material risks, and, critically, the decisions required from the board at this meeting. If you need approval for a facility renewal or a capex program, say so on page one, not page 47.
It also carries the headline variance story and forward-looking commentary. Not every variance. The three to five movements that actually change how a director should think about the year.
2. Financial statements
The core three, presented for insight rather than compliance:
- Income statement. Revenue, margins, and cost drivers, with commentary on what moved and why.
- Balance sheet. Focus on liquidity, leverage, and working capital, since those are the items that create board-level risk.
- Cash flow statement. Operating, investing, and financing flows, with a bridge from profit to cash. Boards trust cash more than EBITDA, and they are right to.
Full statutory detail belongs in an appendix. The main body shows the shape of the numbers, not every line.
Read: Balance Sheet vs Income Statement: Key Differences and Why You Need Both for Financial Planning
3. KPIs and value drivers
A short, stable set of metrics across three layers.
- Financial: EBITDA, ROIC, free cash flow.
- Operational: customer growth, churn, utilization, or whatever genuinely drives your model.
- Strategic: market share and product performance.
A KPI page that changes composition every quarter invites suspicion that management is curating good news. Pick the metrics, define them precisely, and keep them consistent across periods.
Read: 6 Practical Financial Strategies for Controlling Cost and Driving Growth
4. Budget versus actuals
The section boards read most closely. Variance analysis by revenue, cost, and business unit, with root causes decomposed into price, volume, mix, and timing. “Marketing overspent by 200K” is an observation. “Marketing pulled the Q3 campaign into Q2; full-year spend is unchanged” is an explanation. Only the second belongs in a board pack.
Read: What Are Quick Assets? The Liquidity Check Behind Short-Term Financial Health
5. Forecasting and scenarios
This is where the pack turns forward-looking. A rolling forecast and updated full-year outlook. Scenario analysis with a base, upside, and downside case. Sensitivity on the two or three drivers that matter most, such as pricing, volume, or FX.
Directors consistently rank this section as the one they want more of. Most packs underweight it because it is the hardest section to produce manually.
6. Strategic initiatives
Progress on the major projects, M&A activity, and capex programs the board has approved. Milestones, ROI tracking against the original business case, and honest status. A board that only hears about initiative problems after they become write-offs will, reasonably, stop trusting the pack.
Read: Internal Rate of Return vs ROI: Which Metric Should Drive Your Investment Decisions?
7. Risk and compliance
Key financial and operational risks with movement since last quarter, plus regulatory and governance updates. Keep it to the risks that are material at board level. A 60-row risk register is an operational document, not a board one.
Get the Data Foundations Right
Everything above depends on something unglamorous: where the numbers come from and whether anyone can trust them.
A typical board pack pulls from the ERP, the CRM, BI tools, market data, and external benchmarks. That diversity is normal. The problem starts when those sources disagree and nobody notices until a director does. Few things damage a CFO’s credibility faster than two slides in the same pack showing two different revenue figures.
Three principles keep the foundation solid.
- One source of truth. Every number in the pack should trace back to a single governed dataset. When sales quotes one revenue number and finance another, the fix is not a footnote. It is a pipeline.
- Auditability. For any figure in the pack, you should be able to show where it came from and what assumptions sit behind it. Audit committees increasingly ask exactly this.
- Automation of the boring parts. If analysts spend the first week of every cycle exporting, copying, and reconciling data between systems, you are paying senior people to do plumbing, and the pack ships late because of it.
Read: 10 Ways to Analyze Financial Data: (How FP&A Teams Use Each One)
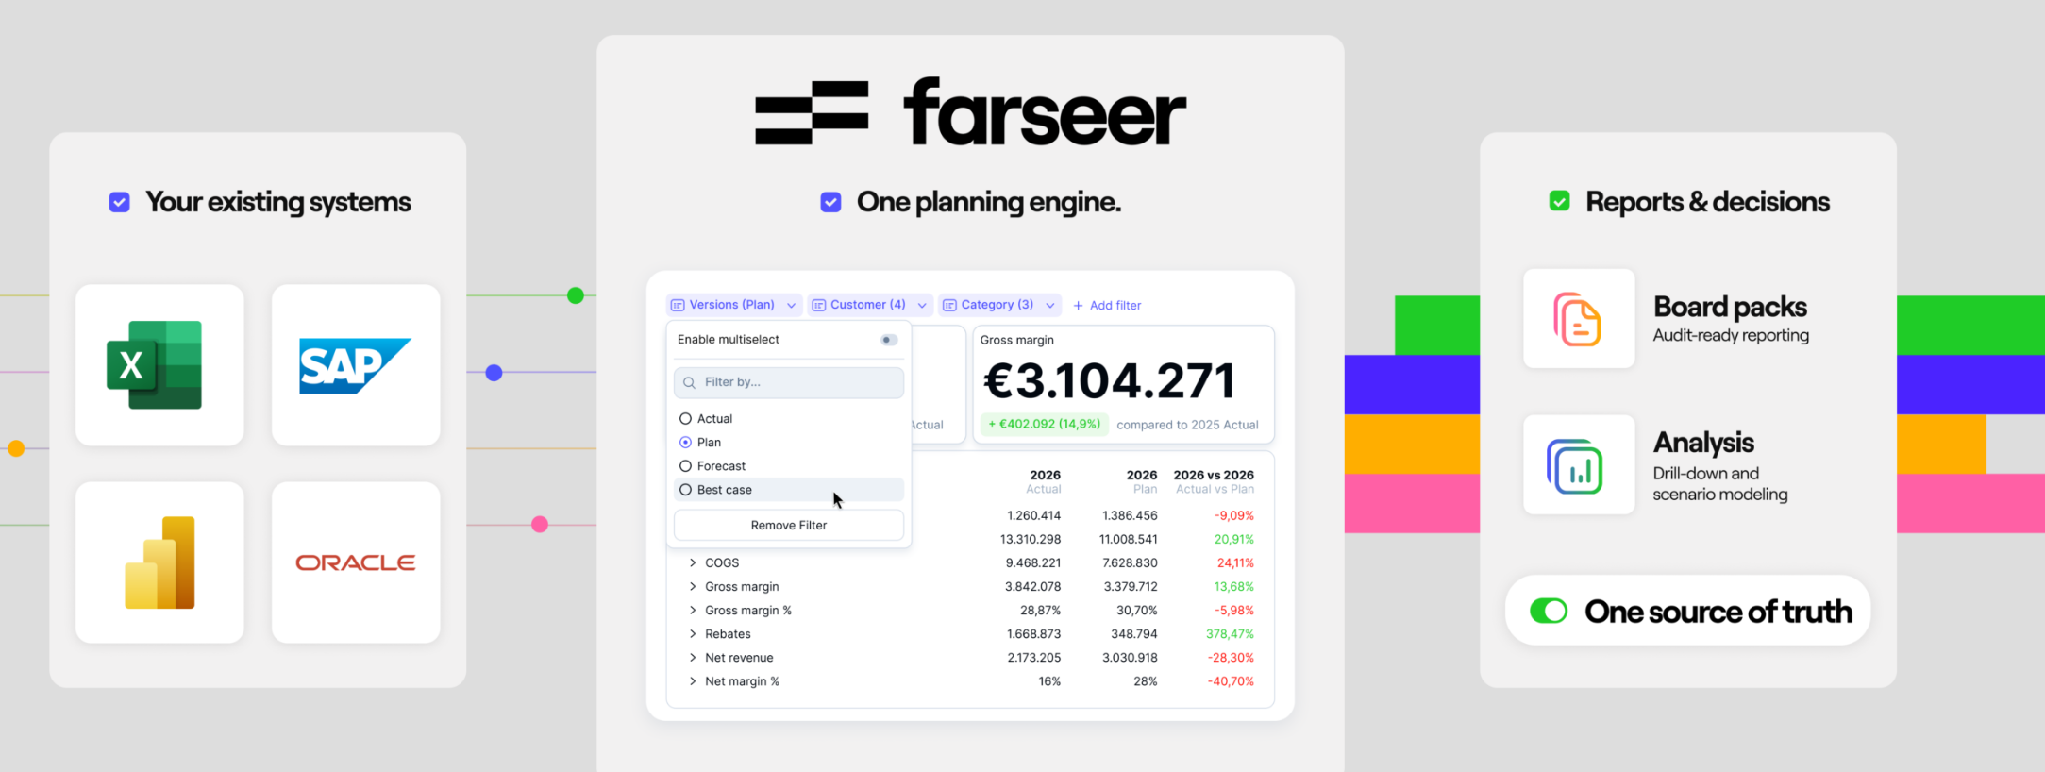
This is where the FP&A tool question stops being abstract. In a platform like Farseer, actuals flow in from the ERP through direct integration, and they land in the same model that holds the budget, the forecast, and the drivers. This significantly reduces the manual reconciliation between separate reporting, planning, and forecasting files because they operate from the same governed model. The variance page and the outlook page read from one dataset by construction. Teams that move onto this kind of setup usually find that the data-assembly week simply disappears from the reporting calendar, and the time moves into analysis, which is where it always belonged.
Analyze Before You Present
With clean data in place, the analytical layer turns numbers into narrative. Five techniques carry most of the weight in a board pack.
- Variance analysis. Budget versus actual and prior-period comparisons, decomposed to root cause. This is the backbone.
- Trend analysis. Patterns and seasonality across a rolling 12 to 24 months. A single-month variance can mislead. A trend rarely does.
- Driver-based analysis. Linking financial outcomes to operational levers. Revenue did not simply fall. Volume fell in one channel while price held. The board can act on the second framing.
- Benchmarking. Performance against industry peers or internal targets. Directors sit on other boards. They benchmark you whether you help them or not. Better to control the comparison.
- Predictive analytics. Models that anticipate performance rather than just explain it. Even a simple statistically driven forecast alongside management’s own adds useful challenge.
The depth question comes up in every board meeting: a director asks why a number moved, and the answer sits three levels below the slide. In a manual process, that means “we will come back to you,” followed by a two-day email chase.
Read: AI Forecasting in FP&A: Where It Works, Where It Fails, and How to Use It
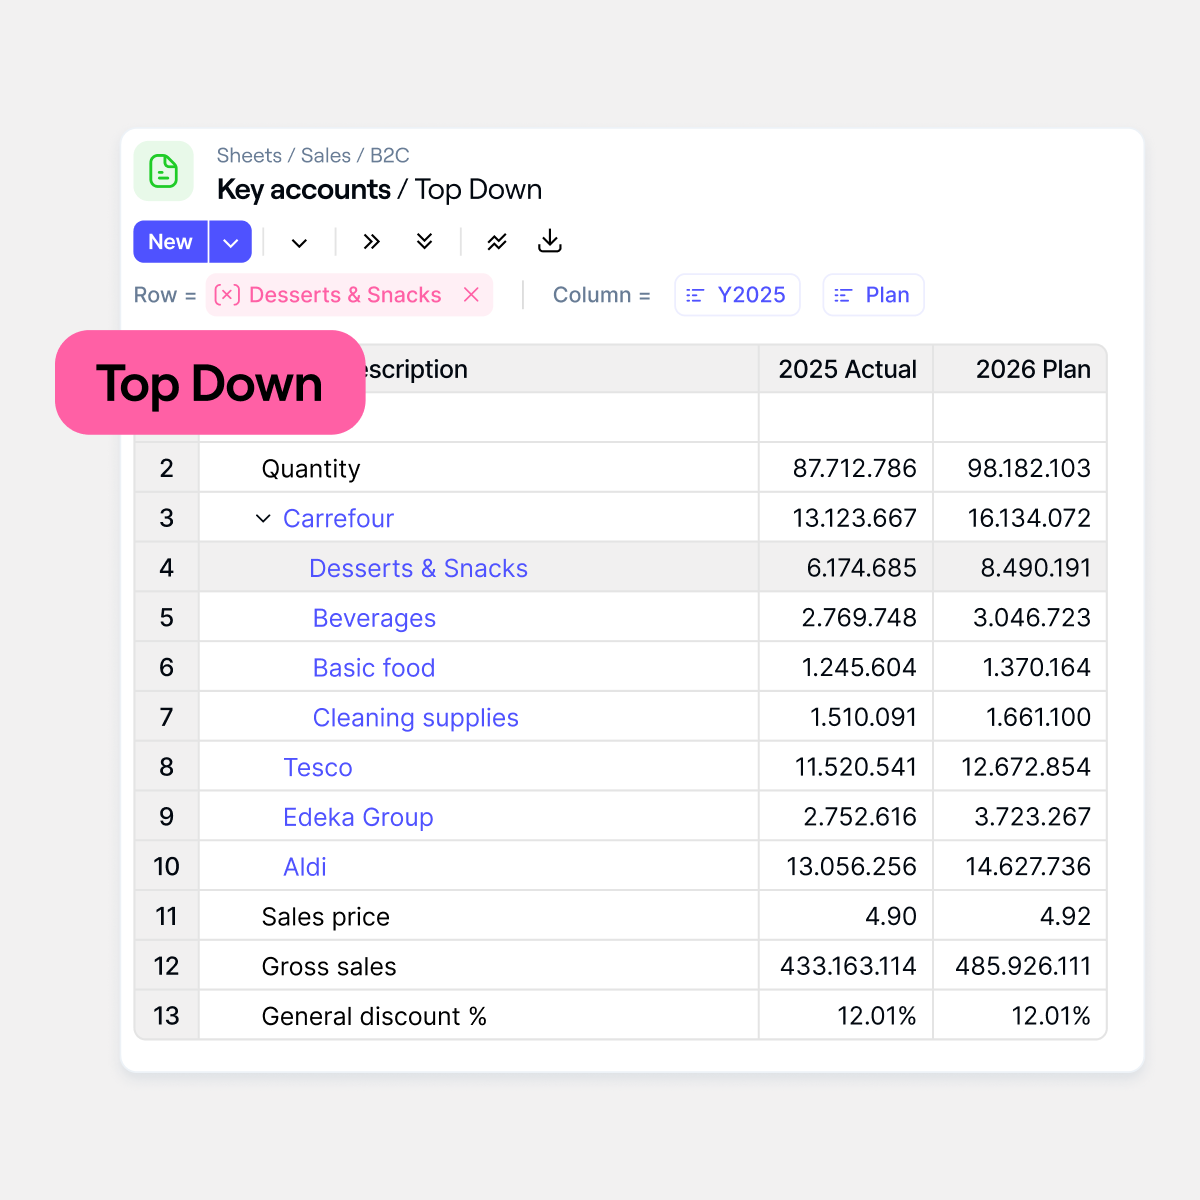
In Farseer, the same question takes a few clicks. Any figure on a dashboard can be drilled down through region, entity, product, or customer until you reach the driver that moved, and Inspect Value shows exactly how the number was calculated and from which inputs. The CFO who can answer the third-level question live in the meeting is having a different conversation with the board than the one who cannot.
Design and Presentation: Where Good Analysis Goes to Die
Plenty of analytically excellent packs fail in the room because of how they look. Design is not decoration here. It determines whether the insight lands.
- Structure and flow. Executive summary first, then progressive detail. Sequence sections in the order the board makes decisions, not the order finance produces the numbers.
- Visualization. Use the right chart for the job. Line charts for trends. Bar charts for comparisons. Waterfall charts for variances and bridges, because nothing explains a profit movement faster than a well-built EBITDA bridge. Annotate the key insight directly on the chart. A title that says “Q2 Revenue” wastes the most valuable text on the page. “Q2 revenue up 6%, driven by pricing” earns its place.
- Clarity and brevity. Plain language. No jargon, no internal acronyms a new director would not know. Short sentences. Insights first, supporting data second.
- Consistency. Standardized formats, definitions, and metrics across periods. When the pack looks the same every quarter, directors spend their attention on what changed in the business, not on relearning the layout.
A practical tip works: One message per page, stated in the title, supported by one chart and three to five lines of commentary. If a page needs two messages, it needs to become two pages, or one of the messages is not board-material.
The Direction of Travel: From Document to Dashboard
The static PDF pack is not disappearing, but it is no longer the whole answer. Four shifts are changing how the best finance teams do board reporting.
Real-time dashboards and self-service analytics let directors explore between meetings instead of waiting for the next pack. AI and machine learning are moving into forecasting and anomaly detection, flagging unusual movements before a human would catch them. Cloud-based FP&A platforms have made collaboration on the pack normal rather than novel. And data storytelling tools are raising the bar on narrative quality across the board.
The practical middle ground most companies land on is a hybrid. A concise written pack for governance and record, backed by live dashboards for exploration.
Read: How to Build a P&L Dashboard in Farseer (Step-by-Step)
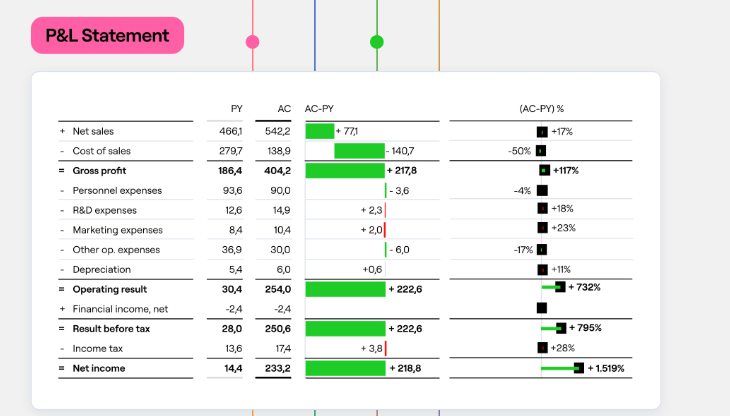
In Farseer, the reporting dashboards are connected directly to the planning model, so they update the moment actuals load or a forecast changes. A director reviewing the pack on Sunday evening is looking at the same numbers the CFO will present on Tuesday, and a mid-meeting question about a different cut of the data gets answered by slicing the live view rather than commissioning a follow-up analysis. The pack becomes the narrative layer on top of a system that is always current.
None of this replaces judgment. It removes the mechanical lag between a question and its answer.
Review, Governance, and Version Control
The last mile of the process protects everything upstream.
- Internal review. Validate the numbers with finance and with business unit leaders before the pack leaves the building. Nothing undermines a board meeting like a divisional head disowning “their” numbers in front of the directors. Alignment on messaging is part of accuracy, not separate from it.
- Stakeholder feedback. The CEO, the chair, and the audit committee chair should see a near-final draft with enough time to shape it. Their input almost always improves the decision-framing, which is the part finance is furthest from.
- Version control and audit trail. Board packs are governance documents. You must be able to show which version went to the board, when, and what changed between drafts. If your process involves a file called Board_Pack_v7_FINAL_final.pptx, the process is telling you something. In a governed environment, the reporting period gets locked once the pack is issued, the numbers underneath it can no longer move, and every change before the lock is logged with a name and a timestamp. That audit trail is exactly what the audit committee wants to see, and it costs nothing to produce when the system maintains it by default.
Set a repeatable timetable for all of this. Data cut-off, first draft, internal review, executive review, dispatch. Directors should receive the pack at least five working days before the meeting. A brilliant pack that arrives 48 hours before the board meets is a mediocre pack in practice, because nobody had time to read it.
Read: How to Build an Annual Operating Plan (AOP): A Step-by-Step Guide for FP&A Teams
Seven Pitfalls That Sink Board Packs
Having reviewed a lot of packs, the failure patterns repeat. Watch for these.
- Data without insight. Sixty pages of tables, zero pages of meaning. The most common failure by far.
- Inconsistent metrics and definitions. Gross margin defined one way in Q1 and another in Q3 destroys trust quietly.
- No forward view. A pack that only explains the past leaves the board doing the forecasting themselves, in the meeting, badly.
- Poor visualization. Cluttered charts, 3D pie charts, unlabelled axes. If a director needs 30 seconds to decode a chart, the chart failed.
- Late delivery. Relevance decays fast. Late packs produce shallow meetings.
- Burying the decisions. Approvals requested on page 52 get worse discussion than approvals framed on page 2.
- Length as a substitute for quality. A 90-page pack does not signal rigor. It signals that nobody made choices. Every page must answer the so what question.
Read: From Excel to Connected Planning: A Practical Migration Strategy for Finance Teams
Final Thought: The Pack Is the CFO's Argument
A board reporting pack is where the CFO’s role becomes visible. A reporter assembles numbers. A strategic partner builds an argument: here is our performance, here are the drivers, here is what is coming, and here is what we should decide.
Build the pack around the board’s decisions. Keep it consistent, honest, and forward-looking. Get the data foundation solid enough that nobody in the room doubts the numbers, so the whole meeting can focus on what to do about them. And treat the pack as a product that evolves. Ask the directors twice a year what they need more of and less of, and act on the answer.
Then look at your own process. If your team spends two weeks a quarter assembling the pack and two days analysing it, the ratio is backwards, and the fix is process and an FP&A tool, not more effort. The companies with the best board conversations are rarely the ones with the longest packs. They are the ones whose finance teams stopped building documents and started building understanding.
Next board cycle, before anyone opens PowerPoint, ask one question. What does the board need to decide at this meeting? Build backwards from that, and the rest of the pack writes itself.
Ready to put this into practice? We turned this guide into a free 8-slide template: the full skeleton of a board pack, with placeholder charts and a guidance note on every page covering what directors want to see. Drop in your numbers, run the director test, and delete the guidance cards before the pack goes out.

FAQ
What is a board reporting pack?
A board reporting pack is a structured collection of financial, operational, strategic, and risk information prepared for a company’s board of directors. Its purpose is not simply to report historical results, but to help directors understand performance, assess risks, monitor strategy, and make informed decisions.
What should be included in a board reporting pack?
A strong board pack typically includes an executive summary, financial statements, key performance indicators (KPIs), budget-versus-actual analysis, forecasts and scenarios, strategic initiative updates, and material risks and compliance matters. The exact content should reflect the company’s strategy and the decisions the board needs to make.
How do you structure a board reporting pack?
Start with the executive summary and decisions required, followed by financial performance, KPIs, variance analysis, forecasts, strategic initiatives, and risks. The structure should move from headline insights to supporting detail so directors can understand the overall story without reading every page.
What financial information should be included in a board pack?
Board financial reporting normally includes a summarized income statement, balance sheet, and cash flow statement together with key metrics such as revenue, margins, EBITDA, free cash flow, liquidity, leverage, and working capital. Detailed statutory information can usually sit in an appendix.
How long should a board reporting pack be?
There is no universal page count. The right length is the shortest pack that gives directors enough context to govern and make decisions effectively. Every page should answer a meaningful board-level question; information that does not support a decision, risk, strategy, or material performance discussion should be challenged.
What KPIs should be included in a board report?
Board KPIs should combine financial, operational, and strategic measures. Examples include EBITDA, ROIC, free cash flow, customer growth, churn, utilization, market share, and product performance. The KPI set should remain reasonably consistent between reporting periods so directors can identify genuine changes in performance.
How should variance analysis be presented to the board?
Do not stop at reporting that actual results were above or below budget. Explain the underlying drivers, such as price, volume, mix, timing, or FX, and what the variance means for the full-year outlook. Board-level variance commentary should answer what happened, why it happened, and what happens next.
How often should board reporting packs be prepared?
The cadence depends on the organization’s governance requirements. Full board packs are commonly prepared quarterly, while some organizations supplement them with shorter monthly updates or event-driven reporting.
How can FP&A automate board reporting?
FP&A teams can reduce manual board reporting by connecting ERP and operational data to a governed financial model, automating recurring calculations and variance analysis, and linking reporting dashboards directly to current actuals and forecasts. This reduces time spent exporting and reconciling spreadsheets and creates more capacity for analysis. Platforms like Farseer are built around this model-connected approach.
What are the most common board reporting mistakes?
Common mistakes include presenting data without insight, inconsistent KPI definitions, focusing only on historical results, cluttered visualizations, late delivery, burying decisions deep in the pack, and adding pages without considering whether they help directors make better decisions.

What Great Financial Reporting and Analytics Actually Look Like
Read more
Ad Hoc Reporting for Finance Teams Who Can’t Wait on IT
Read more