7 Limitations of the Balance Sheet Every CFO Should Know (And How to Overcome Them)

The balance sheet is one of the three core financial statements and a fundamental tool for understanding a company’s financial position. It shows what a company owns, what it owes, and what belongs to shareholders at a specific point in time. Investors, creditors, and managers rightfully treat it as a starting point for financial analysis.
But it cannot be taken as the only source of truth. The balance sheet has structural limitations built into the accounting standards that govern how it is prepared. Understanding those limitations is as important as reading the numbers themselves. This guide covers the seven primary limitations, their planning implications, and how to mitigate each.
Limitation 1: The Historical Cost Principle
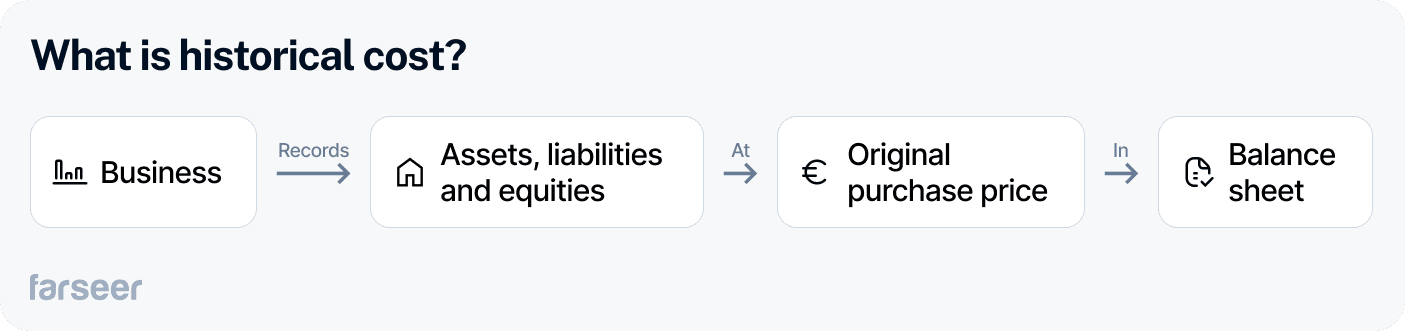
Assets listed on the balance sheet show their original purchase price. Changes in market value are not reflected. This is the historical cost principle, and it is a fundamental feature of GAAP and most IFRS treatments of non-financial assets.
Example: A company purchased an office building 20 years ago for $500,000. The surrounding area has appreciated significantly and the building is now worth $2 million in the current market. The balance sheet still shows this asset at $500,000. An investor reviewing only the balance sheet would see an asset base significantly below its economic value.
The implications compound for businesses with large holdings of appreciated real estate, equipment, or long-held investments. A manufacturing company with decades-old production facilities, or a retailer that bought prime locations before a commercial district developed, may appear to have a weaker asset base than they actually do.
Inflation adds another dimension. Assets purchased in a period of low inflation and held through a period of high inflation will show historical costs that are further below replacement value. The balance sheet gives no signal of this gap.
Mitigation: Use fair value adjustments and revaluation wherever accounting standards permit. Under IFRS, property can be revalued periodically to reflect market value. For planning purposes, supplement balance sheet book values with independent market valuations for significant real estate, equipment, and investment holdings. Document the gap between book value and estimated market value as a management note alongside the formal financial statements.
Limitation 2: Intangible Assets Are Largely Excluded
Many of a company’s most valuable assets do not appear on the balance sheet because they are too difficult to measure reliably. Internally developed brand reputation, employee expertise, customer relationships, proprietary processes, and self-developed intellectual property are typically excluded from balance sheet assets unless they are acquired through a business combination.
Brand Finance’s 2024 study estimated that 79% of global intangible asset value is not disclosed in balance sheets. Total global intangible asset value has grown from $20 trillion in 2001 to $79 trillion by 2024, meaning the gap between balance sheet values and economic reality has widened significantly as the economy has shifted toward knowledge-intensive business models.
Read: 9 Key Balance Sheet Ratios Every Finance Team Should Track (With Industry Benchmarks)
Example: Alphabet (Google’s parent company) relies heavily on employee expertise, search algorithm intellectual property, and brand value. These assets are fundamental to its competitive position and economic value, but they do not appear on the balance sheet unless acquired through an acquisition. An analyst relying only on balance sheet asset values would significantly underestimate Alphabet’s economic resources.
Acquired intangibles are capitalised and appear on the balance sheet. This is why M&A transactions often result in large goodwill and intangible asset line items. But for companies that have built their intangible asset base organically, the balance sheet understates economic value.
Mitigation: Track KPIs for intangible asset categories: brand equity indices, net promoter scores, patent counts and citation rates, employee retention and productivity metrics, and customer lifetime value. Present these alongside the balance sheet in management reporting to give stakeholders a fuller picture of the company’s competitive resources. For M&A valuation and investor presentations, commission independent brand or IP valuations rather than relying on balance sheet figures.
Limitation 3: The Point-in-Time Snapshot
The balance sheet shows financial position on one specific date, typically the last day of the fiscal year or quarter. This creates two related problems: it misses trends, and it is susceptible to presentation management.
Seasonal distortion example: A retail company may have a very strong balance sheet at 31 December, right after the holiday season, because of peak cash inflows and low inventory levels after sales. The same company at 30 June may show a very different liquidity position, with higher inventory and lower cash. The year-end snapshot does not reflect the company’s typical financial health throughout the year.
Mitigation: Request or construct monthly or quarterly balance sheet data rather than relying solely on year-end figures. Compare balance sheet positions at equivalent seasonal points across multiple years. For working capital management, supplement the year-end balance sheet with a rolling 13-week cash flow forecast that tracks the continuous movement of cash, receivables, and payables rather than their position at a single date.
Limitation 4: Estimates and Assumptions
Not all balance sheet items are based on objective, verifiable values. Depreciation methods, useful life estimates, allowances for doubtful accounts, inventory valuation methods, and goodwill impairment assessments all require judgement. Different judgements produce different balance sheets for identical underlying assets.
Depreciation example: Company A uses straight-line depreciation on machinery (equal charge each year). Company B uses the double-declining balance method (higher charges in early years). After five years, Company A reports higher book value for identical machinery because the charge each year was smaller. An investor comparing the two companies might conclude Company A has more valuable assets, when in reality both have identical equipment of the same economic worth.
The same principle applies to inventory valuation (FIFO versus weighted average cost), goodwill impairment testing (which requires projections of future cash flows that involve significant management judgement), and the allowance for doubtful accounts (how much of accounts receivable is unlikely to be collected).
Mitigation: When comparing companies or building peer benchmarks, normalise for key accounting policy differences before drawing conclusions. Review the accounting policies note in the financial statements to identify significant estimation choices. Where material differences exist in depreciation, inventory, or goodwill treatment between peer companies, adjust the comparison figures to a common basis before running ratio analysis.
Limitation 5: No Cash Flow Information
The balance sheet shows how much cash the company holds at a point in time. It does not show how cash was generated, where it was spent, or whether the level of cash on hand is sustainable given the operational pattern of the business.
A company can show a strong cash balance on the balance sheet while simultaneously burning cash at an unsustainable rate. Equally, a company with a modest cash balance may be generating strong operating cash flow that will rebuild the position quickly. The balance sheet alone tells neither story.
Example: A technology startup may show $5 million in cash on its balance sheet. Without the cash flow statement, an investor cannot know whether this cash was raised from investors six months ago and is being consumed at $1 million per month (six months of runway), or generated from operations over the past year and growing. The two situations have opposite implications for financial health.
Mitigation: Always read the cash flow statement alongside the balance sheet. Focus specifically on operating cash flow: does the business generate cash from its core operations, or does it require external financing to fund operations? Calculate free cash flow (operating cash flow minus capital expenditure) as a measure of the cash available after maintaining the asset base. Never assess liquidity from the balance sheet alone.
Limitation 6: Window Dressing
Window dressing is the practice of managing balance sheet presentation at the reporting date to show a more favourable position than the company’s typical operating condition warrants. It exploits the point-in-time nature of the balance sheet: a company that passes the snapshot test on the last day of the fiscal year may look materially different in the weeks before or after.
Common window dressing techniques include: temporarily repaying revolving credit facilities at year-end to reduce reported debt, then re-drawing the facility in January; accelerating customer cash collections in the days before the balance sheet date to inflate the cash balance; delaying supplier payments to keep accounts payable temporarily lower; and selling and immediately repurchasing assets around the balance sheet date to improve liquidity ratios.
The result is a balance sheet that reflects careful timing management rather than the company’s genuine day-to-day financial position. Current ratio, cash ratio, and debt-to-equity all improve under window dressing, giving a misleadingly healthy picture to creditors and investors who rely on year-end figures.
Mitigation: Request or construct intra-year balance sheet data rather than relying solely on year-end figures. A current ratio that is consistently strong at year-end but weaker at mid-year analysis suggests timing management. For credit analysis and covenant monitoring, require quarterly or monthly financial reporting rather than annual-only. Review cash flow seasonality patterns to identify unusual concentrations of cash inflows or debt repayments around reporting dates.
Limitation 7: Off-Balance Sheet Items
Off-balance sheet financing allows a company to use assets or incur obligations that do not appear on the face of the balance sheet, creating a gap between the reported financial position and the economic reality.
The most significant historical example is Enron Corporation’s use of special purpose vehicles (SPVs) to hold billions of dollars of debt off its consolidated balance sheet. Enron’s reported balance sheet showed a healthy leverage position right up to its collapse in December 2001. The off-balance sheet obligations were the primary cause of the bankruptcy. The scandal prompted a fundamental overhaul of consolidation accounting standards.
IFRS 16 and ASC 842, introduced in 2016 and 2018 respectively, addressed one major category of off-balance sheet financing by requiring operating leases to be recognised as liabilities on the balance sheet. Before these standards, airlines with large aircraft fleets on operating leases, retailers with extensive store portfolios, and restaurant chains with long lease terms all appeared far less leveraged than their economic obligations warranted. IFRS 16 added trillions in lease liabilities to global balance sheets overnight.
Even after IFRS 16, material off-balance sheet items remain: contingent liabilities (pending litigation, warranties, financial guarantees), receivables that have been factored with recourse remaining with the seller, and certain derivative positions. These items appear in the notes to the financial statements rather than on the face of the balance sheet.
Mitigation: Never analyse the balance sheet without reading the notes. The accounting policies note, contingent liabilities note, and operating lease commitment tables (for pre-IFRS 16 comparison periods) contain material information about economic obligations not visible on the balance sheet face. For credit analysis, add disclosed off-balance sheet obligations to reported debt to arrive at an adjusted leverage ratio.
What These Limitations Mean for FP&A Planning
Each balance sheet limitation has a direct implication for how finance teams should use balance sheet data in planning and forecasting.
- Historical cost: Asset-heavy businesses planning from book values may be working from a distorted capital base. Capital allocation, return on assets analysis, and debt capacity assessment all require acknowledging the gap between book value and market value for material asset categories.
- Intangible assets: For knowledge-intensive businesses, enterprise value will diverge significantly from book value. Valuations, M&A assessments, and strategic planning must supplement balance sheet figures with independent valuations of brand, IP, and customer relationships.
- Point-in-time snapshot: Single year-end balance sheets are insufficient for working capital planning. Rolling 13-week cash flow forecasts, which track inflows and outflows continuously, are the standard FP&A tool for addressing this limitation
- Estimates and assumptions: Peer benchmarking and competitor analysis require normalising for accounting policy differences before ratio comparisons are valid. A higher P/B ratio may reflect accounting conservatism rather than overvaluation.
- Window dressing: Covenant monitoring and credit assessment should not rely solely on year-end balance sheets. Intra-year data and cash flow analysis provide a more reliable picture of the underlying financial position.
- Off-balance sheet: Adjusted leverage ratios that include disclosed off-balance sheet obligations should be standard in any credit analysis or capital structure planning work. The notes to the financial statements are as important as the face of the balance sheet.
How to Mitigate Balance Sheet Limitations
1. Combine the Balance Sheet with the Cash Flow and Income Statements
The cash flow statement provides liquidity insight that the balance sheet cannot: how cash moved in and out of the business during the period, whether operating activities are generating or consuming cash, and whether the cash on the balance sheet is the result of operations or external financing. The income statement provides the revenue and cost context that the balance sheet lacks.
Together, the three statements answer questions that no single statement can: is the company profitable and cash-generative? Is it using its assets efficiently? Is debt at a sustainable level relative to earnings? Use the three-statement model as the standard unit of financial analysis, not the balance sheet in isolation.
2. Use Fair Value Adjustments and Revaluation
Where accounting standards permit, revalue assets to reflect current market values. Under IFRS, property, plant, and equipment can be held at revalued amounts, with changes recognised in other comprehensive income. For planning purposes, even where formal revaluation is not required, document the estimated gap between book value and market value for material asset categories in management commentary.
For financial analysis, supplement balance sheet book values with market data for liquid assets (securities, real estate with active markets) and independent valuations for significant illiquid assets. Present both the balance sheet value and the estimated market value in strategic planning documents so decision-makers understand the actual economic position.
Read: The 7 Core Components of a Financial Model Every FP&A Professional Should Master
3. Incorporate KPIs for Intangible Assets
Track and report KPIs that reflect the value of the intangible assets the balance sheet excludes. Brand equity measures (NPS, brand value indices, customer acquisition cost trends), intellectual property metrics (patent counts, citation rates, licensing revenue), and human capital indicators (retention rates, revenue per employee, training investment) all provide partial visibility into the asset base that accounting standards exclude.
Include these metrics alongside the formal financial statements in board reporting and investor communications. For companies where intangible assets represent the majority of economic value, the KPI dashboard is often more informative than the balance sheet itself.
4. Integrate Forward-Looking Analysis
The balance sheet is retrospective by nature. Overcoming this limitation requires integrating forward-looking analysis: rolling forecasts that project the balance sheet forward based on current assumptions, DCF analysis that values the business on future cash generation rather than historical asset values, and scenario planning that tests the balance sheet position under different economic conditions.
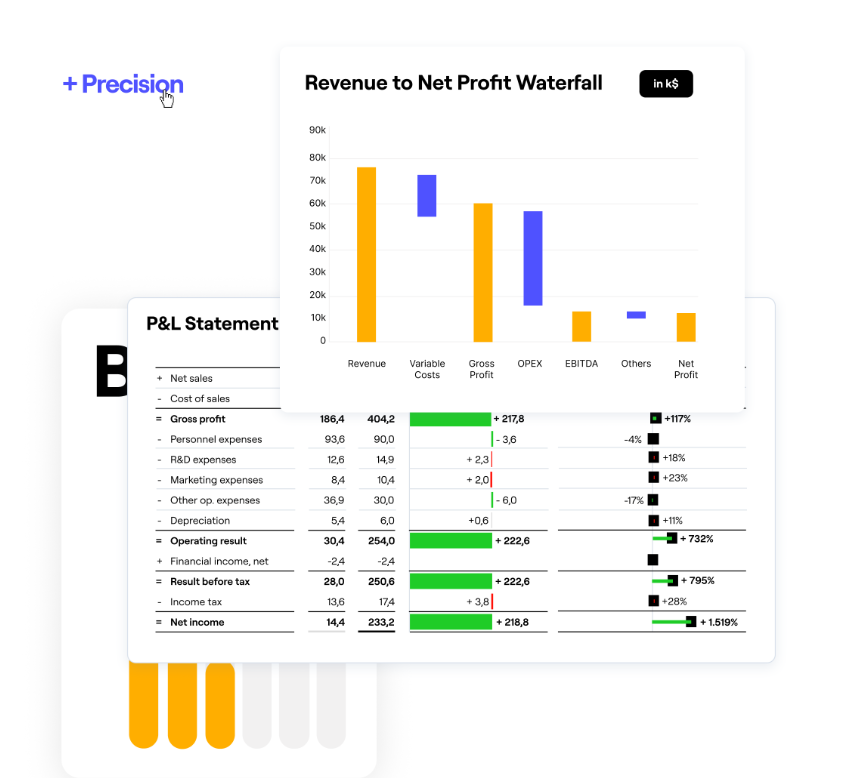
Farseer: The forward-looking analysis methods above are most powerful when run against a current, connected financial model rather than a static balance sheet. Farseer connects the balance sheet directly to live actuals, so the three-statement model reflects current data as soon as each period closes. Scenario analysis runs against that current position rather than a month-old snapshot. This directly addresses the point-in-time limitation: Farseer’s rolling forecast keeps the balance sheet forward view current throughout the year rather than at a single reporting date. Explore Farseer’s three-statement planning capabilities at farseer.com/solutions/three-statements/.
5. Conduct Regular Financial Health Reviews
Periodic reviews using a range of tools, including balance sheet, cash flow analysis, ratio analysis, market valuations, and forward projections, ensure that stakeholders maintain an accurate and current understanding of the company’s financial position. Regular review cycles also make it harder to sustain window dressing, since intra-year data will reveal patterns inconsistent with year-end presentations.
The standard for best-practice financial reporting is monthly management accounts including all three financial statements, updated KPIs for key intangible asset categories, and rolling forecast updates that extend the view forward rather than simply comparing actuals to prior-year budgets.
Conclusion
The balance sheet is a valuable and necessary tool for understanding financial position. Its limitations are structural features of accounting standards, not evidence that the balance sheet is unreliable. They are simply reminders that it is one source of information among several.
The seven limitations covered in this article, including historical cost, intangible asset exclusion, point-in-time snapshot, estimates and assumptions, lack of cash flow, window dressing, and off-balance sheet items, each create a specific gap between the reported balance sheet and the company’s full economic position. Understanding those gaps is what separates a finance professional who reads financial statements from one who analyses them.
The mitigations are practical: combine the balance sheet with the other two financial statements, supplement with market valuations and KPIs for intangibles, use rolling forecasts to address the snapshot limitation, and always read the notes before concluding an analysis is complete.
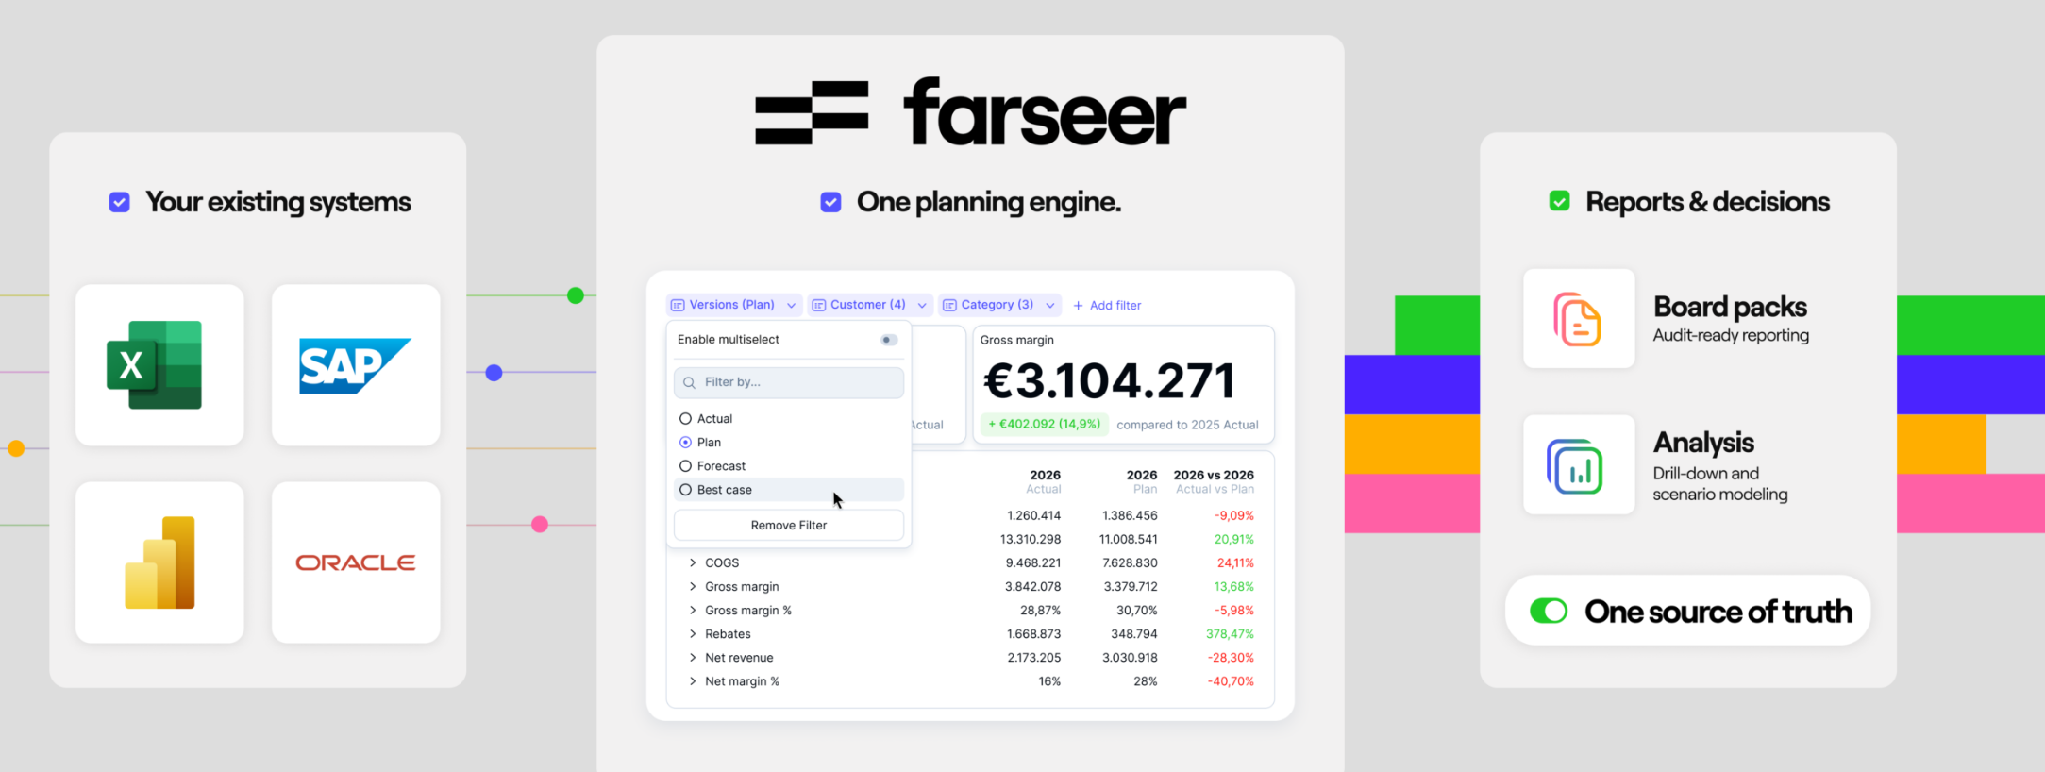
Farseer: The balance sheet limitations described in this article are structural features of accounting standards that cannot be eliminated by any single tool. What a connected planning platform can do is reduce the planning decisions made on the basis of the balance sheet in isolation. Farseer’s connected model links the balance sheet to the income statement and cash flow statement in real time, supplements the static snapshot with rolling forecasts and scenario analysis, and surfaces the trend data that single-period balance sheet analysis cannot provide. If your team is making planning decisions from year-end balance sheets and annual budgets, Farseer provides the infrastructure to move to a continuously current view. Explore the platform at farseer.com.

FAQ
What are the main limitations of the balance sheet?
The seven primary limitations are: reliance on historical cost rather than current market value; omission of most internally generated intangible assets; the fact that it provides only a point-in-time snapshot; dependence on management estimates and assumptions; lack of cash flow information; vulnerability to window dressing; and the existence of off-balance sheet items that create material unlisted obligations.
Why can the historical cost principle be misleading?
Because assets are recorded at their original purchase price, the balance sheet may significantly undervalue assets that have appreciated over time. A building bought decades ago, a long-held investment, or land in an area that has developed substantially may show a book value far below market value. This understates the company’s true economic asset base and can distort return on asset ratios.
Why are intangible assets often missing from the balance sheet?
Internally generated intangible assets such as brand reputation, employee expertise, proprietary processes, and organically developed intellectual property are excluded because they are too difficult to measure reliably. Brand Finance’s 2024 study estimated that 79% of global intangible asset value is not disclosed in balance sheets. Intangibles acquired through acquisitions are capitalised, but self-developed ones are expensed as incurred.
What is window dressing on a balance sheet?
Window dressing is the practice of managing balance sheet presentation at the reporting date to show a more favourable position than the company’s typical operating condition warrants. Common techniques include temporarily repaying revolving credit at year-end, accelerating cash collections, and delaying supplier payments before the balance sheet date. Time-series analysis across multiple periods and intra-year data are the primary ways to detect it.
What are off-balance sheet items and why do they matter?
Off-balance sheet items are assets or obligations that do not appear on the face of the balance sheet but represent real economic commitments. They include contingent liabilities, operating leases before IFRS 16 and ASC 842, special purpose vehicles, and certain derivative positions. They matter because they can significantly understate a company’s true financial obligations, as Enron’s collapse in 2001 demonstrated. Reading the notes to the financial statements is essential for identifying them.
Why is the balance sheet alone not enough for financial analysis?
The balance sheet does not show how cash moves through the business, how performance changes over time, or future growth potential. It shows one date’s snapshot, not a trend. It excludes most intangible assets. It may reflect window dressing. And it may omit material off-balance sheet obligations. To get a complete financial picture, it must be combined with income statements, cash flow statements, KPIs, and forward-looking forecasts.
How can businesses overcome the limitations of the balance sheet?
The five key approaches are: combine balance sheets with cash flow and income statements; use fair value adjustments and independent valuations where book values diverge materially from market values; track KPIs for intangible asset categories; integrate forward-looking analysis including rolling forecasts, DCF, and scenario planning; and conduct regular financial health reviews using intra-year as well as year-end data.

Financial Statement Analysis: The Complete Guide (With Step-by-Step Process)
Read more
Best Financial Analysis Tools in 2026: Compare Features & Pricing
Read more