What Is an Operating Statement? Definition, Example & Uses

The operating statement is the go-to report for figuring out if your business is making money. It shows how much you’re earning, how much you’re spending, and what’s left over, plain and simple.
This report helps you keep track of your profits and understand where your money is going. It’s an essential tool for creating budgets, checking your financial health, and preparing for meetings with investors or stakeholders.
In this blog, we’ll explain what an operating statement is, how it works, and why it matters.
What is an Operating Statement?
A Report with Many Names
The operating statement is also called the income statement, profit and loss statement (P&L), statement of earnings, statement of activities, or statement of financial performance. No matter what it’s called, its purpose is the same: it tracks how much money came into your business, how much went out, and how much profit (or loss) is left over.
Why Operating Statement Is Essential
This report gives you a clear view of your business’s financial performance over a specific period, like a month, quarter, or year. It shows if you’re earning more than you’re spending and highlights areas where you might need to adjust.
For example, if revenue is growing but expenses are rising at the same rate, you may need to dig deeper to cut unnecessary costs or adjust pricing to improve margins.
Part of the Bigger Financial Picture
The operating statement works together with the balance sheet and cash flow statement to give a full picture of your business’s financial health. While the balance sheet tracks assets and liabilities, and the cash flow statement shows money moving in and out, the operating statement focuses on profitability.
Breaking Down the Operating Statement
The operating statement organizes your business’s finances into sections, showing how much money you bring in, how much you spend, and what’s left over. Let’s go step by step using a simple example.
Revenue
Revenue is the total income your business earns from sales or services. It’s the first number on the operating statement and sets the foundation for the rest of the report. In this example, revenue is $100 million.
Cost of Goods Sold (COGS)
COGS includes all direct costs related to producing goods or delivering services, such as materials, labor, or hosting fees. Subtracting COGS from revenue gives you gross profit. Here, COGS is $60 million.
Gross Profit
Gross profit shows how much money is left after covering production costs. It’s a measure of how efficiently your business is generating profit from its core operations. In this example, gross profit is $40 million ($100 million – $60 million).
Revenue vs Gross Profit: Understanding the Difference to Avoid Planning Errors
Read moreOperating Expenses
Operating expenses include the costs of running your business, such as salaries, rent, utilities, and administrative costs. These are subtracted from gross profit to calculate operating income. Here’s the breakdown:
- Selling, General, and Administrative Expenses (SG&A): $10 million
- Inventory costs: $5 million
- Prepaid expenses: $3 million
The total operating expenses are $18 million.
Operating Income
Also known as EBIT (Earnings Before Interest and Taxes), operating income shows your profit from main business activities before accounting for taxes or non-operating costs. In this example, operating income is $22 million ($40 million – $18 million).
Non-Operating Income/Expenses
Non-operating items include income or expenses that aren’t part of your core business, such as interest payments or one-time gains/losses. In this case:
- Interest Expense: $1.5 million
- Interest Income: $500,000
- Other Non-Operating Loss: $500,000
After accounting for these, total non-operating expenses are $1.5 million.
Income Before Taxes (EBT)
This is your income after accounting for non-operating items but before taxes. In this example, income before taxes is $20.5 million ($22 million – $1.5 million).
Income Tax Expense
This is the amount your business owes in taxes based on taxable income. In this case, income tax expense is $5.5 million.
Net Income
Net income is the final profit after all expenses, including taxes, have been deducted. It’s the “bottom line” that shows how much money your business truly earned. Here, net income is $15 million ($20.5 million – $5.5 million).
How the Operating Statement Looks?
Here’s how the operating statement looks when everything is added up:
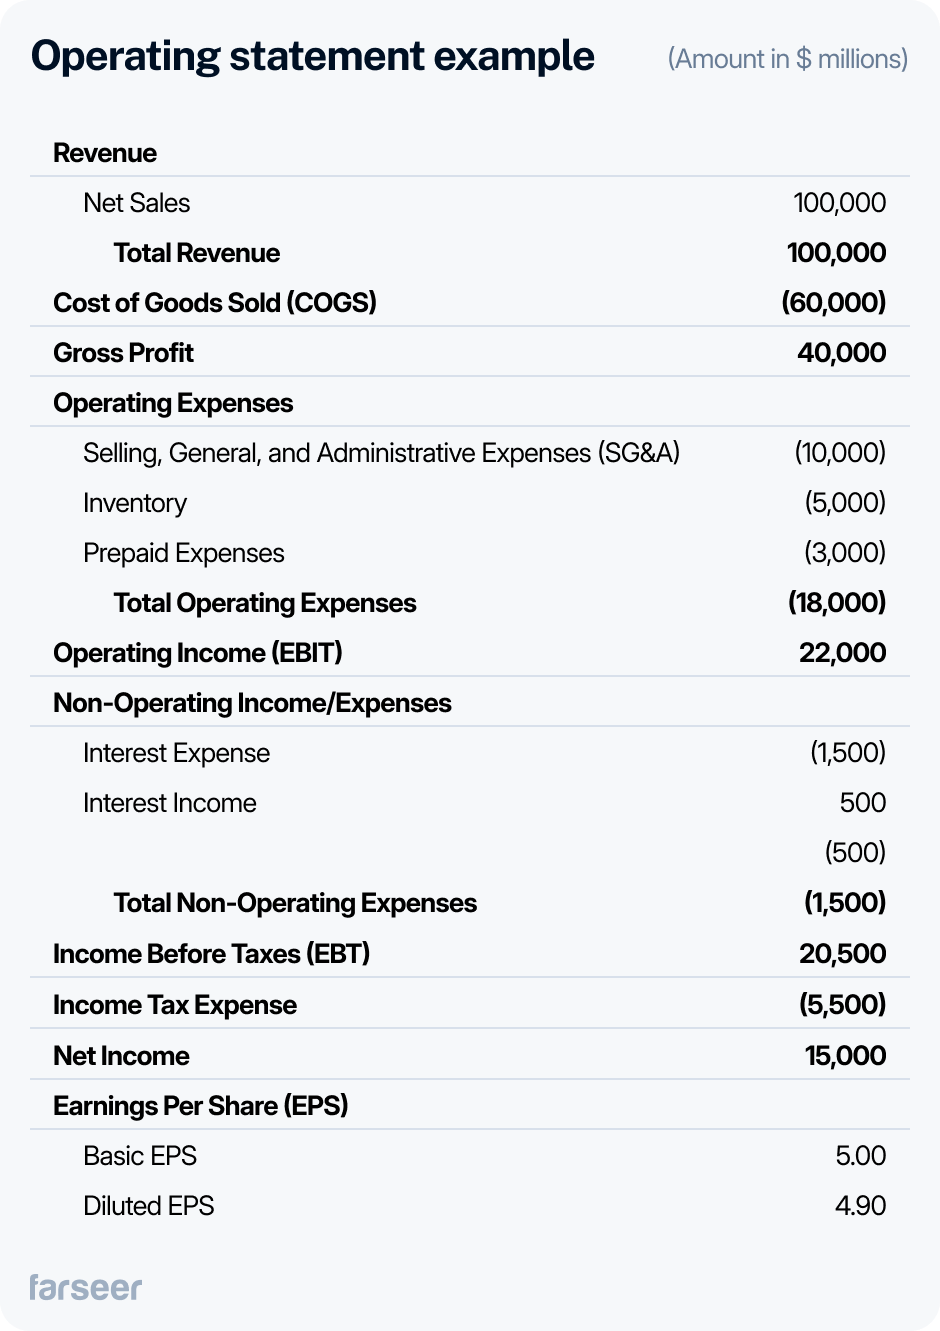
When you break it into sections, the operating statement clearly tells you how much money your business earns, spends, and keeps. Regularly reviewing it helps you track profitability and make better decisions.
Why Does the Operating Statement Matter?
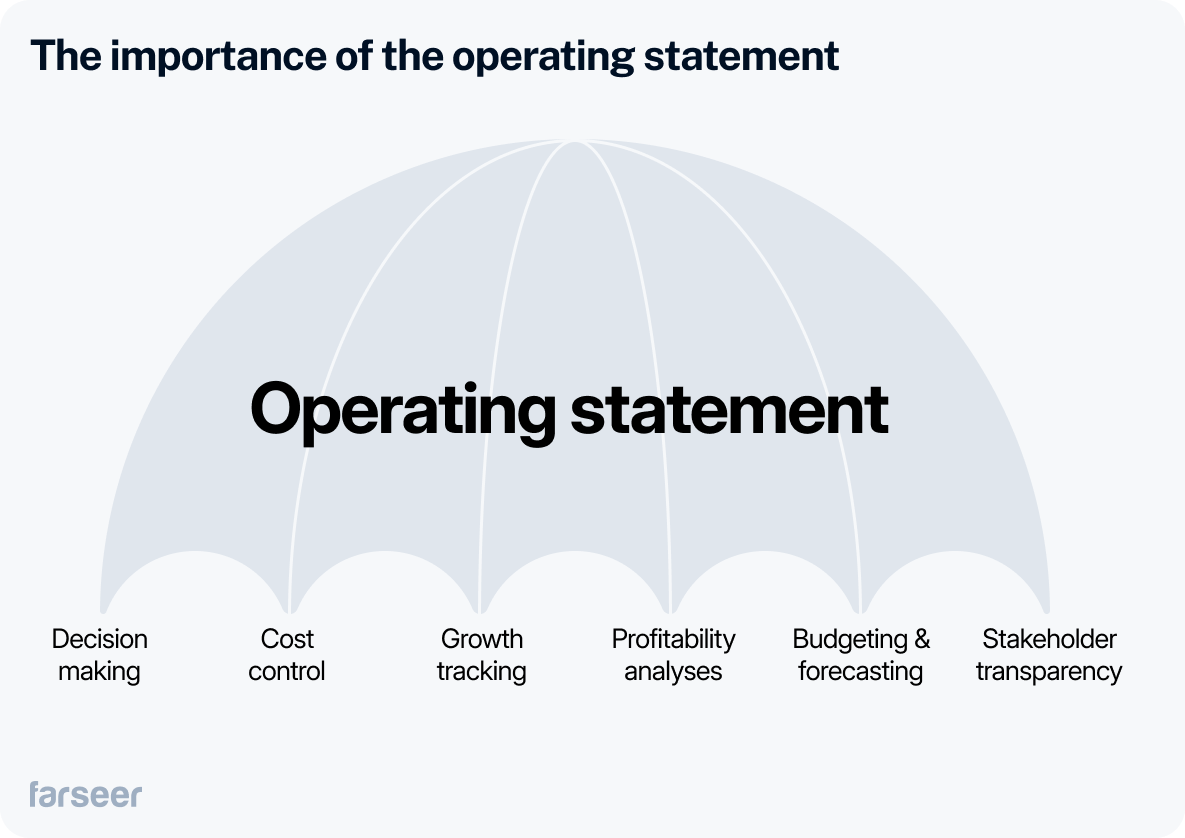
The operating statement is a powerful tool for making smarter financial decisions, managing costs, and building trust with stakeholders. Here’s how businesses use it:
For Decision-Making
The operating statement helps find trends in revenue and expenses. For example, a retailer noticing higher shipping costs can renegotiate contracts with suppliers to improve profit margins.
For Cost Control
Regularly reviewing the operating statement tells you if the company is overspending. A SaaS company might find inefficiencies in ad spending and focus on customer retention, which will improve profitability.
For Tracking Growth
Looking at operating statements over multiple periods helps track business growth. For example, a manufacturer may notice that although revenue is increasing, production costs are growing faster.
For Profitability by Segment
Breaking the operating statement into segments (like product lines or locations) helps learn which areas drive profit. For instance, a restaurant chain might find one location is underperforming because of higher labor costs and adjust schedules accordingly.
For Budgeting and Forecasting
Operating statements are the foundation for budgets and forecasts. Historical trends in revenue and expenses help businesses allocate resources effectively.
For Stakeholder Transparency
Investors and lenders rely on the operating statement to assess financial health. Showing profitability builds trust and confidence.
The operating statement also ties directly to liquidity metrics, helping you evaluate how easily your business can cover obligations.
How the Operating Statement is Different from Other Reports
The operating statement shows profitability over a period, but to get a complete picture, it’s important to understand how it compares to the balance sheet and cash flow statement.
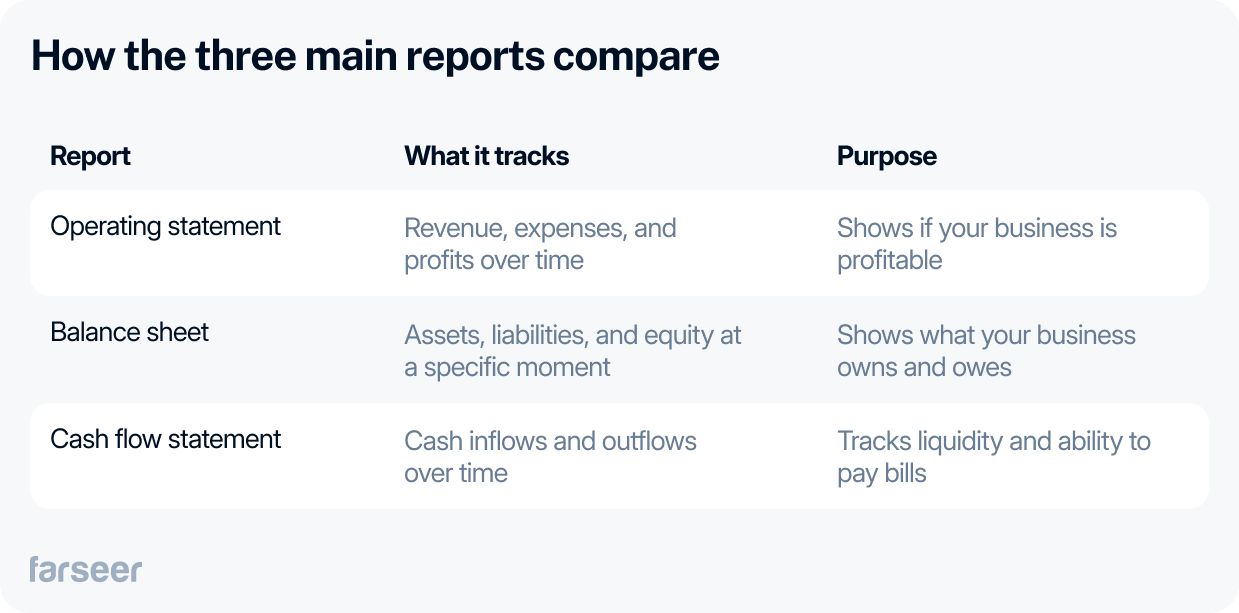
The balance sheet shows what your business owns (assets) and owes (liabilities) at a specific moment in time. It helps understand your company’s financial position, but it doesn’t tell you if your business is profitable. For example, you could have a lot of assets but still be losing money if your expenses are too high.
The cash flow statement focuses on how money moves in and out of your business. It’s useful for tracking liquidity and making sure you can cover your bills, but it doesn’t show whether your business is actually earning a profit. That’s where the operating statement comes in.
Each of these reports plays a unique role. The operating statement focuses on earnings, the balance sheet tracks financial position, and the cash flow statement shows liquidity. Together, they give you a full understanding of your business’s financial health. If you’d like to dive deeper into balance sheets, check out our guide on the classified balance sheet.
Common Operating Statement Mistakes
An operating statement is only as useful as how you review and use it. Avoid these common mistakes to get the most out of it:
Not Reviewing the Operating Statement Regularly
If you only check your operating statement occasionally, you’re likely missing problems or opportunities. Regular reviews help you catch issues early, like rising expenses or slowing revenue growth.
Misclassifying Expenses In the Operating Statement
Mixing operating costs (like payroll and rent) with non-operating items (like interest or one-time costs) can throw off your results. Keep these categories separate to see a clear picture of your profitability.
Learn more in our guide on the expense recognition principle.
Ignoring the Full Picture
It’s easy to focus on just revenue or expenses, but ignoring non-operating items (like interest or other costs) can lead to incomplete insights. These items impact your bottom line more than you might expect.
Forgetting to Compare Budget vs. Actual
If you’re not comparing your actual results to your budget, you’re flying blind. Spotting variances helps you figure out where you’re overspending or falling short so you can adjust.
Doing Everything Manually
Manually crunching numbers is time-consuming and risky. Mistakes happen, and they can cost you. Use tools like Farseer to automate calculations and make analysis easier.
Conclusion
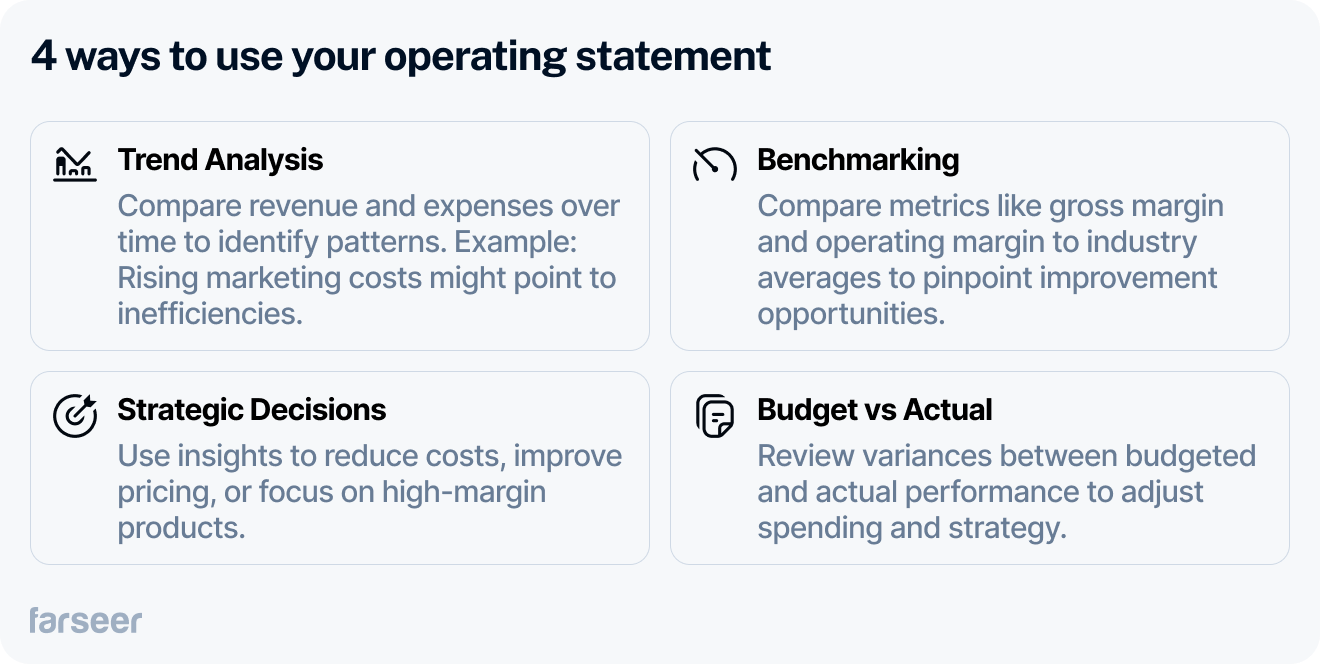
The operating statement is a critical tool for tracking profitability, controlling costs, and driving business growth. By breaking down revenue, expenses, and profits, it helps you make informed decisions, identify inefficiencies, and plan for the future. Whether you’re comparing trends, benchmarking performance, or reviewing budget vs. actual results, the operating statement provides the insights you need to improve your financial health.
Avoid common mistakes, review it regularly, and use tools like Farseer to streamline your analysis. Start using your operating statement today to make smarter decisions and grow your business.


Financial Statement Analysis: The Complete Guide (With Step-by-Step Process)
Read more
Best Financial Analysis Tools in 2026: Compare Features & Pricing
Read more