Do you wonder if your business can survive both today’s demands and tomorrow’s challenges? Liquidity and solvency ratios reveal if a business is built to last.
In this guide, we’ll cover the essential ratios that finance teams use to stay agile in the short term and secure for the long haul.
Read: A Complete Guide to Financial Statement Analysis for Strategy Makers
What Are Liquidity and Solvency?
Before going into specifics of liquidity and solvency ratios, let’s explain the terms of liquidity and solvency.
Liquidity is a company’s ability to pay its upcoming bills (supplier invoices, payroll, and rent) using assets that can quickly turn into cash, like cash on hand, receivables, and short-term investments. This simply means that the everyday operations can run smoothly.
To understand liquidity, it is important to be familiar with current assets. If you want to learn more, read: How to Make the Current Assets Formula Work for You.
Solvency is a company’s ability to manage long-term debts while continuing to grow. It shows if a business has enough assets and financial strength to pay off big obligations, like loans and bonds, over time without risking stability.
Example:
FMCG companies have constant cash flow needs and focus on liquidity so they can cover daily costs like inventory and payroll. Manufacturing companies invest heavily in equipment and facilities, so they have to prioritize solvency to pay off large, long-term debts tied to these assets.
3 Liquidity Ratios Helping Manage Short-Term Cash Flow
Liquidity ratios are metrics that tell us if a company can cover its upcoming bills using assets that can quickly turn into cash. They look at expenses coming up within the next year. Below are the most important and commonly used ratios.
Current Ratio
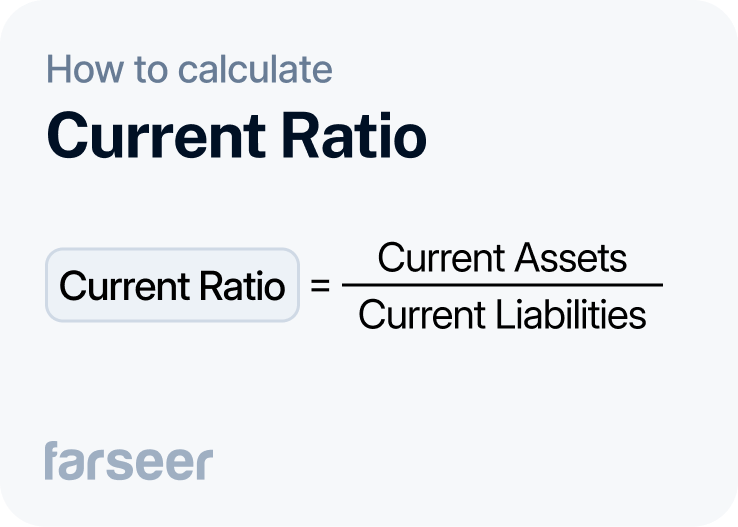
The current ratio shows how well a company can cover short-term obligations with its current assets.
Formula: Current Ratio = Current Assets / Current Liabilities.
A retail company with seasonal peaks will track the current ratio to make sure it can cover expenses during slower periods. A ratio above 1 generally tells us that there are enough assets to meet liabilities. The ideal ratio level is different across industries though.
In 2014, Apple had a current ratio of about 1.63, but lately, they’ve been keeping it around 0.99. This helps them invest in growth more, rather than holding a lot of cash on hand.
Also read: 7 Balance Sheet Ratios for Better Financial Decision-Making
Quick Ratio
The quick ratio (also known as the Acid-test ratio) gives a more conservative view of liquidity. It excludes inventory and focuses only on assets that can be converted to cash quickly.
Formula: Quick Ratio = (Current Assets – Inventory) / Current Liabilities
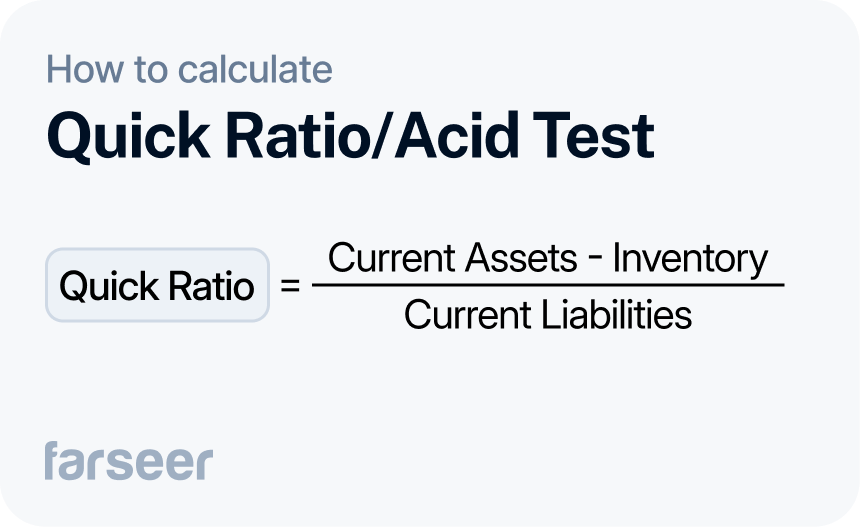
Tech firms traditionally have low inventory, so they often rely on the quick ratio to get a more accurate sense of their short-term financial situation.
Microsoft, for example, keeps its quick ratio above 1.0. That way they can comfortably cover short-term obligations and put cash into growth.
Cash Ratio
The cash ratio only looks at assets that can be used immediately to cover short-term liabilities (cash and cash equivalents). This makes it the strictest measure of liquidity.
Formula: Cash Ratio = Cash and Cash Equivalents / Current Liabilities
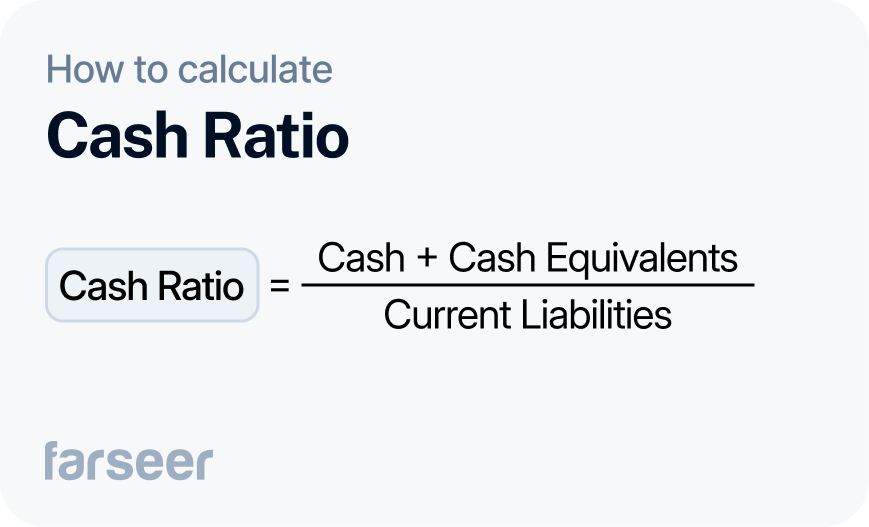
It’s particularly useful for companies in unpredictable markets. Generally, a cash ratio around 1.0 means a company has enough cash on hand to cover all its immediate bills. If it’s below that, the company may need other liquid assets to cover short-term obligations. A ratio higher than 1.0 could mean it’s holding too much cash and not investing enough in growth.
Some stable companies, like Johnson & Johnson, can afford to keep it relatively low. In December of 2023, theirs was 0.5, which meant that they could theoretically cover only half of their short-term obligations with cash. In their case, this is not a reason for concern because they balance cash reserves with other assets and investments.
If you want to learn more about the cash ratio, read: Cash Ratio Definition – A Simple Guide to Liquidity + Examples.
4 Solvency Ratios Showing Long-Term Financial Strength
Solvency ratios tell us if a company can handle its long-term debts and keep growing. They focus on obligations that go beyond the next year. Below are the most important and commonly used ratios.
Debt-to-Equity Ratio
The debt-to-equity ratio measures how much a company’s relies on borrowed funds versus its own equity to finance assets.
Formula: Debt-to-Equity Ratio = Total Debt / Total Equity
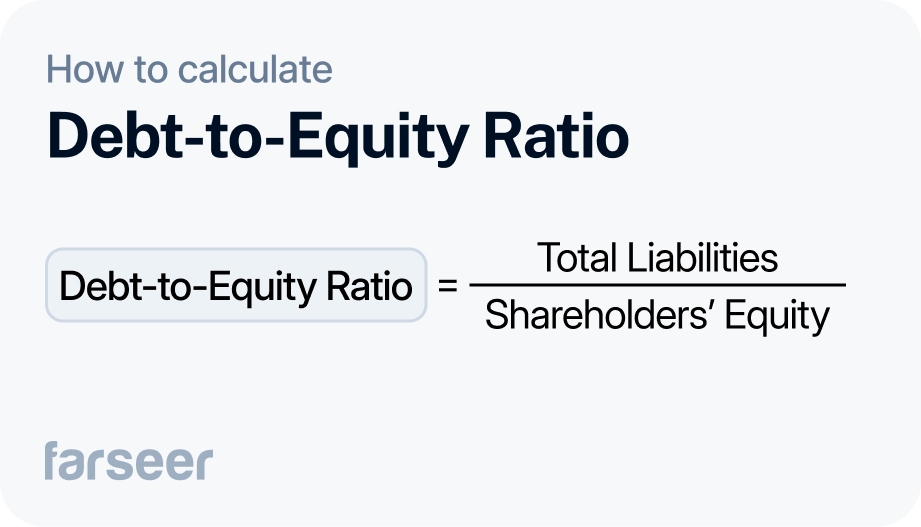
Capital-heavy industries, like manufacturing, often mean higher debt-to-equity ratios. Companies in those industries have to take on a lot of debt to fund their infrastructure and large equipment. In general, a lower ratio means that the company relies on debt less, which means they risk less. But, every industry has its own standards for what is considered healthy here, so it’s important to look at these ratios in a broad context.
For example, Tesla had a debt-to-equity ratio of 0.08 at the end of 2023. They kept the debt low, so they could save on interest and focus on growth.
Interest Coverage Ratio
The interest coverage ratio shows how easily a company can cover interest payments on its debt with its earnings.
Formula: Interest Coverage Ratio = EBIT / Interest Expenses
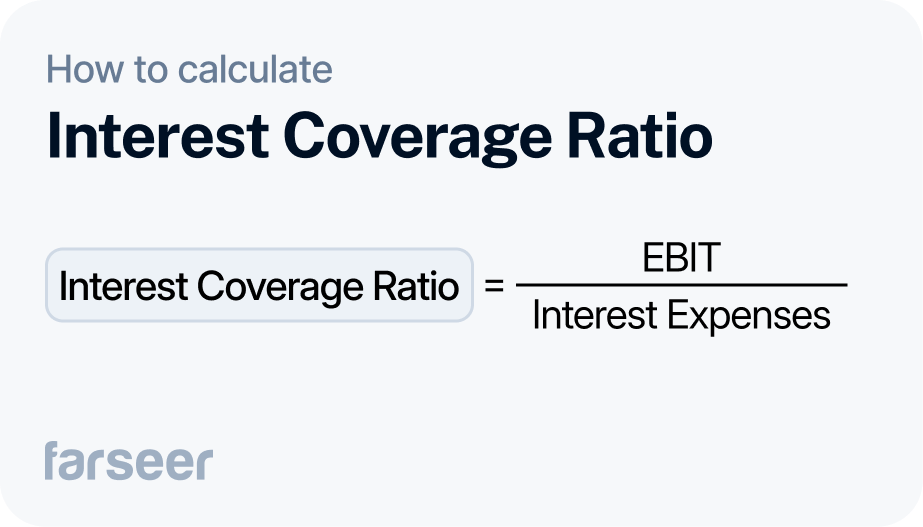
A higher ratio generally means the company can cover its interest more easily. When it’s above 2 that means they’re safe. 5 and up shows strong financial health. 10 or more means that a company is in a very secure position.
For example, Home Depot had an interest coverage ratio of 11.25 in early 2024. This means that their earnings could cover their interest over eleven times and that they had plenty of room to handle slow periods.
Debt-to-Assets Ratio
The debt-to-assets ratio shows how much of the company’s assets are funded by debt rather than equity.
Formula: Debt-to-Assets Ratio = Total Debt / Total Assets
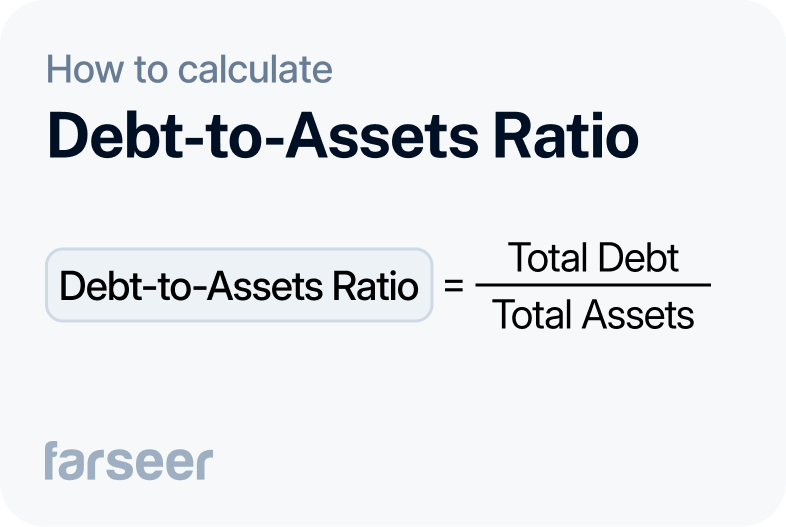
A lower ratio (below 0.5) means less reliance on debt, which, naturally, means lower risk. 0.5 is moderate, and common in stable industries like utilities. When it’s above 0.6 that means more debt financing, which can be riskier.
In December 2023, Duke Energy’s debt-to-assets ratio was 0.41. So, 41% of its assets were funded by debt. Their industry is steady, and this ratio allows Duke Energy to balance debt and revenue, and keep the risk minimal.
Equity Ratio
The equity ratio shows how much of a company’s assets are funded by shareholders’ equity instead of debt.
Formula: Equity Ratio = Total Equity / Total Assets
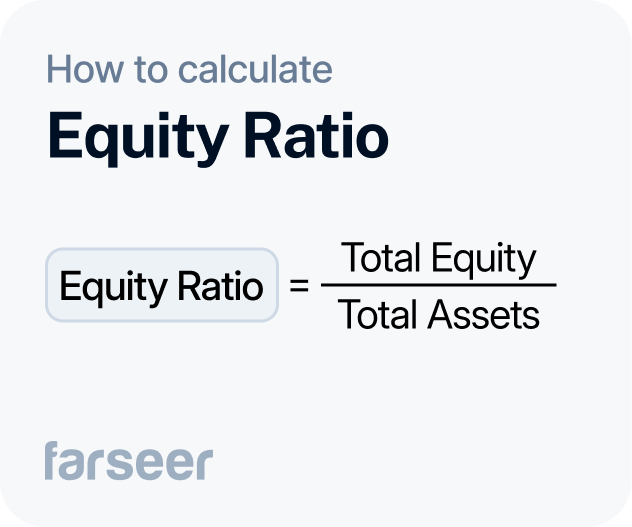
A higher equity ratio means the company is probably more financially stable because it doesn’t rely on borrowing too much.
Companies with an equity ratio above 0.5 are considered pretty conservative. They rely more on their funds than on debt to finance assets. This lowers their risk and investors and lenders also like it. It also means flexibility and stability.
Liquidity vs. Solvency Ratios – Why Both Matter
Solvency and liquidity ratios tell you different things about the company’s financial health. Liquidity ratios focus on covering short-term bills, while solvency ratios look at how to handle long-term debt. Both are important for a full picture.
High liquidity but low solvency means that the company can cover daily expenses easily but struggle with larger, long-term debts. Strong solvency but low liquidity means that it can handle long-term obligations well but risk cash flow issues which will affect daily operations.
Tracking these ratios together keeps finances balanced. Liquidity supports day-to-day needs, while solvency keeps the business strong for the long haul, often guiding companies to follow the pecking order theory when deciding between debt and equity.
If you want to have an even deeper view into your business’s financial health, pair the ratios mentioned with profitability ratios.
Read: Profitability Ratios Definitions and How to Use Them (with Examples).
Liquidity and solvency ratios are key to keeping a company financially healthy and prepared for whatever comes next. Tracking these ratios helps finance teams handle both day-to-day expenses and long-term plans with confidence.
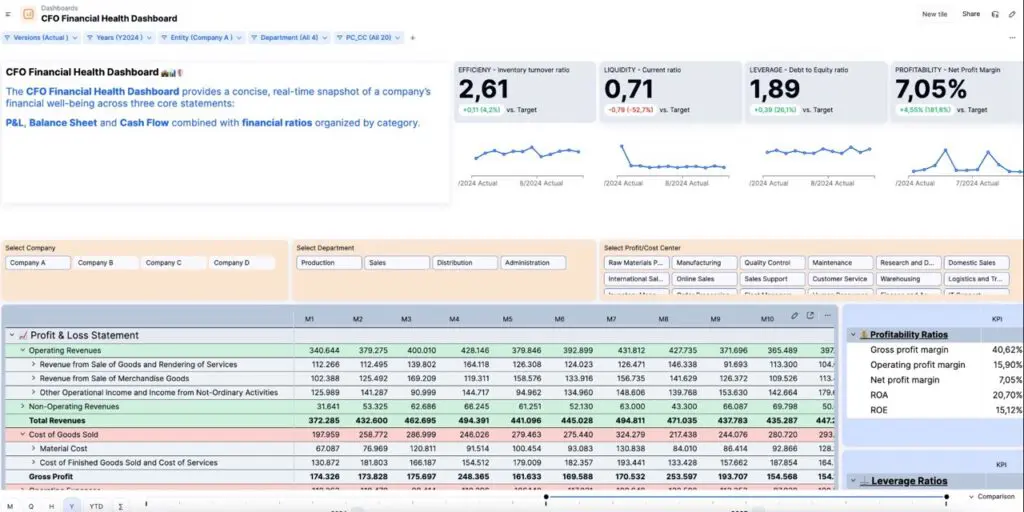
With FP&A tools like Farseer, monitoring these metrics gets easier through automated tracking and real-time insights. Having the right data at hand lets finance teams make fast, smart decisions to support cash flow and future growth.
