9 Key Balance Sheet Ratios Every Finance Team Should Track (With Industry Benchmarks)

Balance sheet ratios convert raw financial data into standardised metrics that can be compared across companies, industries, and time periods. A current ratio of 1.8 tells you more about a company’s liquidity than a working capital figure of £4.2 million, because the ratio is comparable to industry benchmarks and to the same company’s position last year.
This guide covers the nine most important balance sheet ratios and metrics: their formulas, what they signal, how to interpret them in the context of real industries, and how to use them together to get a complete picture of financial health.
Read more: Strategic Financial Planning That Actually Drives Results
Why Balance Sheet Ratios Matter
Managing liquidity. The current ratio, quick ratio, and cash ratio tell you whether the company has enough liquid assets to cover near-term obligations. Tracking these over time surfaces cash flow problems before they become crises.
Managing debt and leverage. The debt-to-equity ratio, debt-to-assets ratio, and interest coverage ratio reveal how much the company relies on borrowed capital and whether its operating earnings are sufficient to service that debt comfortably.
Assessing long-term stability. The equity ratio and asset coverage ratio show whether the company is financially self-sufficient or increasingly dependent on external financing. These are the metrics that matter most for strategic planning, credit applications, and investor presentations.
According to a Gartner survey of 251 CFOs conducted in October 2024, metrics, analytics, and reporting ranked as the top priority for finance leaders heading into 2025. Balance sheet ratios are at the foundation of that analytical capability.
1. Current Ratio
The current ratio measures a company’s ability to cover short-term liabilities with short-term assets. It is the most widely used liquidity metric and the first ratio most analysts examine when assessing near-term financial health.
Current Ratio = Current Assets / Current Liabilities
A current ratio above 1.0 means the company has more current assets than current liabilities. A ratio below 1.0 means it does not, and would need to draw on credit facilities or sell longer-term assets to meet obligations as they fall due.
Industry example: Nestle targets a current ratio between 1.1 and 1.5. This keeps operations running smoothly without overcommitting resources to idle current assets. In fast-moving consumer goods, where inventory turns over quickly, a ratio in this range is appropriate. A much higher ratio might indicate excess cash or inventory that could be deployed more productively.
Warning signal: A current ratio trending from 1.8 toward 1.0 over four to six quarters warrants investigation. The trend matters more than any single data point.
2. Quick Ratio (Acid-Test Ratio)
The quick ratio excludes inventory from current assets, giving a more conservative liquidity view. It answers the question: can the company meet its short-term obligations without needing to sell stock?
Quick Ratio = (Current Assets – Inventory) / Current Liabilities
Inventory is excluded because it may not convert to cash quickly, particularly in industries where products are specialised or slow-moving. The quick ratio is the more reliable liquidity metric for businesses where inventory represents a significant share of current assets.
Industry example: Pfizer targets a quick ratio between 1.0 and 1.5 to ensure it can manage short-term expenses without relying on pharmaceutical inventory, which can take longer to liquidate than standard consumer goods.
Interpretation tip: Compare the current ratio and quick ratio together. A large gap between the two signals that inventory is a dominant component of current assets. A current ratio of 2.5 and quick ratio of 0.9 is a different risk profile from a current ratio of 2.5 and quick ratio of 2.1.
Read: Quick Ratio vs Current Ratio: Which One Tells You More About Liquidity?
3. Cash Ratio
The cash ratio is the most conservative of the three standard liquidity measures. Where the quick ratio excludes inventory, the cash ratio goes further and includes only cash and cash equivalents, excluding receivables as well.
Cash Ratio = Cash and Cash Equivalents / Current Liabilities
A cash ratio of 1.0 means the company could pay every current liability today from cash alone. In practice, most businesses operate with a cash ratio well below 1.0, because holding large amounts of idle cash is not efficient capital management. A cash ratio above 0.5 is generally adequate in most industries. A ratio approaching zero warrants attention.
When it matters most: The cash ratio is most useful when assessing a company under financial stress, when receivables quality is uncertain, or when evaluating whether a business has adequate liquidity reserves to navigate a sudden demand shock.
4. Debt-to-Equity Ratio
The debt-to-equity ratio measures how much a company relies on debt relative to equity to finance its operations. It is the primary leverage metric and one of the most closely watched by lenders and credit analysts.
Debt-to-Equity Ratio = Total Liabilities / Shareholders’ Equity
A higher ratio means greater reliance on debt financing, which amplifies both returns and risk. During periods of economic stress or rising interest rates, a high D/E ratio reduces financial flexibility and increases vulnerability.
Industry example: Verizon targets a D/E ratio between 1.5 and 3.0. Capital-intensive telecoms companies require substantial debt to fund infrastructure investment. This range allows Verizon to finance network expansion while maintaining a manageable risk profile. The same ratio at a technology company would be a significant concern.
Warning signal: A D/E ratio rising steadily without a corresponding increase in profitability or asset coverage signals increasing financial vulnerability. Always interpret D/E alongside Interest Coverage.
5. Debt-to-Assets Ratio
The debt-to-assets ratio shows what proportion of a company’s total assets is financed by debt. It is a broader leverage measure than D/E and is less sensitive to the size of shareholders’ equity.
Debt-to-Assets Ratio = Total Debt / Total Assets
A ratio of 0.4 means 40% of the company’s assets are financed by debt and 60% by equity or retained earnings. A ratio above 0.7 signals heavy debt dependence. During downturns when asset values decline, a high debt-to-assets ratio can mean the company’s assets no longer fully cover its liabilities.
Industry example: In manufacturing, a debt-to-assets ratio between 0.30 and 0.50 is typical, reflecting the need to finance equipment and facilities while maintaining a buffer against asset value decline.
Read: Liquidity and Solvency Ratios – Metrics for Your Business’ Survival
6. Interest Coverage Ratio
The Interest Coverage Ratio measures how many times over a company can pay its annual interest expense from operating earnings. It is one of the primary metrics lenders use to assess a borrower’s debt serviceability.
Interest Coverage Ratio = EBIT / Interest Expense
EBIT is Earnings Before Interest and Taxes. A ratio of 3.0 means operating earnings are three times the annual interest bill, providing a comfortable buffer against a revenue decline or cost increase. Most lenders require a minimum of 1.5 to 2.0. A ratio below 1.5 is a warning; below 1.0 means the company cannot cover its interest from operating earnings without drawing on reserves or additional financing.
Worked example: A manufacturing business with EBIT of 15 million and annual interest payments of 4 million has an interest coverage ratio of 3.75, comfortably above the minimum threshold. A telecoms business with the same EBIT but 10 million in annual interest has a ratio of 1.5, at the lower edge of what lenders accept.
Always pair with D/E: A high D/E ratio is manageable if interest coverage is strong. The combination of high D/E and low interest coverage is the most common signal of a company approaching financial distress.
7. Working Capital
Working capital is an absolute monetary metric, not a ratio. It measures the net short-term financial position of a business: how much is left after current liabilities are subtracted from current assets. A positive figure means the company can cover near-term obligations and has residual liquidity. A negative figure does not always indicate distress.
Working Capital = Current Assets – Current Liabilities
In most industries, positive working capital is the target. In retail and fast-moving consumer goods, negative working capital is common and often desirable: large retailers collect cash from customers before paying suppliers, effectively using supplier credit as a source of operational financing.
Industry example: Pharmaceutical distributors like AmerisourceBergen typically target working capital between 1.5x and 2.5x of monthly operating costs, ensuring adequate buffer to manage the timing differences between large inventory purchases and customer collection cycles.
8. Equity Ratio
The equity ratio shows what proportion of a company’s assets is financed by shareholders’ equity rather than debt. A higher equity ratio indicates greater financial independence from external financing.
Equity Ratio = Total Equity / Total Assets
Industry example: Microsoft maintains an equity ratio broadly in the 35% to 55% range across its recent financial years, reflecting strong retained earnings and a conservative approach to balance sheet leverage despite its capacity to carry significantly more debt.
Interpretation: A higher equity ratio is generally positive but should be evaluated in context. A ratio rising because retained earnings are accumulating is a positive signal. A ratio rising because the company is retiring debt is also positive. A ratio rising because assets are being written down is a warning.
9. Asset Coverage Ratio
The asset coverage ratio measures whether a company’s tangible assets are sufficient to cover its total debt obligations. It focuses specifically on tangible assets because intangible assets such as goodwill or brand value may not be recoverable in a distress scenario.
Asset Coverage Ratio = (Total Assets – Intangible Assets – Current Liabilities) / Total Debt
A ratio above 1.0 means tangible assets exceed total debt after deducting current liabilities. This provides a degree of security to lenders: even if the company cannot generate sufficient earnings to service debt, there are real assets that could be liquidated. A ratio below 1.0 means creditors are partially relying on intangible assets or future earnings, which carry higher recovery risk in default scenarios.
Industry Benchmark Ranges
Ratios only have meaning in context. The table below provides typical ranges by sector. These are reference ranges, not targets. A company should interpret its ratios against its own historical trend, its direct peer group, and these general sector benchmarks.
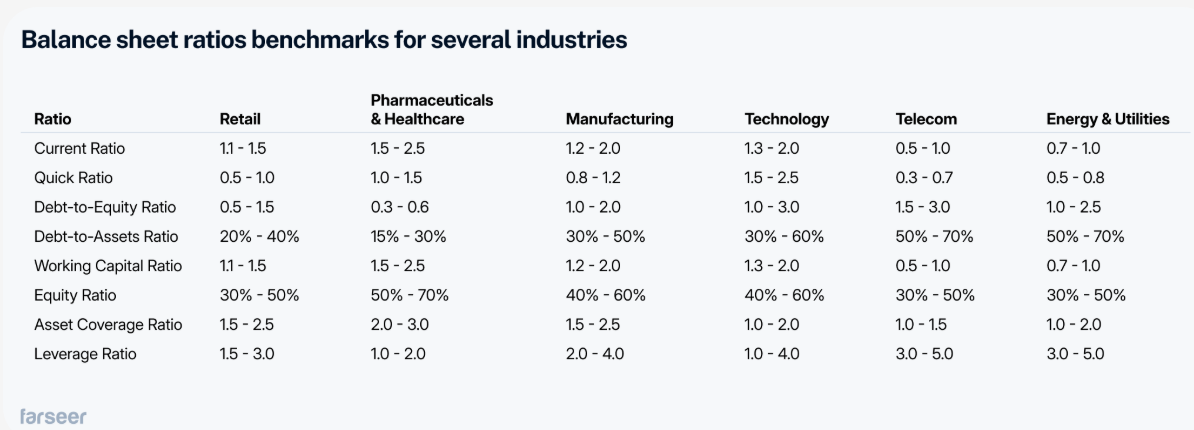
Note: these are indicative ranges based on broad sector averages. Individual companies within each sector vary significantly based on their specific business model, stage of development, and capital structure strategy. Always supplement sector benchmarks with direct peer comparison.
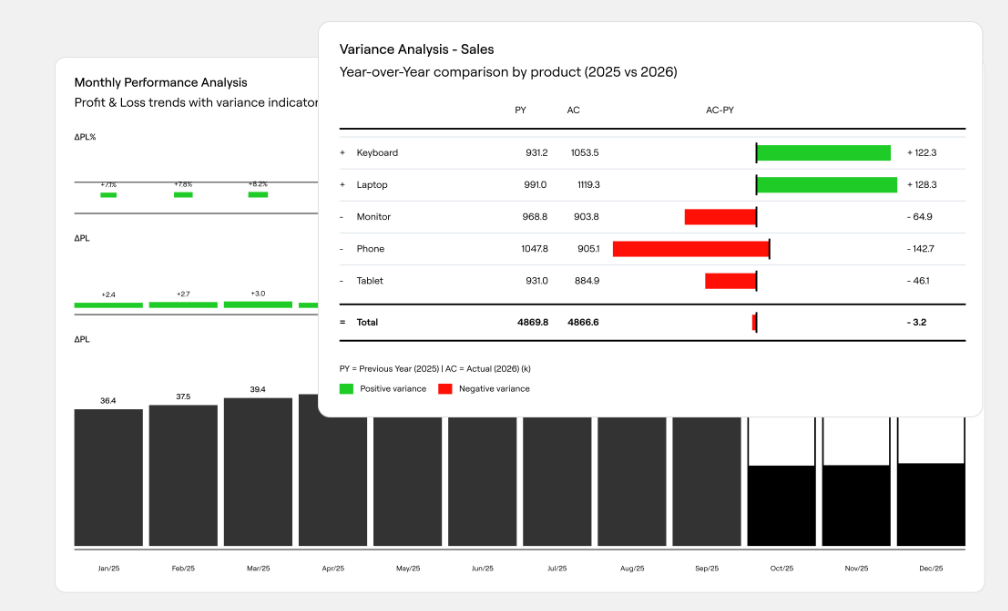
Farseer: Tracking balance sheet ratios across business units, geographies, or time periods requires consistent data from a single source. In practice, many finance teams calculate ratios from a mix of ERP exports, spreadsheet models, and management accounts that are not always consistent with each other. Farseer connects balance sheet data directly to planning models, so ratio dashboards update automatically as actuals arrive and remain consistent with the forecasts and scenarios the finance team is running. When a debt-to-assets ratio is trending toward its upper threshold, or a current ratio is approaching 1.0, finance teams using Farseer see the trajectory early and can run scenario analysis to understand the impact of different responses. Explore Farseer’s financial planning and reporting capabilities at farseer.com.
How to Use Balance Sheet Ratios Together
No single ratio provides a complete picture. The most informative analysis comes from reading ratios in combination and tracking the relationships between them.
Current Ratio and Quick Ratio (liquidity quality check). A large gap between the two ratios signals that inventory dominates current assets and may not convert to cash quickly. A current ratio of 2.5 with a quick ratio of 0.9 carries meaningfully different liquidity risk than a current ratio of 2.5 with a quick ratio of 2.1, even though the current ratio is identical.
Debt-to-Equity and Interest Coverage (debt serviceability check). High D/E alone is not a crisis signal. The Interest Coverage Ratio provides the missing context. A D/E of 2.5 with interest coverage of 6.0 is a manageable capital structure. A D/E of 2.5 with interest coverage of 1.4 is a potential distress signal that warrants immediate attention.
Equity Ratio and Working Capital trend (resilience check). A healthy equity ratio combined with declining working capital is an early warning of liquidity pressure building beneath an apparently stable balance sheet. Tracking both quarterly reveals trajectory before a problem becomes a crisis.
Read: Net Working Capital Explained: Formula, Examples & Why It Matters
The single most important discipline is tracking all nine metrics over time. A current ratio of 1.4 today is a snapshot. A current ratio declining from 2.1 to 1.4 over three years is a trend that warrants investigation regardless of where it sits relative to the benchmark range.
Putting Balance Sheet Ratios to Work in FP&A
Balance sheet ratios are most useful when they are embedded in the planning cycle rather than calculated once a year after the financial close. Three practical applications make ratio analysis proactive rather than retrospective.
- Include projected ratios in rolling forecasts. A rolling forecast that models the balance sheet as well as the P&L allows finance teams to see how planned decisions will affect liquidity and leverage ratios before commitments are made. A new credit facility, a capital investment programme, or an inventory build all affect balance sheet ratios. Seeing the projected ratio trajectory gives management the information to adjust the plan rather than discover the deterioration in the next set of management accounts.
- Use ratios as scenario analysis outputs. When building upside and downside scenarios, include the impact on key balance sheet ratios. A downside scenario that reduces revenue by 15% will also reduce EBIT, working capital, and interest coverage. Modelling the ratio outcomes of each scenario makes the financial implications of different futures concrete for non-finance stakeholders.
- Set ratio thresholds as early warning triggers. Define threshold levels for key ratios, such as a current ratio below 1.2, an interest coverage ratio below 2.0, or a D/E ratio above 2.5, and track them as leading indicators. When a ratio breaches a threshold, it triggers a structured review rather than waiting for the issue to compound into a larger problem.
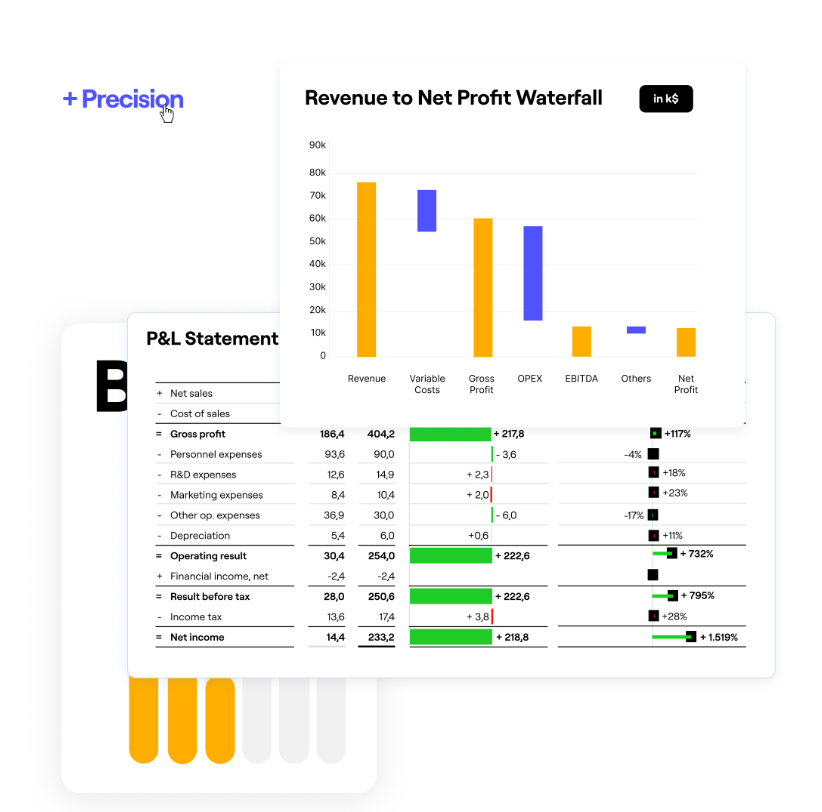
Farseer: Balance sheet ratios are most valuable when they are forward-looking rather than retrospective. Farseer’s three-statement modelling capability connects P&L, balance sheet, and cash flow so that a revenue assumption change flows through to working capital automatically, and a capex decision flows through to the debt-to-assets ratio without manual calculation. If your team builds rolling forecasts that stop at the P&L, Farseer provides the integrated balance sheet and cash flow view that makes ratio monitoring a planning tool rather than a reporting exercise. Explore the platform at farseer.com.

FAQ
What are balance sheet ratios?
Balance sheet ratios are financial metrics calculated from balance sheet line items that provide a standardised view of a company’s liquidity, leverage, and financial stability. Because they are dimensionless ratios, they are comparable across companies of different sizes and trackable over time to reveal trends that absolute figures cannot.
What is the most important balance sheet ratio?
There is no single most important ratio. The relevant metrics depend on the question being asked. For short-term liquidity, the current ratio and quick ratio matter most. For debt sustainability, the debt-to-equity and interest coverage ratios are primary. For long-term financial stability, the equity ratio and debt-to-assets ratio provide the clearest picture. The most effective approach is to track all key ratios together and look at the relationships between them.
What is a good current ratio?
A current ratio between 1.5 and 2.0 is considered healthy for most industries. A ratio below 1.0 indicates the company cannot cover short-term liabilities with current assets alone. A ratio above 2.5 may indicate excess cash or inventory that could be deployed more productively. Retailers and FMCG companies often operate with lower current ratios than manufacturers, because their inventory turns quickly and supplier credit provides operational financing.
What is the difference between the current ratio and the quick ratio?
The current ratio includes all current assets. The quick ratio excludes inventory, because inventory may not convert to cash quickly. If the two ratios are close together, inventory is a small portion of current assets. If there is a large gap, inventory dominates and the quick ratio gives the more reliable liquidity picture.
What is a good debt-to-equity ratio?
A D/E ratio below 1.0 means the company has more equity than debt. Between 1.0 and 2.0 is common for established businesses in most industries. Capital-intensive sectors such as telecoms and utilities typically carry ratios of 2.0 to 3.0. The key context is whether operating earnings, measured by interest coverage, are sufficient to service the debt comfortably. High D/E with strong interest coverage is manageable; high D/E with weak interest coverage is a risk signal.
Why is the benchmark table important for ratio analysis?
Ratios only have meaning in context. A debt-to-assets ratio of 45% is healthy for a manufacturer but high for a technology company. Industry benchmarks allow finance teams to assess whether their ratios reflect sound financial management or an outlier position that requires attention. The benchmarks in this article provide typical ranges by sector; the most informative comparison is always the company’s own historical trend and its direct peer group.
How often should balance sheet ratios be calculated?
Monthly calculation aligned with the management accounts close is best practice. Quarterly calculation is the minimum for meaningful trend tracking. Annual snapshots are insufficient for catching deteriorating trends early enough to act. For companies running rolling forecasts, including projected balance sheet ratios in the forward view allows ratio trends to be managed proactively rather than observed after the fact.
How does Farseer help teams track balance sheet ratios?
Farseer connects P&L, balance sheet, and cash flow in a single three-statement model, so balance sheet ratios update automatically as actuals arrive and remain consistent with forecasts and budgets. Ratio dashboards surface deteriorating trends in real time, and scenario analysis allows teams to model how planned decisions affect key ratios before commitments are made. This makes ratio monitoring a forward-looking planning tool rather than a retrospective reporting exercise.

Financial Statement Analysis: The Complete Guide (With Step-by-Step Process)
Read more
Best Financial Analysis Tools in 2026: Compare Features & Pricing
Read more