Visibility
Revenue, cost and allocation logic lives in disconnected reports and spreadsheets.
You see margin totals, but not the drivers behind them.
Farseer replaces static reports with dynamic, driver-based profitability analysis.
Build profitability on structured logic, not spreadsheet assumptions.
Trusted by enterprise finance teams


Revenue, cost and allocation logic lives in disconnected reports and spreadsheets.
You see margin totals, but not the drivers behind them.
Cost allocations lack structure and transparency.
Shared services and overhead are spread with inconsistent rules.
Testing pricing, mix, or cost changes means rebuilding models.
What-if analysis is slow, manual, and disconnected from your actual reporting logic.
Close the gap between your source systems and your final board pack. Replace the chaotic Excel middle-layer with a single, governed planning engine.

Multi dim profitability
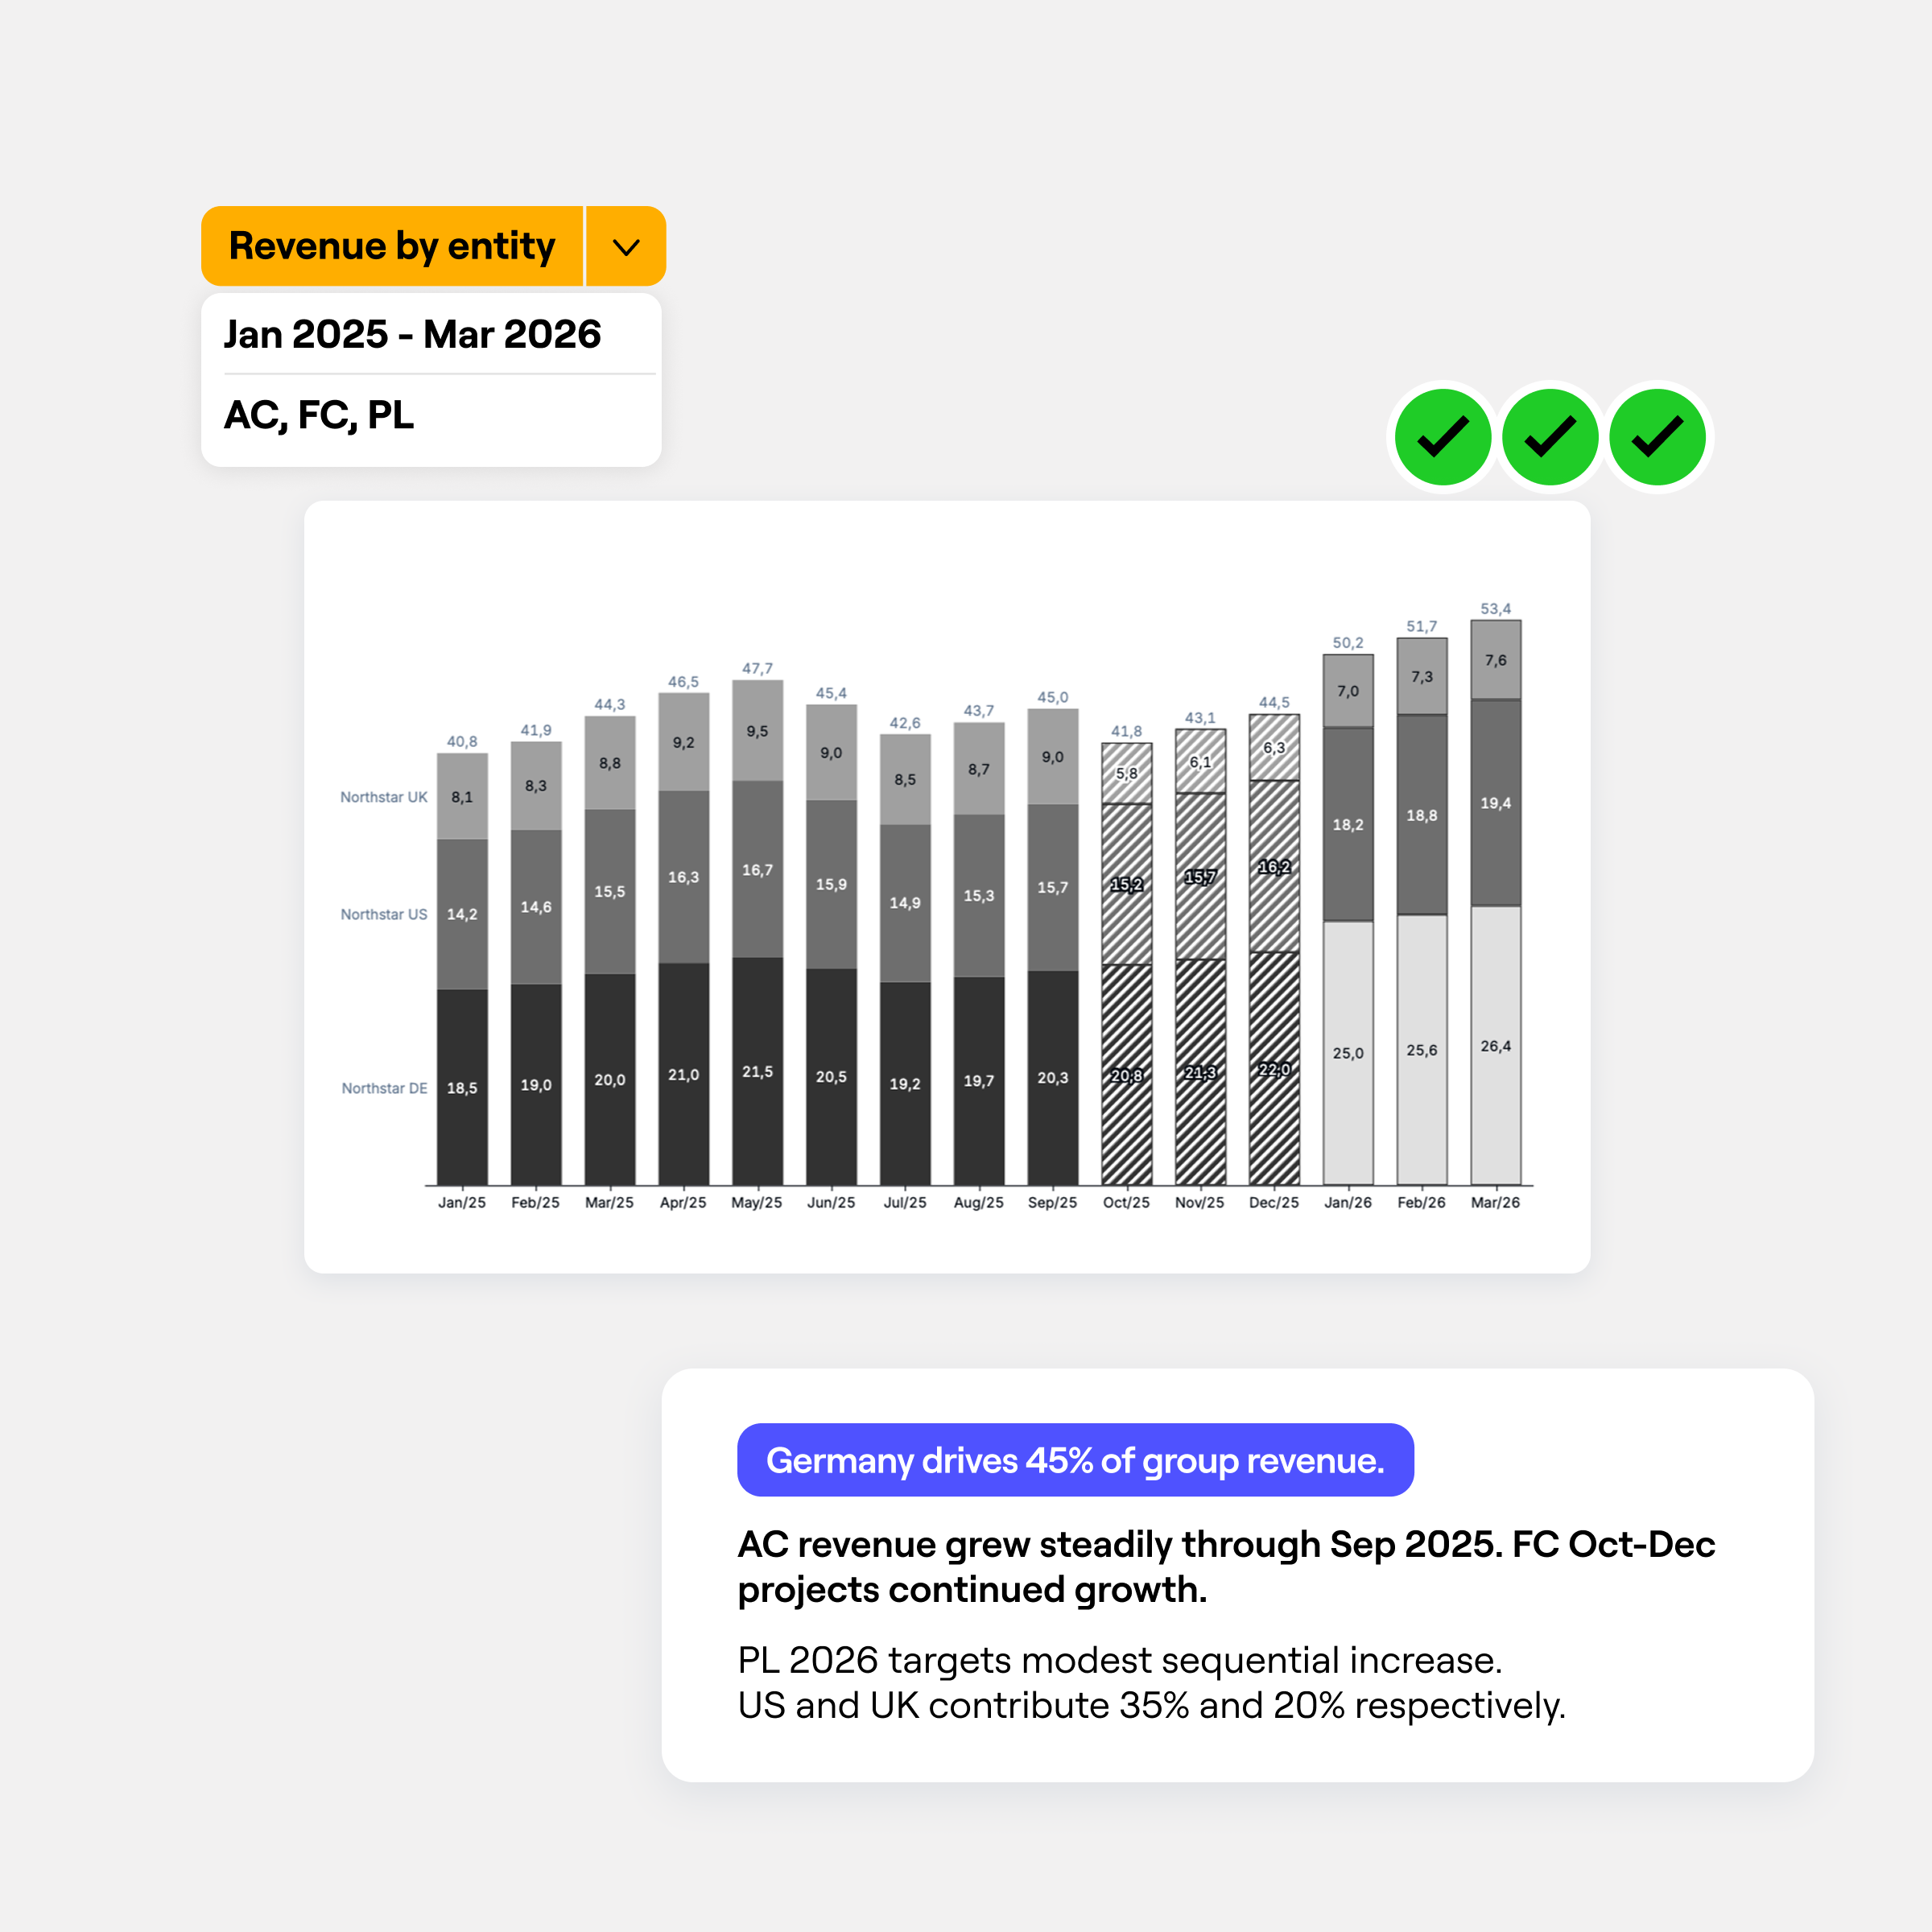
Violeta tracks profitability across hundreds of SKUs in one model, sliced by product line, geography, and channel with cost allocations that hold up at every level of detail.
Live profitability
Change pricing, mix, or cost assumptions and see margin impact recalculate the moment you save. No exports, no overnight refresh, no “let’s see at month end.”
Cascade across statements
Margin changes flow through P&L, balance sheet, and cash flow simultaneously powered by the Rama in memory engine. The CFO and the analyst see the same number from the same logic.
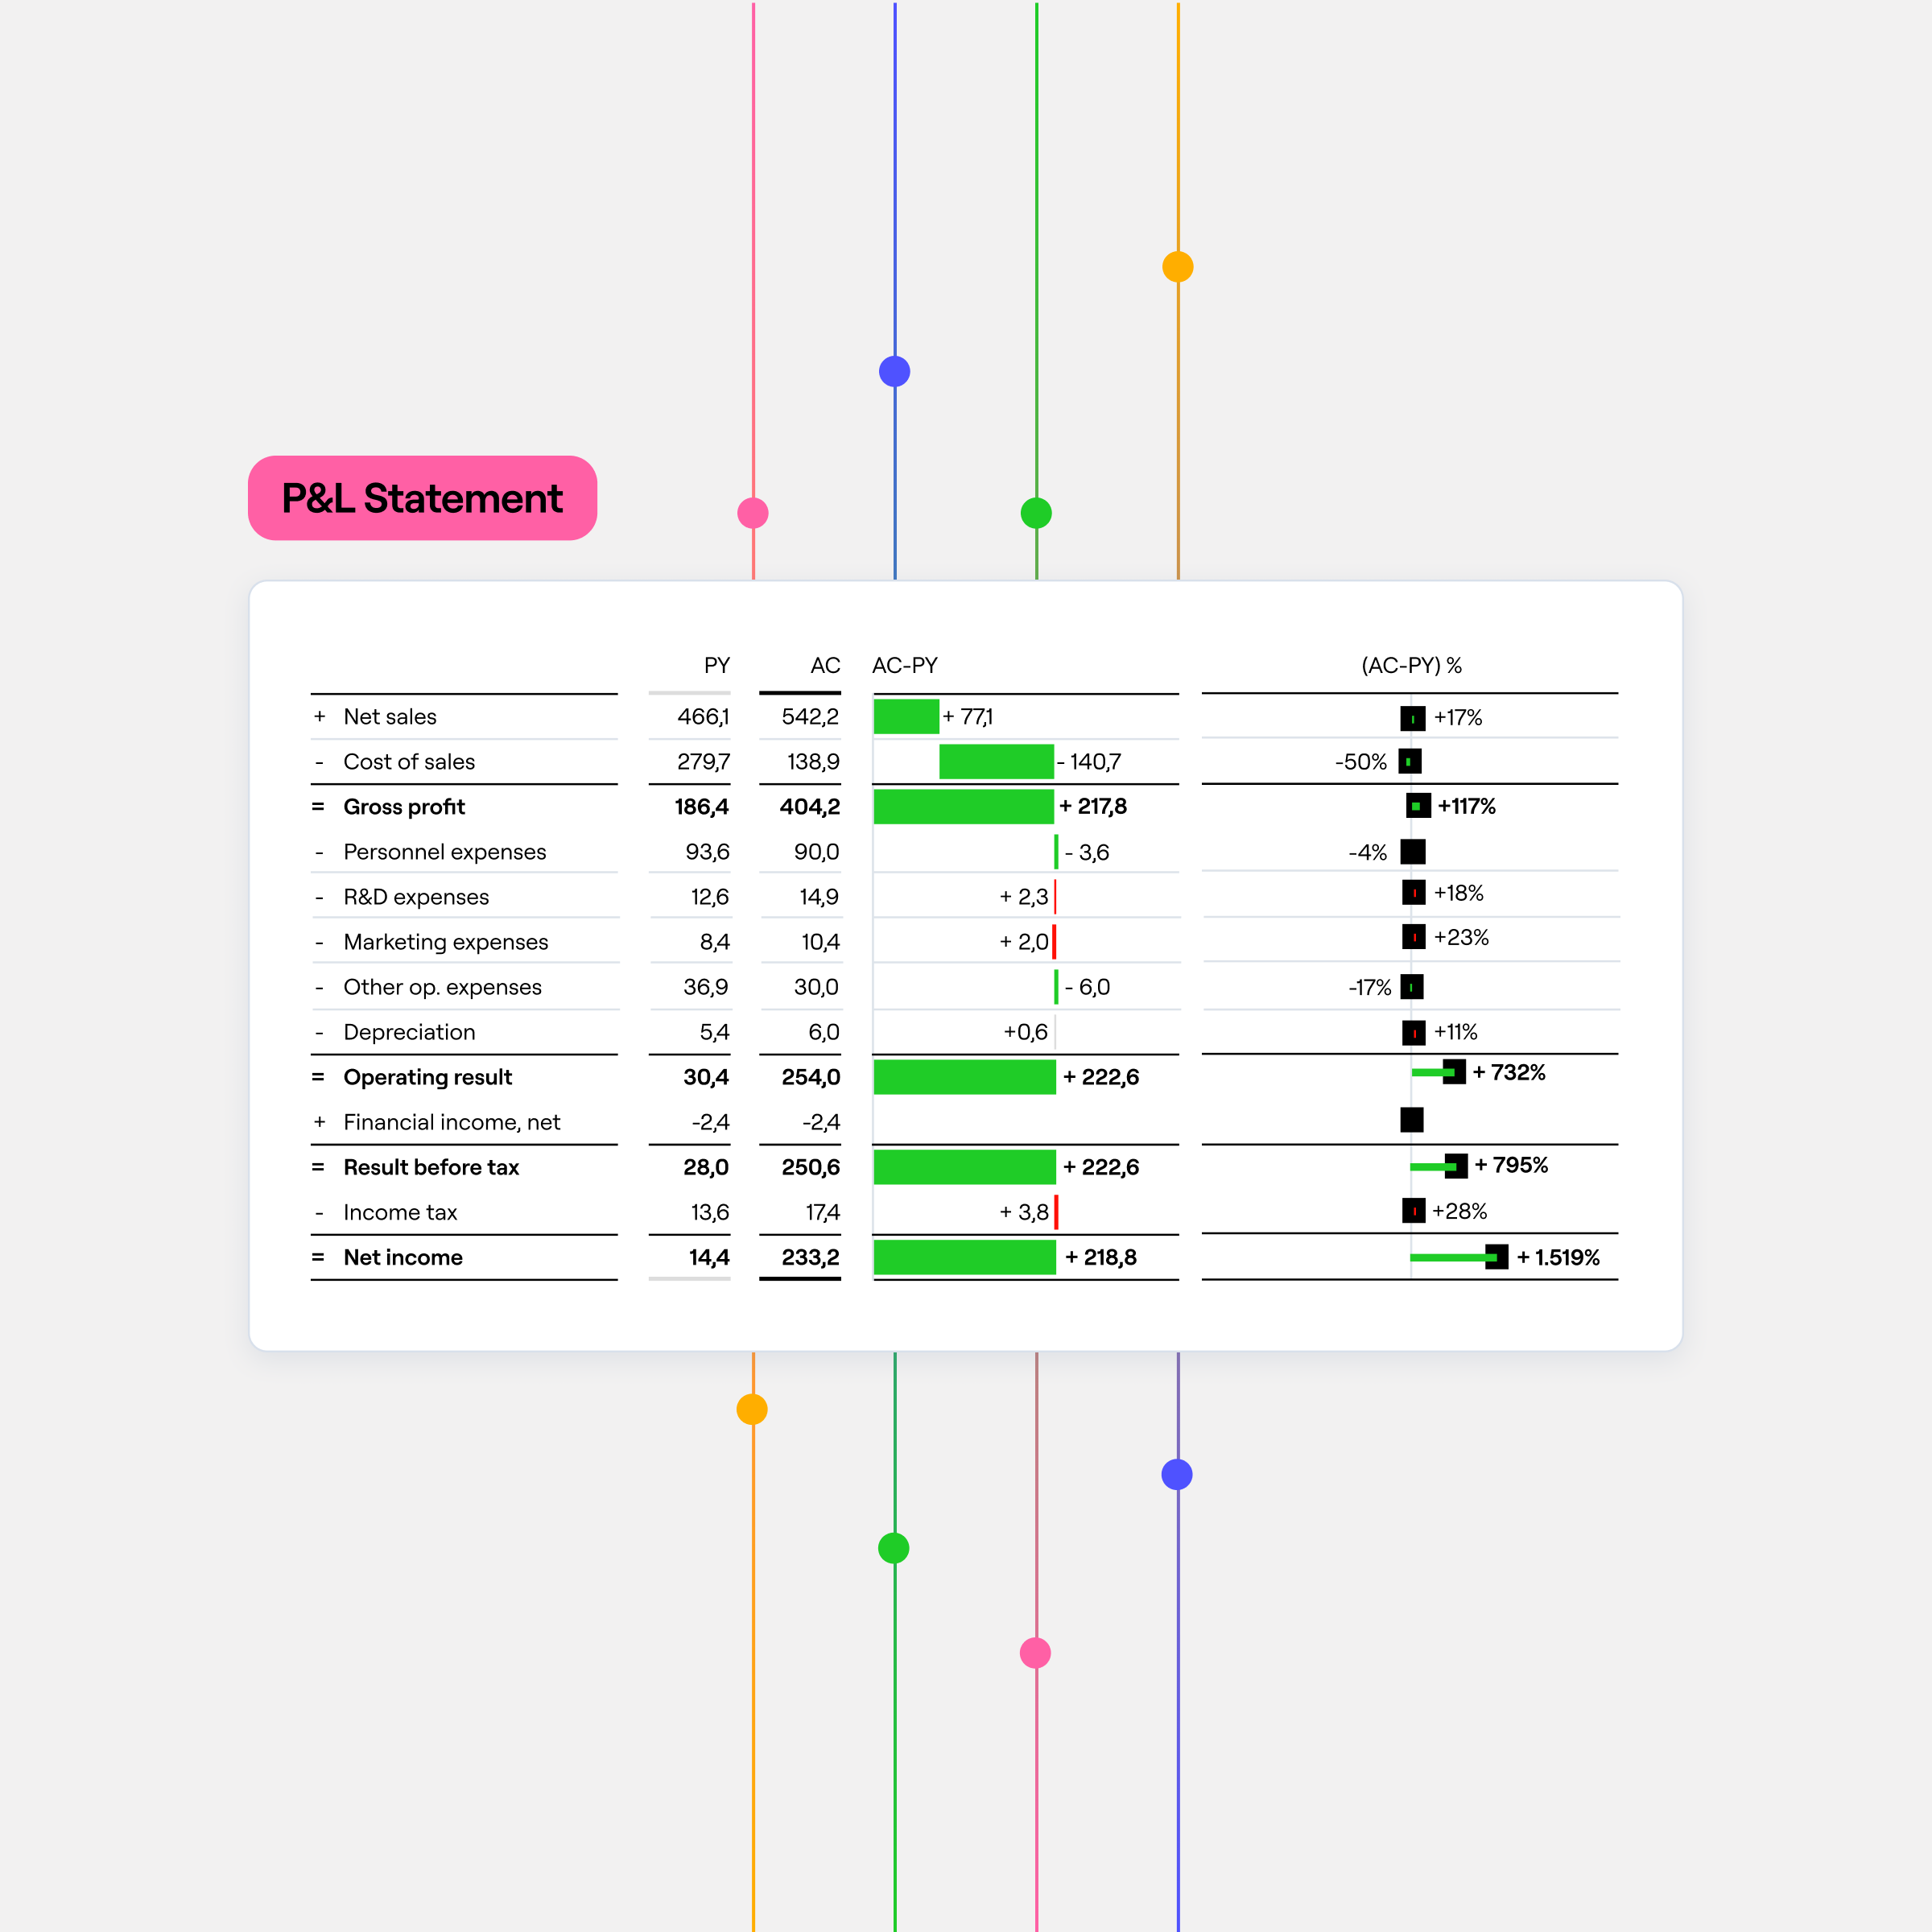
Farseer connects revenue and cost drivers for consistent profitability reporting.
See contribution margins, cost-to-serve, and ROI at any level of detail, from consolidated performance down to transactional drivers.
Create interactive dashboards and guided reports to explore profitability from every angle.
IBCS certified.
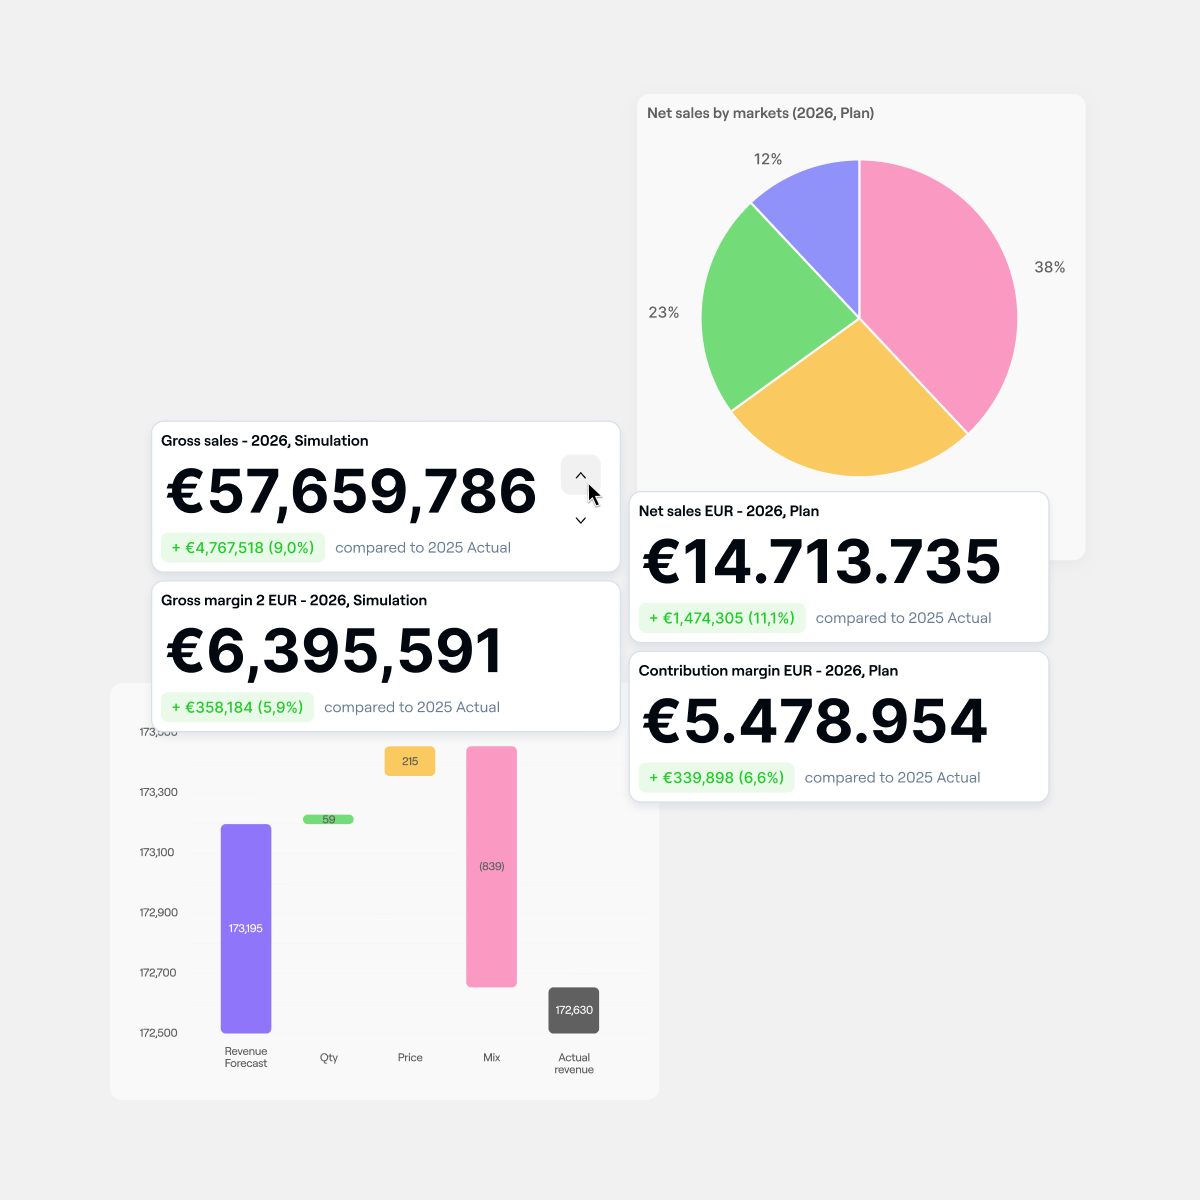
Farseer models pricing, cost, and mix changes and instantly recalculates margins.
Adjust assumptions, compare scenarios, and evaluate financial impact without rebuilding spreadsheets or breaking allocation logic.
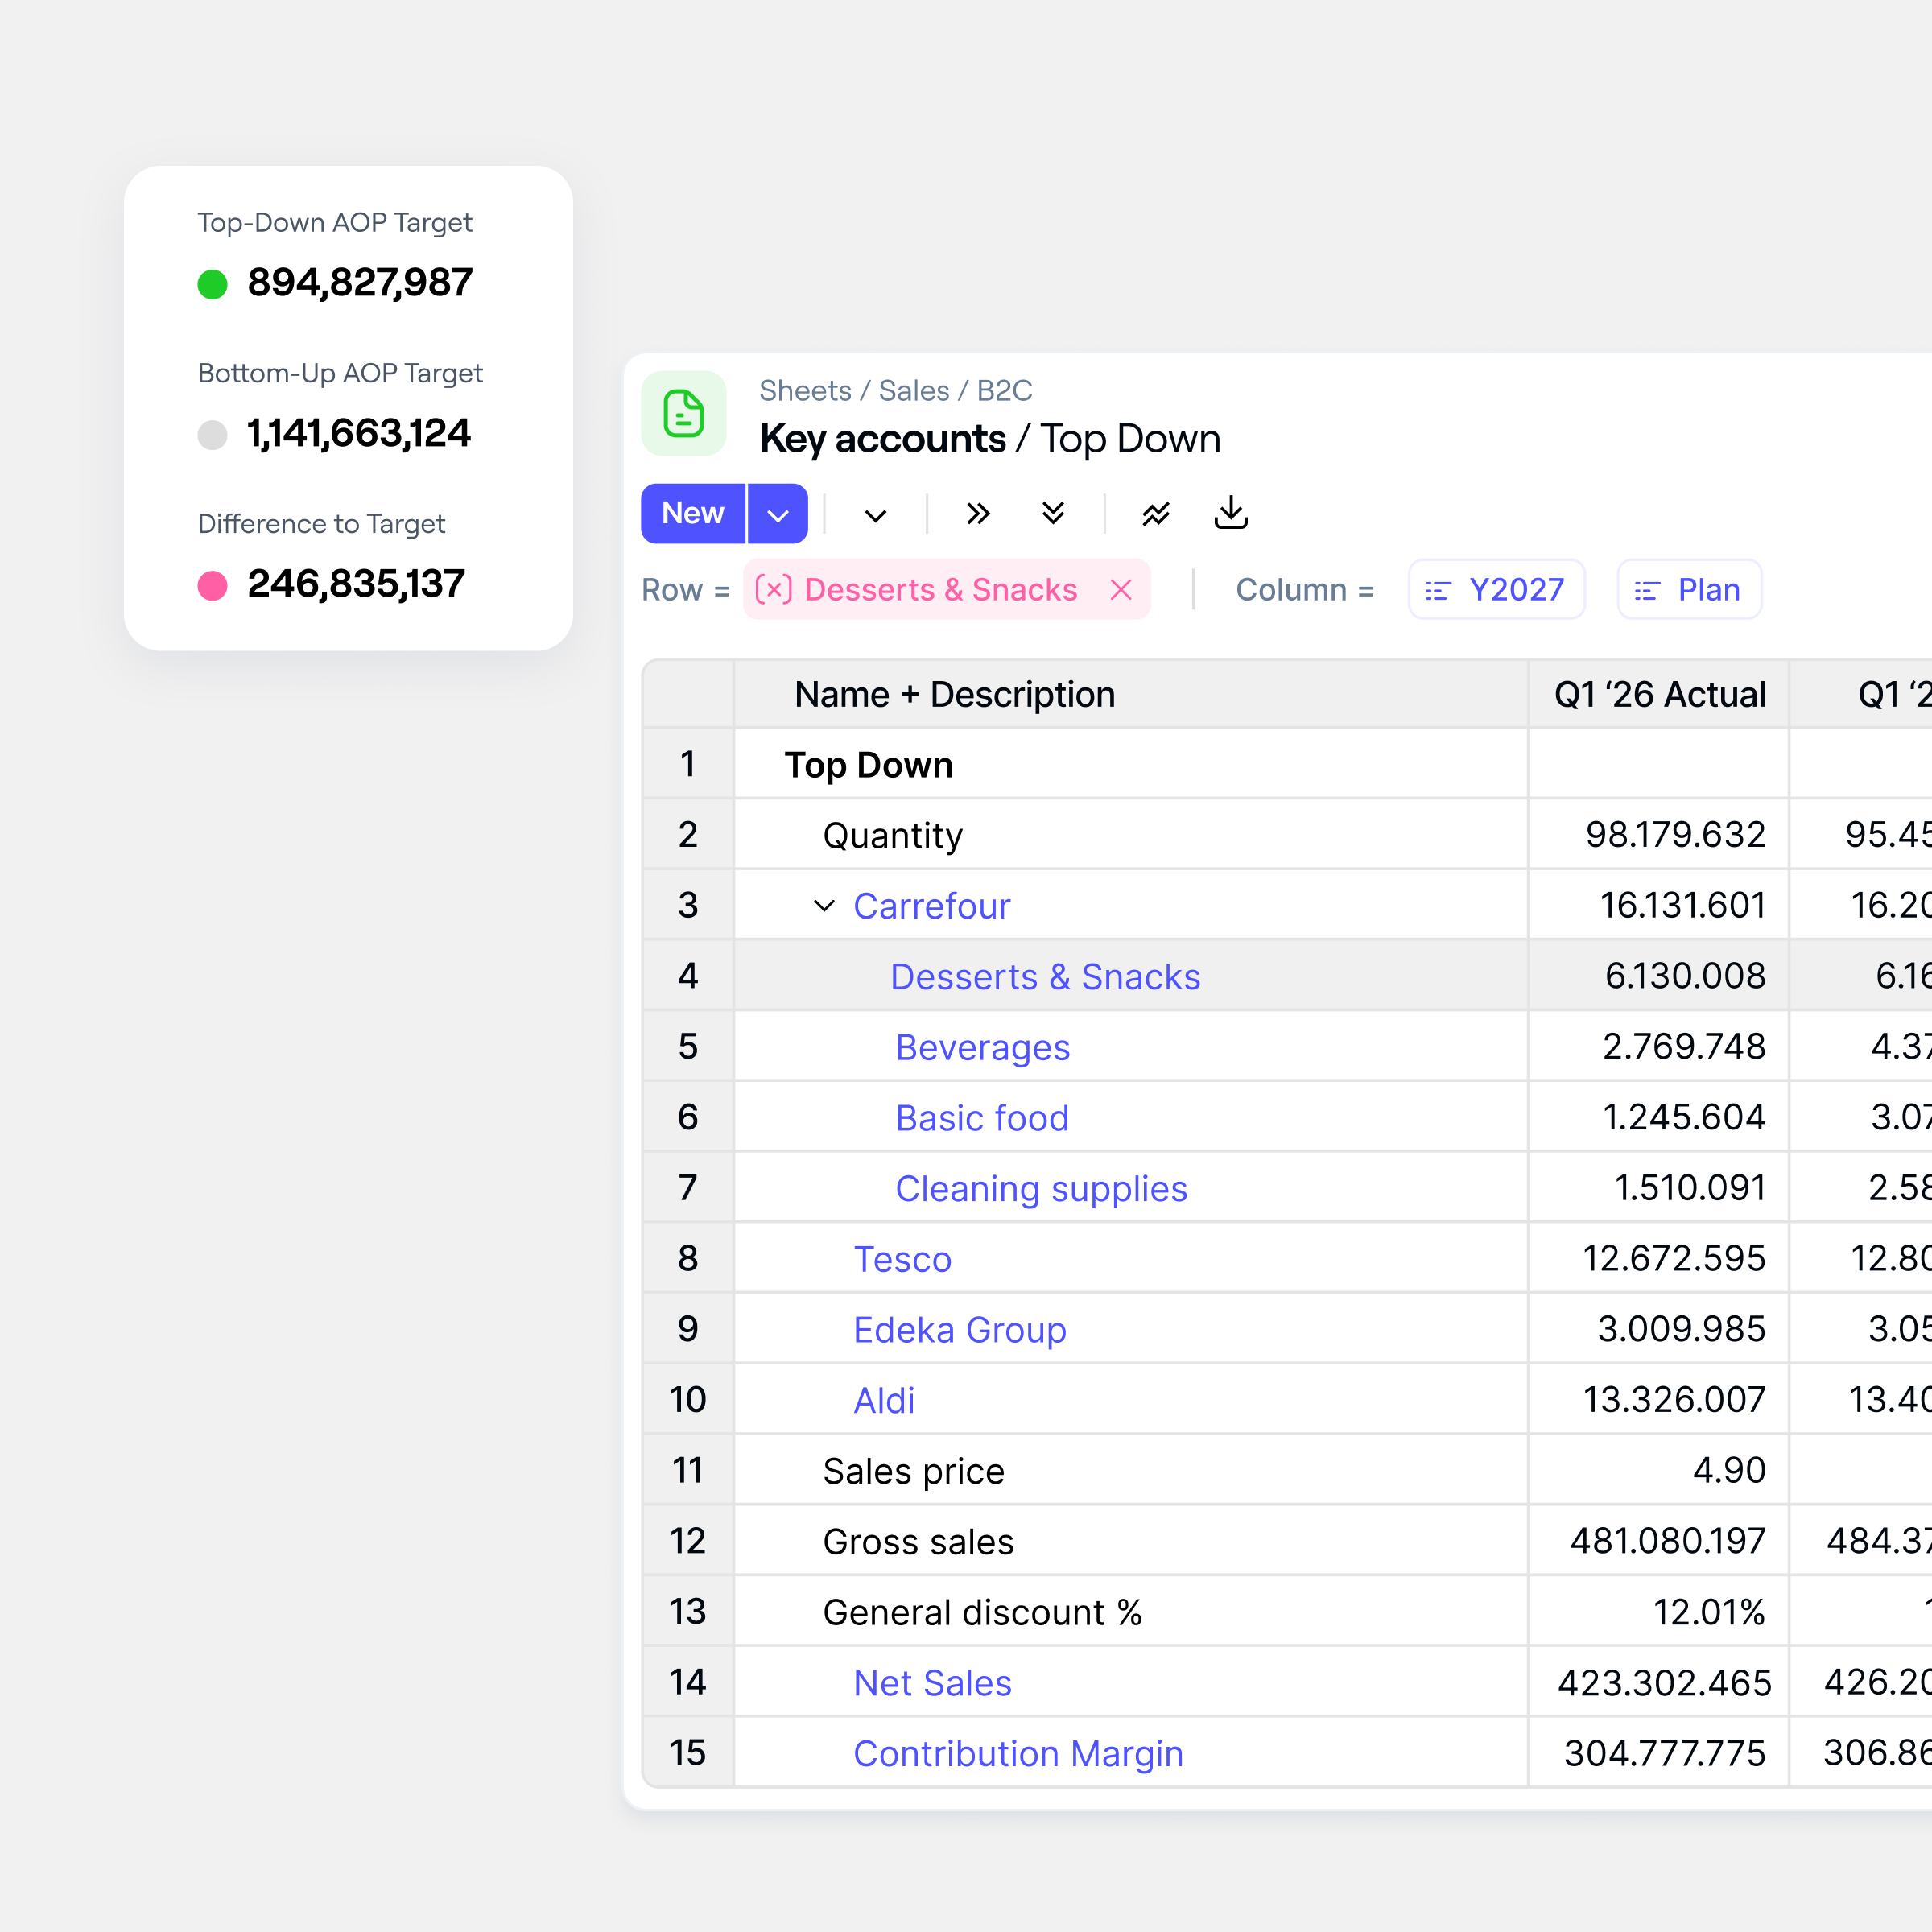
Farseer executes structured cost allocations you can fully trace.
Allocate shared services, overhead, and indirect costs using governed rules, without hidden spreadsheet logic.
30%
Faster reporting
"Real time dashboards gave our leadership instant visibility into critical metrics so we make informed decisions on the fly."

Weeks → hours
Planning consolidation
"The biggest benefit for me is speed, the whole market is in the palm of your hand."

1 click
Total auditability
"What matters most is the quality of the plans, they are precise, transparent, and flexible."

Connect your profitability analysis to the rest of your finance stack.
We review your data, processes and business goals to design the right setup.
We integrate your systems and structure your data in an isolated, ISO-certified environment.
Your team can budget, forecast and model scenarios in one connected platform.
Profitability analysis is the process of examining how revenue, costs, and margins break down across products, customers, channels, or business units. It helps finance teams identify where profit is generated and where it’s lost, so they can make informed decisions about pricing, resource allocation, and cost control.
Organizations can improve profitability analysis by transitioning from static spreadsheet reports to driver-based modeling, which connects revenue and cost drivers in one unified system for accurate, multi-dimensional margin tracking.
Cost-to-serve analysis measures the true cost of delivering a product or service to a specific customer, channel, or market. It includes direct costs plus allocated shared services, overhead, and indirect costs. Understanding cost-to-serve helps organizations identify unprofitable relationships and optimize resource allocation.
Farseer connects revenue and cost drivers in one unified model, giving you contribution margins, cost-to-serve, and ROI at any level of detail. Multi-step cost allocations are fully traceable with a complete audit trail, powered by the Rama in-memory engine for real-time recalculation across entities.
Yes. Farseer lets you test pricing, product mix, and cost assumption changes and instantly see how they affect margins. With driver-based modeling and multi-version scenario comparison, you can evaluate the financial impact of decisions before they hit your numbers — without rebuilding spreadsheets or breaking allocation logic.