Consistency
Your numbers live across ERPs, CRMs, BI tools, and spreadsheets.
Teams build dashboards from different data extracts, creating conflicting views of performance.
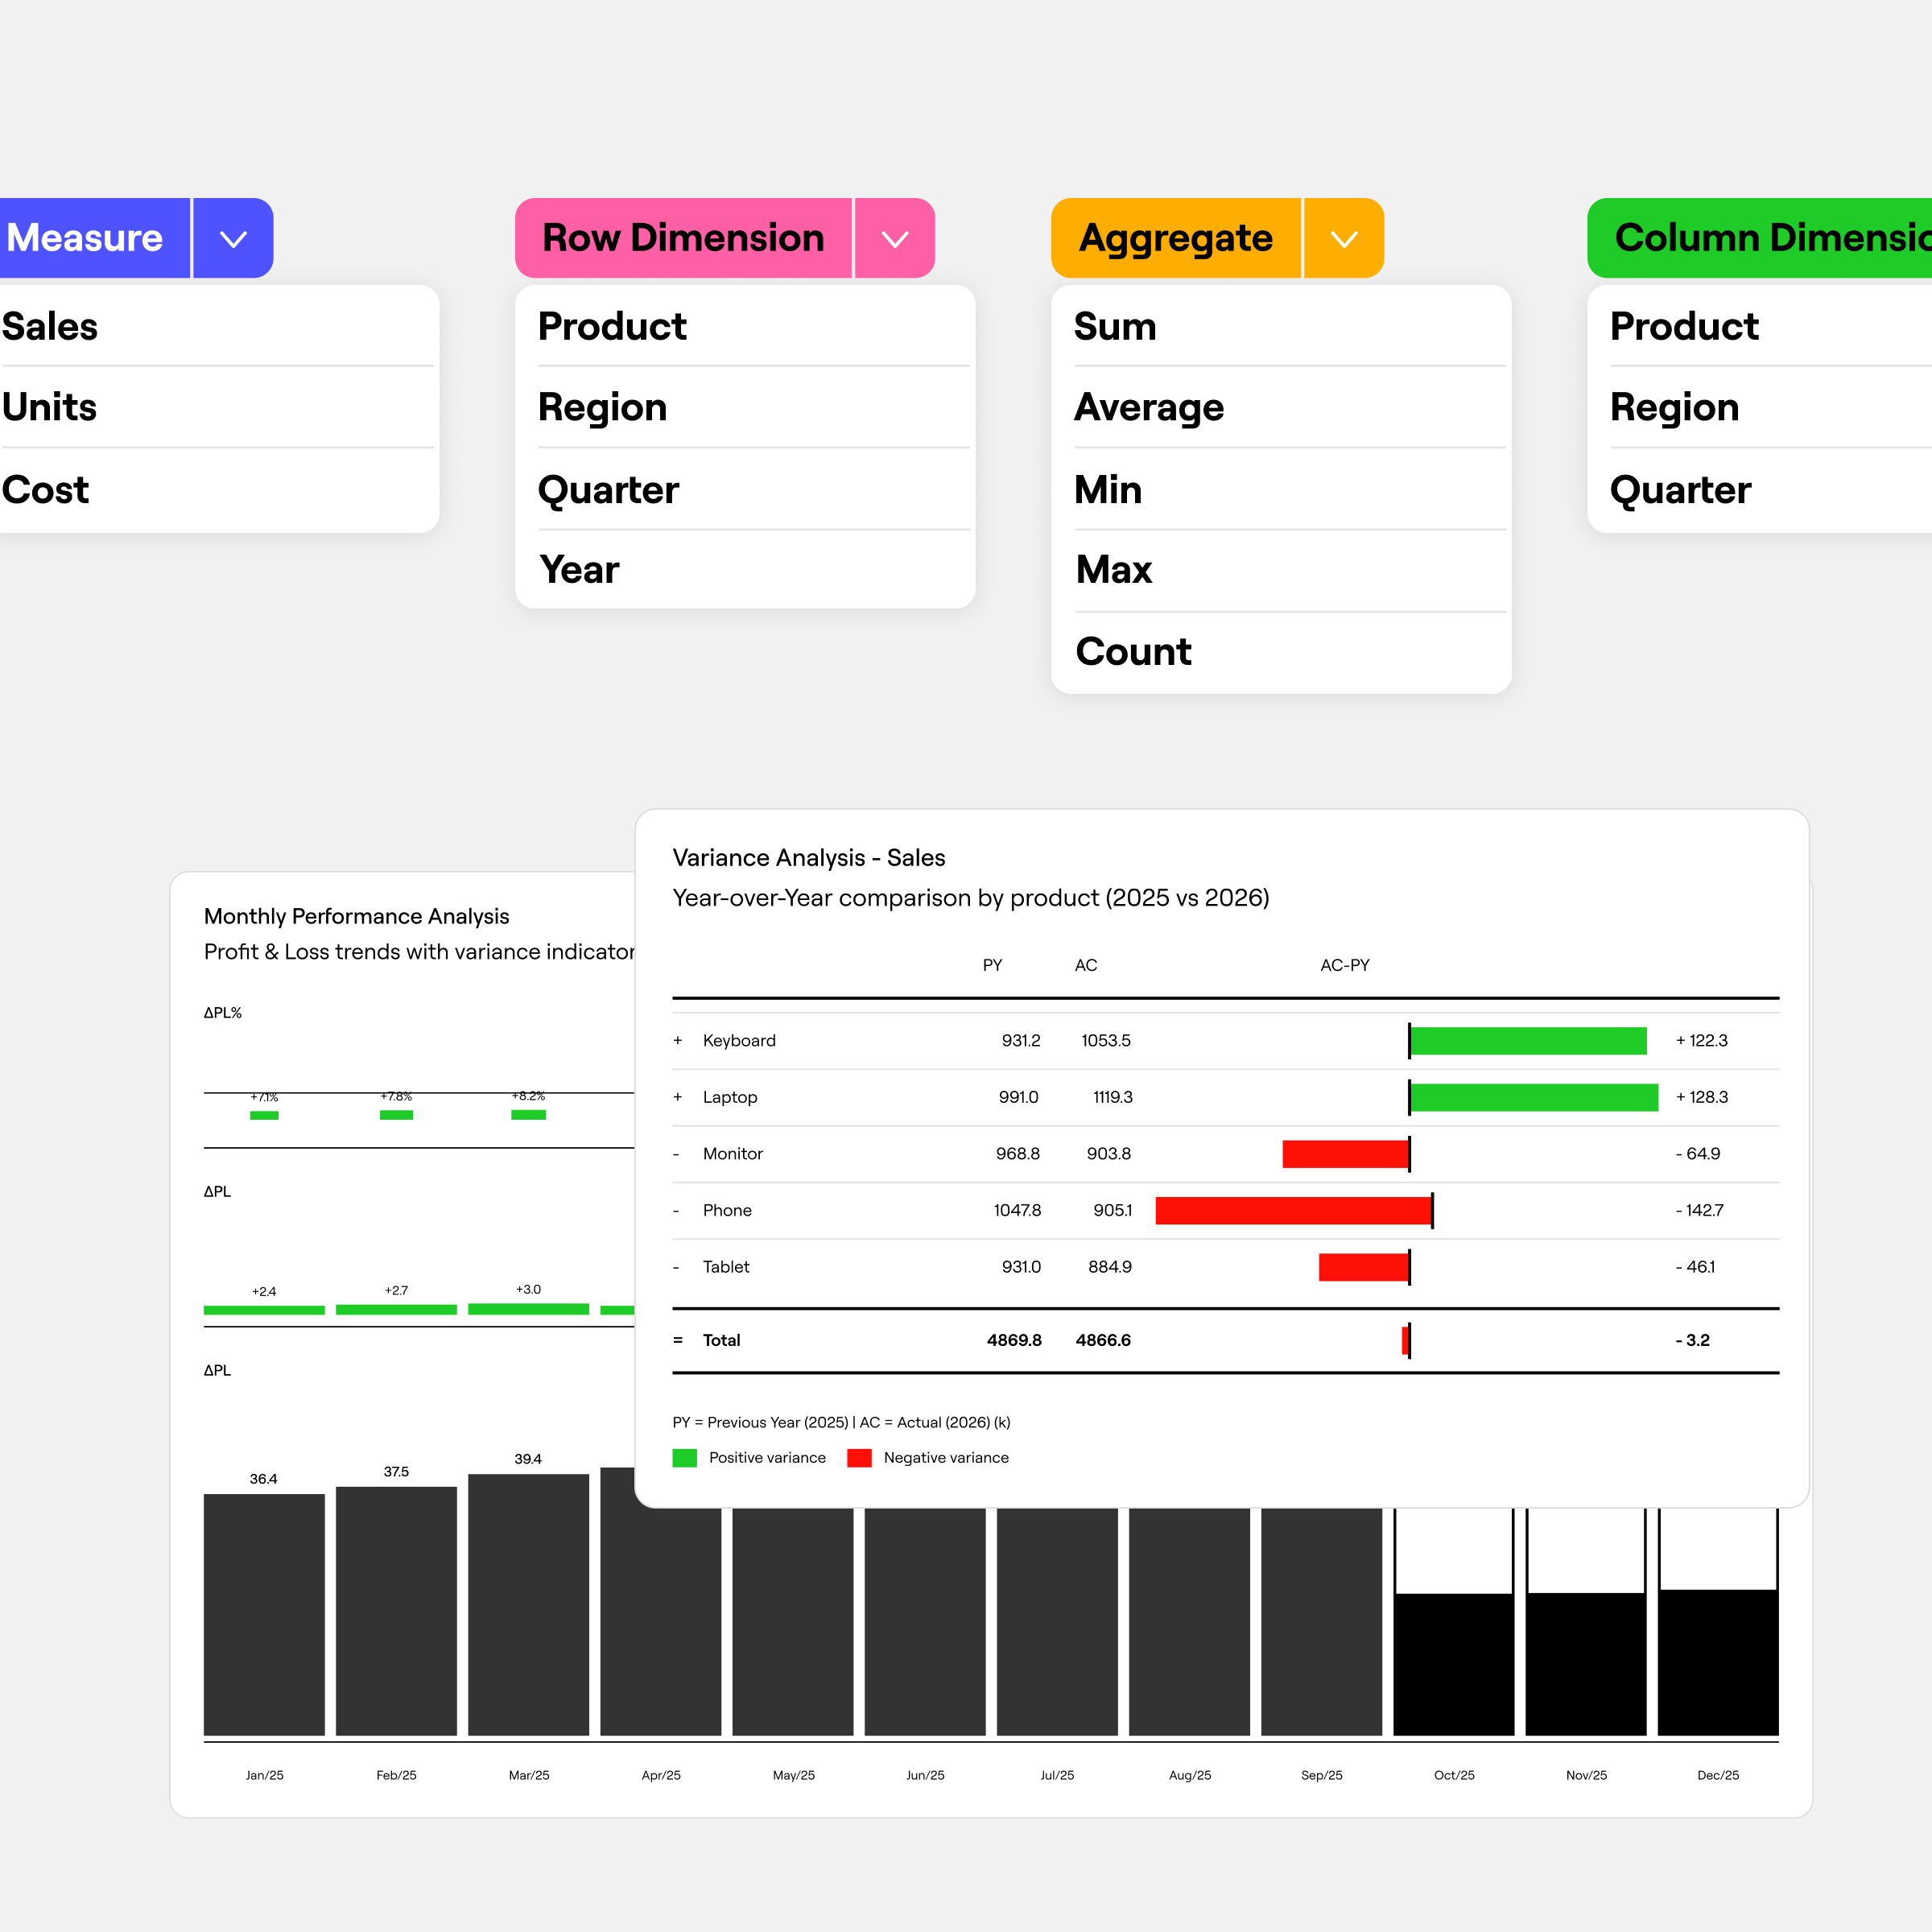
Dashboards bring your financial model to life through interactive, real-time visualizations.
Explore performance in real time, drill into variances, and analyze scenarios without building reports manually.
IBCS certified.
Trusted by enterprise finance teams


Connect live data across systems
Sync ERP, CRM, HR, and other source data into dashboards that stay current as numbers change.
Analyze performance from every angle
Slice results by entity, region, product, or department and drill into the drivers behind every KPI.
Track variances in real time
Compare actuals, budget, forecast, and scenarios in live dashboards.

“Whenever I want to look at the financial plan or any version, I can do it myself — instantly.”
Your numbers live across ERPs, CRMs, BI tools, and spreadsheets.
Teams build dashboards from different data extracts, creating conflicting views of performance.
Reports depend on manual exports and spreadsheet updates.
By the time dashboards are refreshed, the moment to act has already passed.
Revenue, margin, and cost KPIs are calculated differently across reports.
Teams spend more time debating numbers than understanding what changed.
Dashboards connect your financial data so you can see performance as it happens
Farseer dashboards don’t stop at summary views.
Click any value in a report or table to expand the underlying structure and instantly see what drives the result.
Drill from consolidated performance down to entities, accounts, products, or cost centers without leaving the dashboard. Every figure stays connected to the financial model behind it.
Click any value to expand the data behind it instantly.
Analyze results by entity, product, region, or custom dimensions.
All tables stay linked to the underlying financial model and calculations.

“Farseer gave us the clarity to understand what really drives our financial performance.”
Farseer dashboards let you filter and explore KPIs dynamically, helping you focus on the metrics that matter most in the moment.
Apply filters across entities, products, regions, departments, or time periods and instantly refine the view without rebuilding reports.
Every slice updates in real time, giving you a clearer understanding of what’s driving performance.
Quickly filter dashboards by entity, product, region, or custom dimensions.
Adjust filters and see results update immediately.
Explore performance across multiple business views in one dashboard.

“Farseer frees us from the grind of manual tasks, letting us focus on deeper, more impactful analyses.”
Farseer dashboards update automatically as soon as underlying numbers change in the model.
When new actuals arrive, assumptions shift, or forecasts update, dashboards reflect the changes instantly.
There’s no need to refresh reports, rebuild exports, or wait for the next reporting cycle.
Changes in the model appear in dashboards instantly.
New ERP or system data flows directly into dashboards.
Dashboards always reflect the latest financial calculations.
“With Farseer, we’re seeing results we can act on — with real-time insights at our fingertips.”
Talk to our solutions experts so they can build a customized demo for your organization.
Book a call"Farseer has been transformative for how we operate."
We review your data, processes and business goals to design the right setup.
We integrate your systems and structure your data in an isolated, ISO-certified environment.
Your team can budget, forecast and model scenarios in one connected platform.

“We saved significant time and shifted our focus from data preparation to analysis and decision-making.”
Talk to our solutions experts so they can build a customized demo for your organization.
Book a callFarseer provides interactive, real-time dashboards connected directly to your financial model. Users can explore KPIs, drill into variances, compare actuals against budget and forecast, and slice results by entity, region, product, or department — all without manually building or refreshing reports.
Farseer dashboards update automatically whenever underlying model data changes. When new actuals arrive, forecasts shift, or assumptions are revised, every connected dashboard reflects the changes instantly — eliminating manual exports, scheduled refreshes, and the reporting lag that causes teams to act on outdated information.
Yes. Every value in a Farseer dashboard is connected to the underlying financial model. Clicking any figure expands the data behind it, allowing users to drill from consolidated performance down to entity, account, product, or cost center level — without leaving the dashboard or rebuilding any reports.
All Farseer dashboards draw from a single financial model, meaning revenue, margin, and cost metrics are calculated using the same logic everywhere. This eliminates the conflicting KPI definitions that arise when teams build dashboards from separate data extracts, spreadsheets, or disconnected BI tools.
Farseer allows users to apply filters across entities, products, regions, departments, and time periods directly within a dashboard. Results update instantly as filters change, enabling multi-dimensional performance analysis without rebuilding reports — giving finance and business teams immediate clarity on what is driving results.