Data silos
ERP, BI, and spreadsheets operate separately.
Every department builds its own view of performance. Reconciliation replaces analysis.
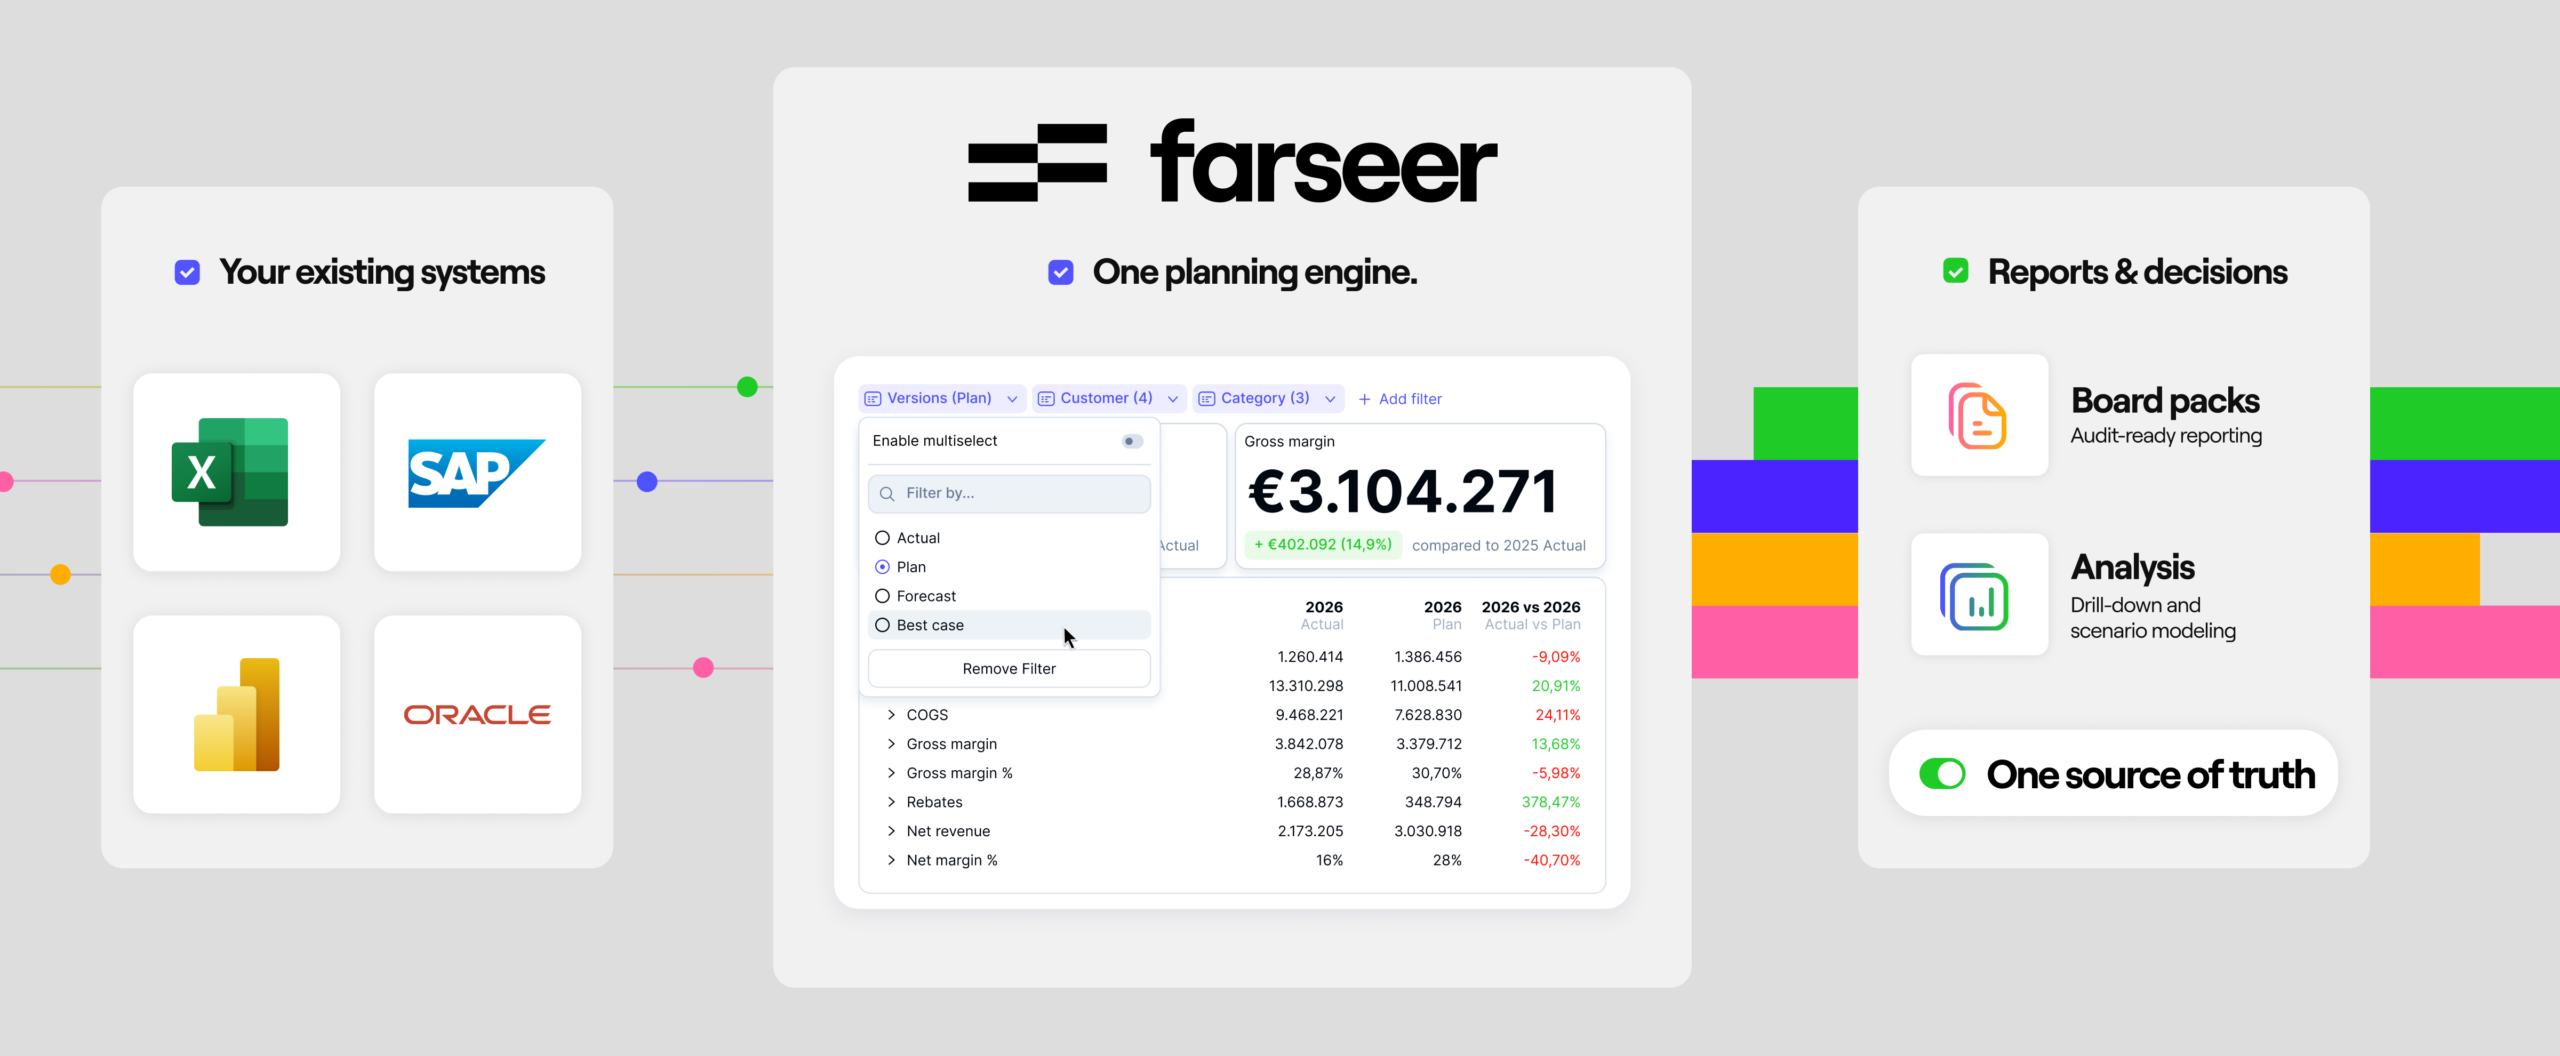
Farseer eliminates fragmented Excel spreadsheets and siloed BI tools.
Build interactive dashboards, drill into detail, and generate board-ready reports, all from a single source of truth, updated in real time.
IBCS certified.
Trusted by enterprise finance teams
ERP, BI, and spreadsheets operate separately.
Every department builds its own view of performance. Reconciliation replaces analysis.
Logic and calculations are rebuilt across tools.
KPIs are calculated differently across dashboards. The same metric tells different stories.
Numbers must be validated before they’re used.
Reporting relies on exports, manual fixes, and key individuals. “Real-time” still requires intervention.
Close the gap between your source systems and your final board pack. Replace the chaotic Excel middle-layer with a single, governed planning engine.
Faster reporting cycles
Standardized formats and automated consolidation cut reporting time. Finance teams delivers insights faster, with no manual exports.
Allocation processing time
From hours of manual allocation runs to under five minutes. The same logic, the same numbers, executed at the speed your reporting layer demands.
Live dashboards
Dashboards recalculate the moment your data changes which means no exports, no scheduled refreshes, no reconciliation layers.
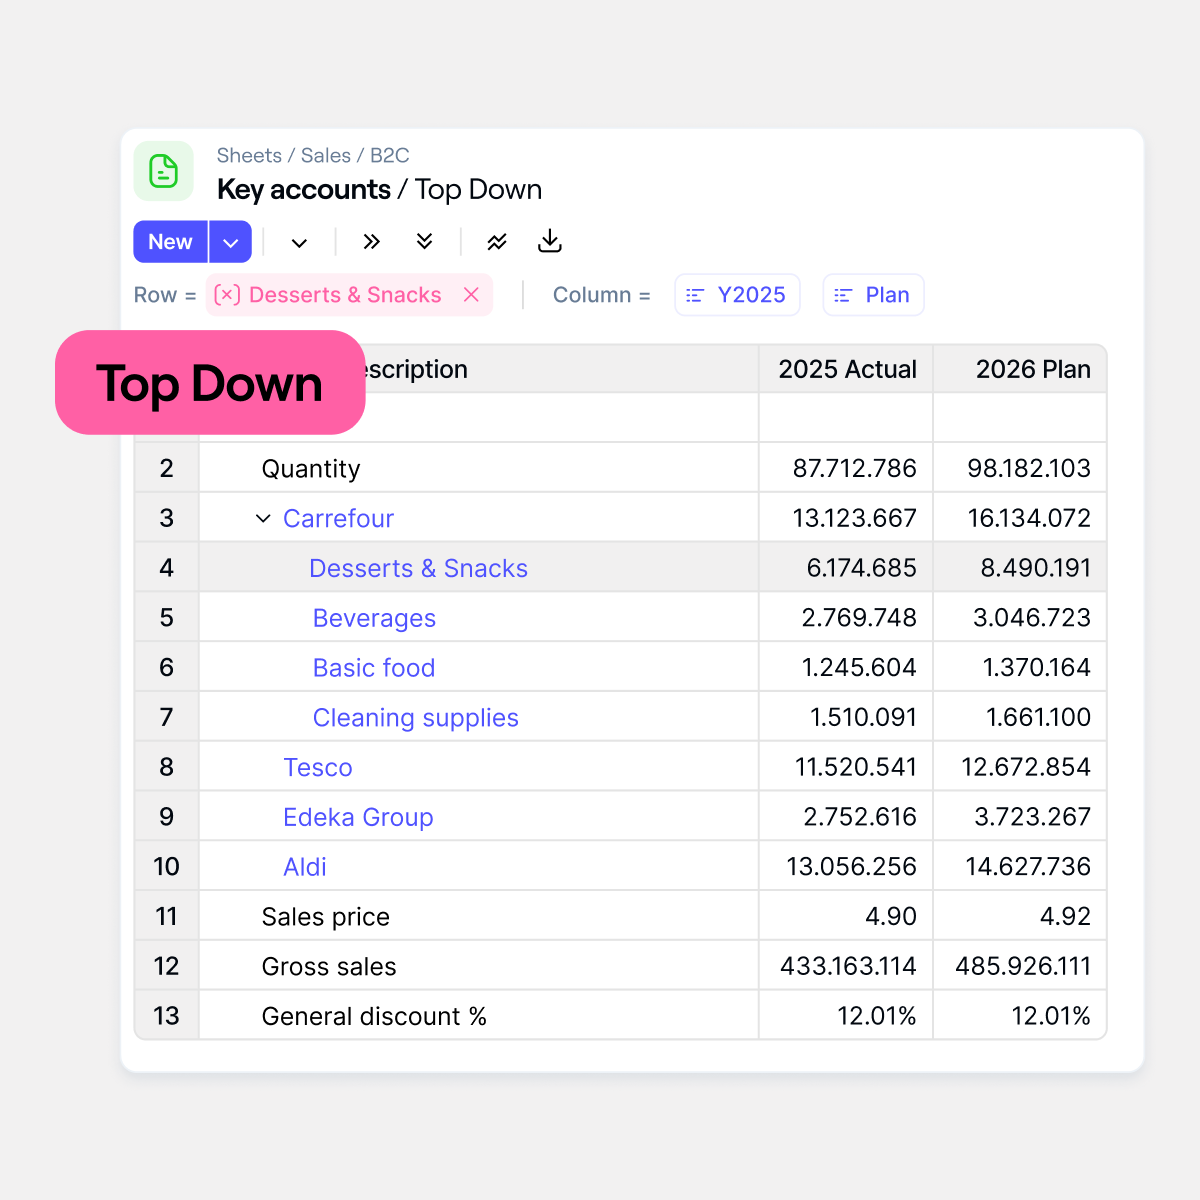
Farseer powers interactive dashboards directly from your financial model.
Every number updates instantly as data changes, no exports, no refresh cycles, no reconciliation layers.
Change a filter, adjust a driver, or drill into detail and the entire view recalculates in real time.
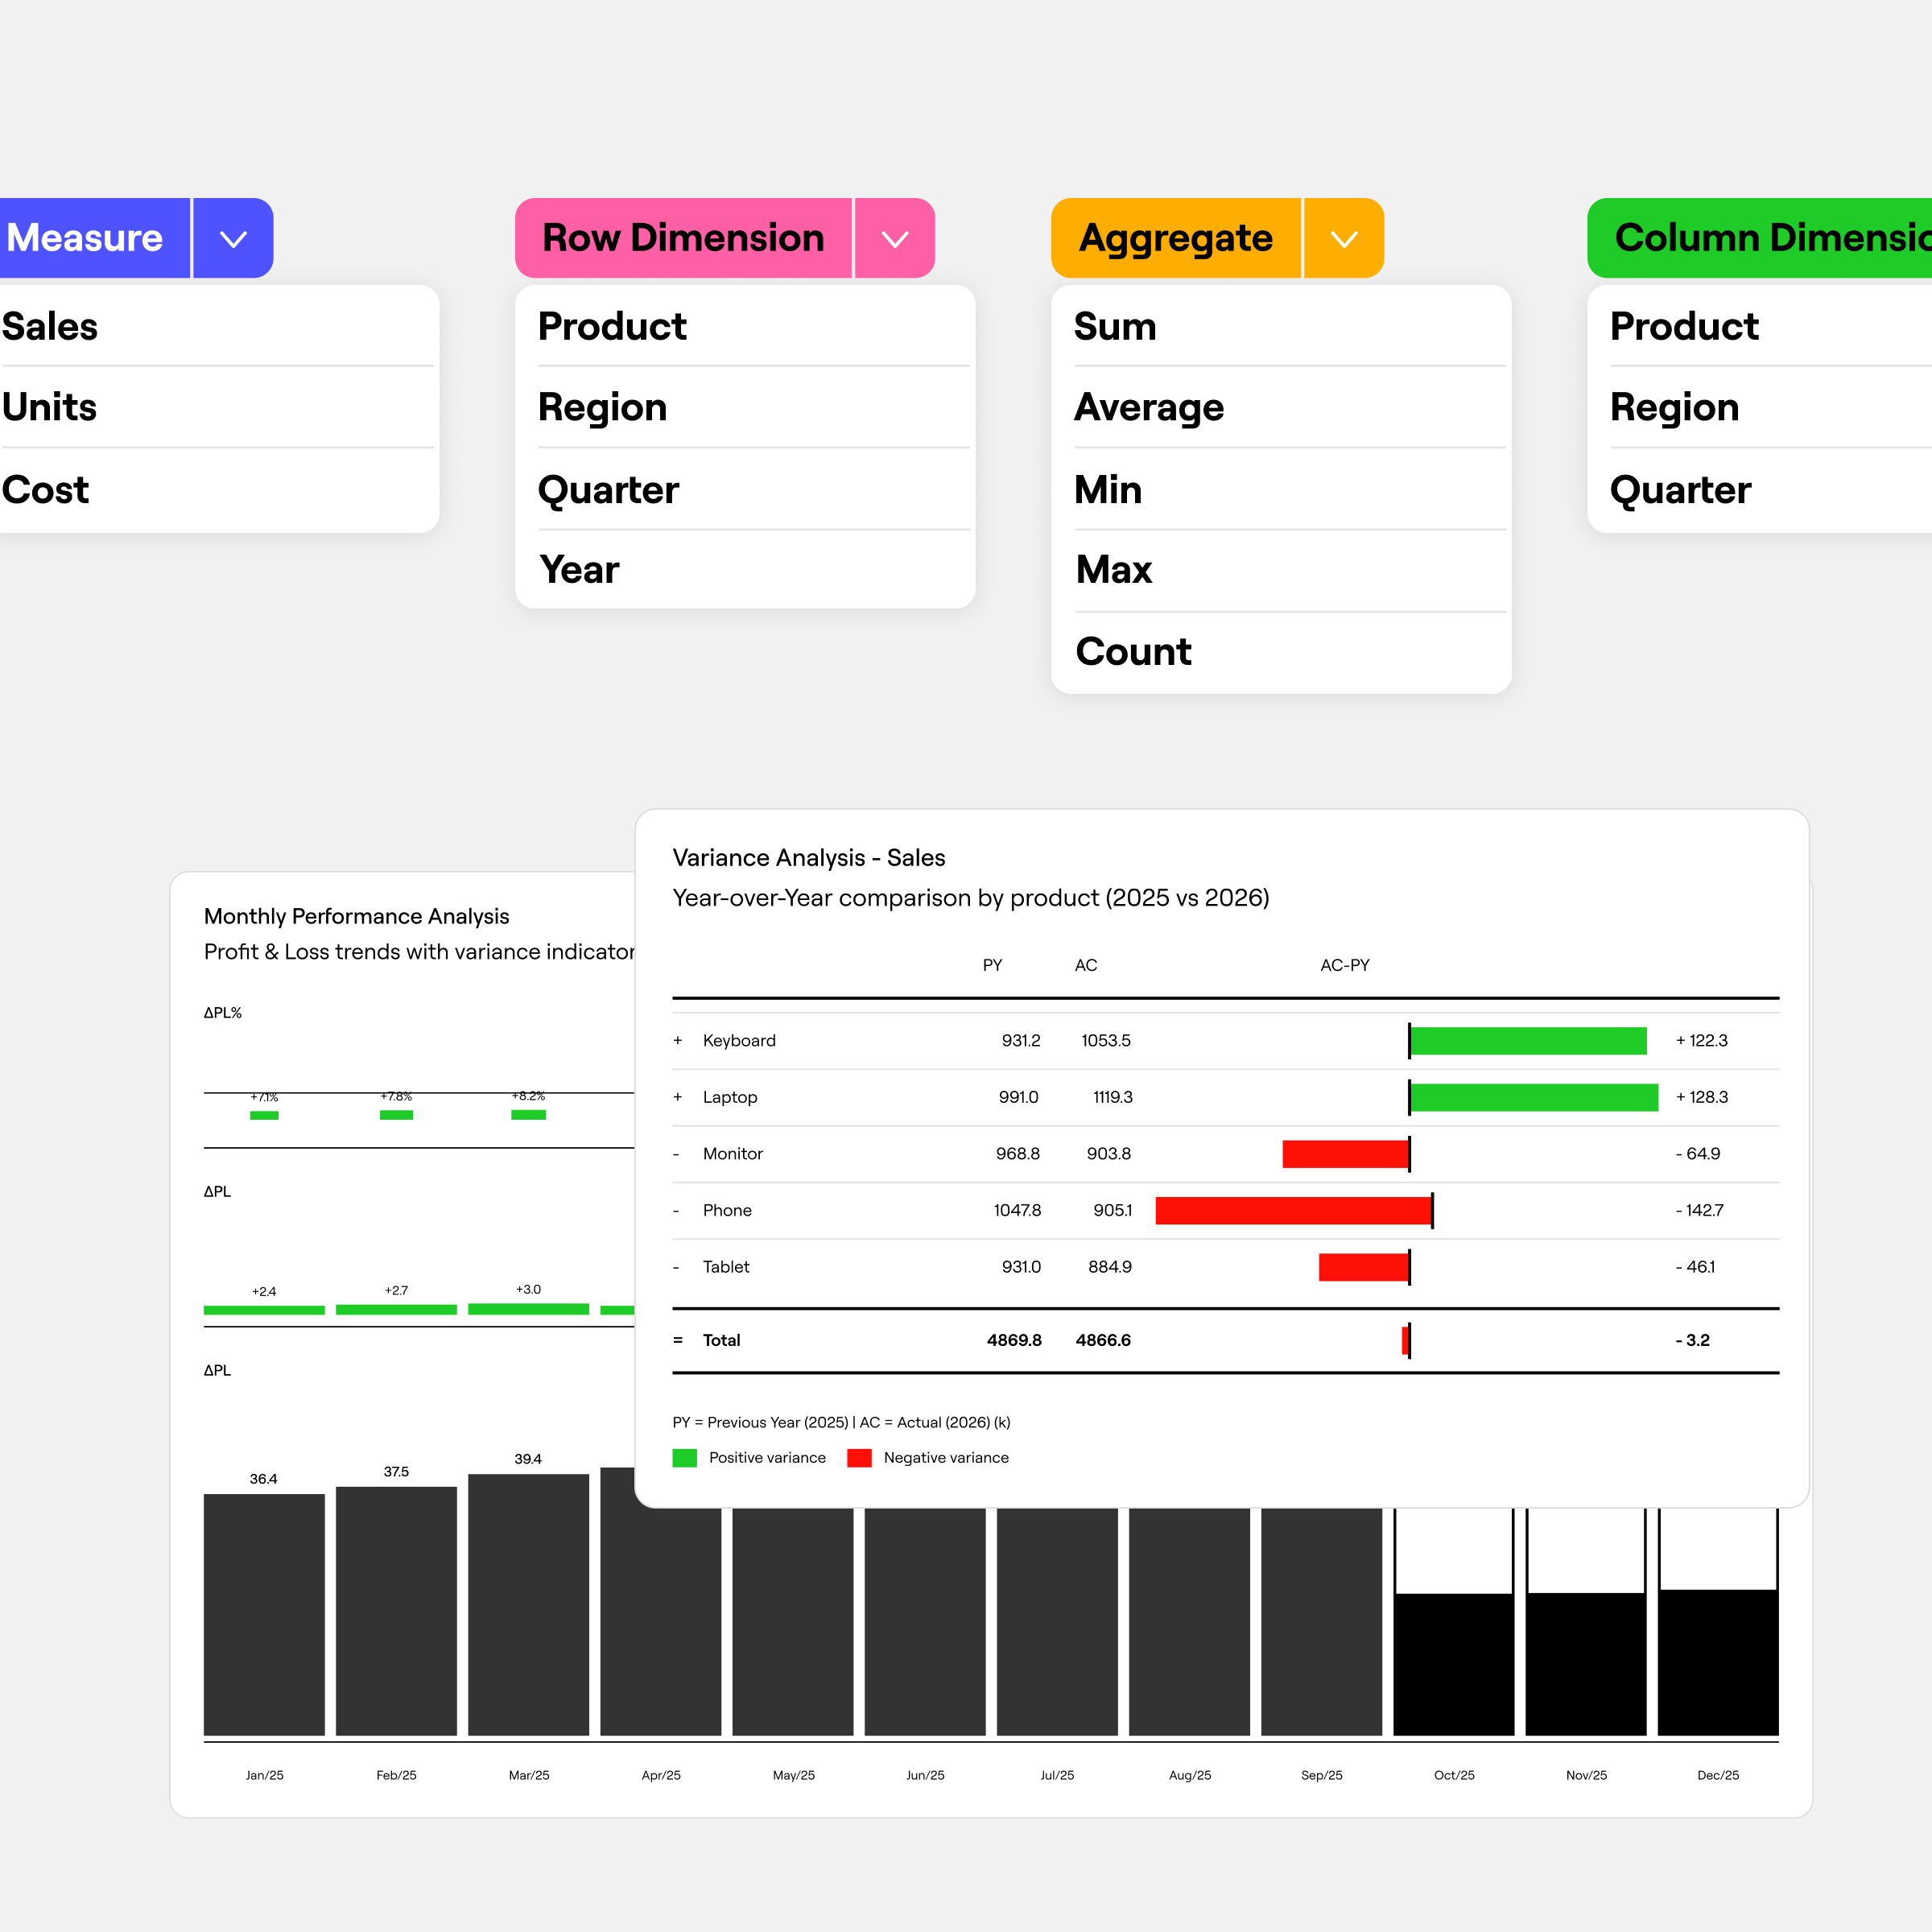
Farseer embeds variance analysis directly into your reporting layer.
Compare actuals, budget, forecast, and scenarios without exporting data or rebuilding reports.
Instantly isolate drivers behind performance shifts.
Farseer connects dashboards, ad-hoc analysis, and production reporting in one governed environment.
One controlled model drives all dashboards and reports.
KPIs remain consistent across every view, from high-level summaries to detailed drill-downs.
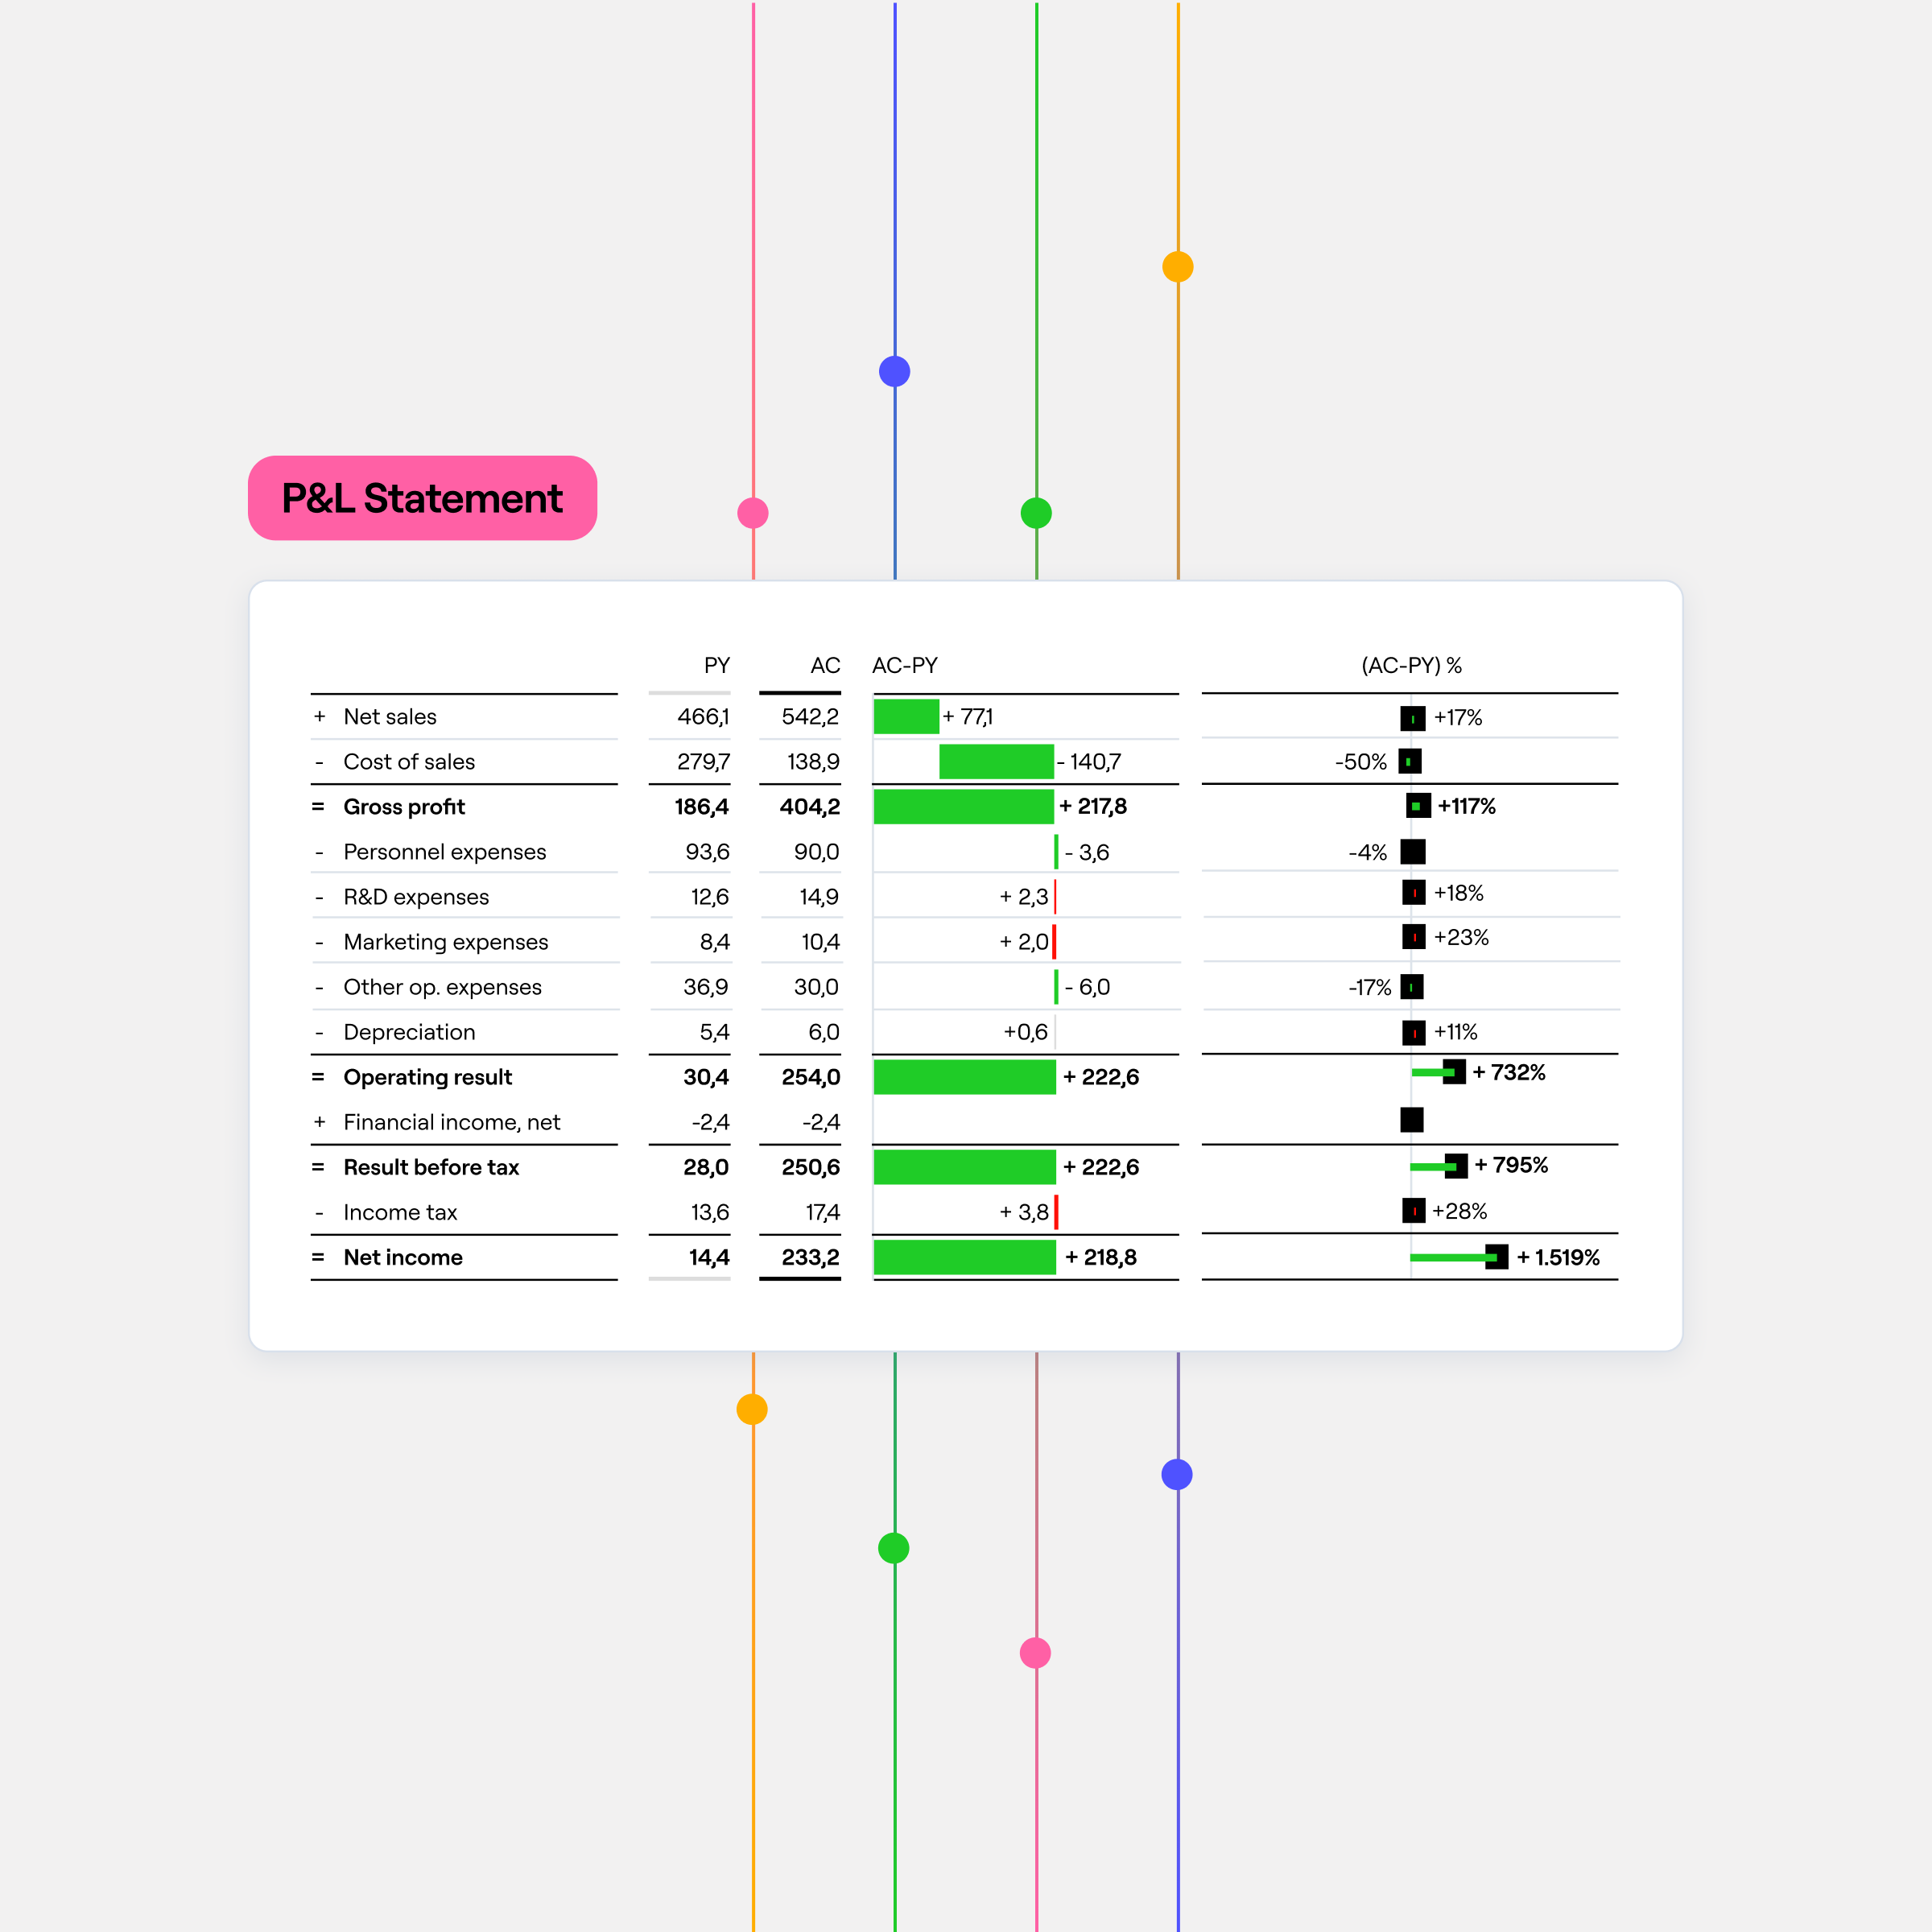
Farseer is among the first FP&A platforms certified to the International Business Communication Standards (IBCS), the framework behind the upcoming ISO 24896 standard for business reporting notation.
Every chart follows a consistent visual language. Actuals, budget, and forecast are distinguishable instantly. Scaling is uniform across views, so the visual difference between two bars matches the actual variance.
Less cognitive load. Faster reading. Better decisions, the same way across every team.
25%
Shorter planning cycles
"Real-time dashboards gave our leadership instant visibility into critical metrics so we make informed decisions on the fly."

10d → 2d
Forecasting cycle
"We can create dashboards quickly and adapt them to whatever analysis we need."

100%
Statement accuracy
"Reports are automatically generated, ensuring consistency and freeing the team for deeper analysis."

One connected engine. Endless planning capabilities.
We review your data, processes and business goals to design the right setup.
We integrate your systems and structure your data in an isolated, ISO-certified environment.
Your team can budget, forecast and model scenarios in one connected platform.
The main difference is that real-time financial reporting, as in Farseer, updates dashboards instantly as underlying data changes, whereas traditional BI relies on static, scheduled exports that reflect past performance.
Farseer connects ERP, planning, and operational data sources into a single unified model. All dashboards and reports draw from the same financial logic, so P&L, balance sheet, cash flow, and KPIs always reconcile, removing the need for manual exports, version management, or cross-tool validation.
Farseer supports interactive dashboards, structured variance analysis, and board-ready reports — all driven by a single financial model. Users can drill from high-level KPIs down to entity, account, or transaction level. Dashboards share the same logic as P&L, balance sheet, and cash flow statements.
Farseer embeds variance analysis directly into the reporting layer. Finance teams can compare actuals against budget, forecast, and prior periods, slice results by product, region, cost center, or entity, and trace performance directly to operational drivers — without exporting data or rebuilding reports in separate tools.
All reports and dashboards in Farseer inherit their structure and logic from a single financial model. KPIs are defined once and reused across every reporting layer. Role-based access controls and full audit trails ensure Finance retains governance while business users can explore data independently.