What is Ratio Analysis And How To Make the Most of It

You can’t just look at the numbers and know the full story of a company’s financial health.
For example, two companies can make $100 million in revenue, but that doesn’t mean they’re equally successful. One might be super successful, while the other is barely making ends meet. Maybe one is drowning in debt, while the other has a really strong cash flow. Or one manages its costs well and makes a good profit, while the other wastes money and struggles to stay profitable.
This is where ratio analysis makes all the difference – it goes beyond revenue to reveal the real story behind a company’s financial health.
Read: A Complete Guide to Financial Statement Analysis for Strategy Makers
In this blog we’ll explain how ratio analysis works, break down key financial ratios, explain how they’re used, and highlight common mistakes to avoid. Let’s get started.
How Ratio Analysis Works
As mentioned, ratio analysis works by comparing different financial metrics to assess a company’s performance, efficiency, and financial health.

Here’s how it works step by step:
1. First you need to gather financial data.
- Ratios are calculated using numbers from a company’s income statement, balance sheet, and cash flow statement.
- Tip: To calculate the current ratio, you need current assets and current liabilities from the balance sheet.
2. The next step is to calculate key ratios.
- Liquidity ratios
- Profitability ratios
- Efficiency ratios
- Leverage ratios
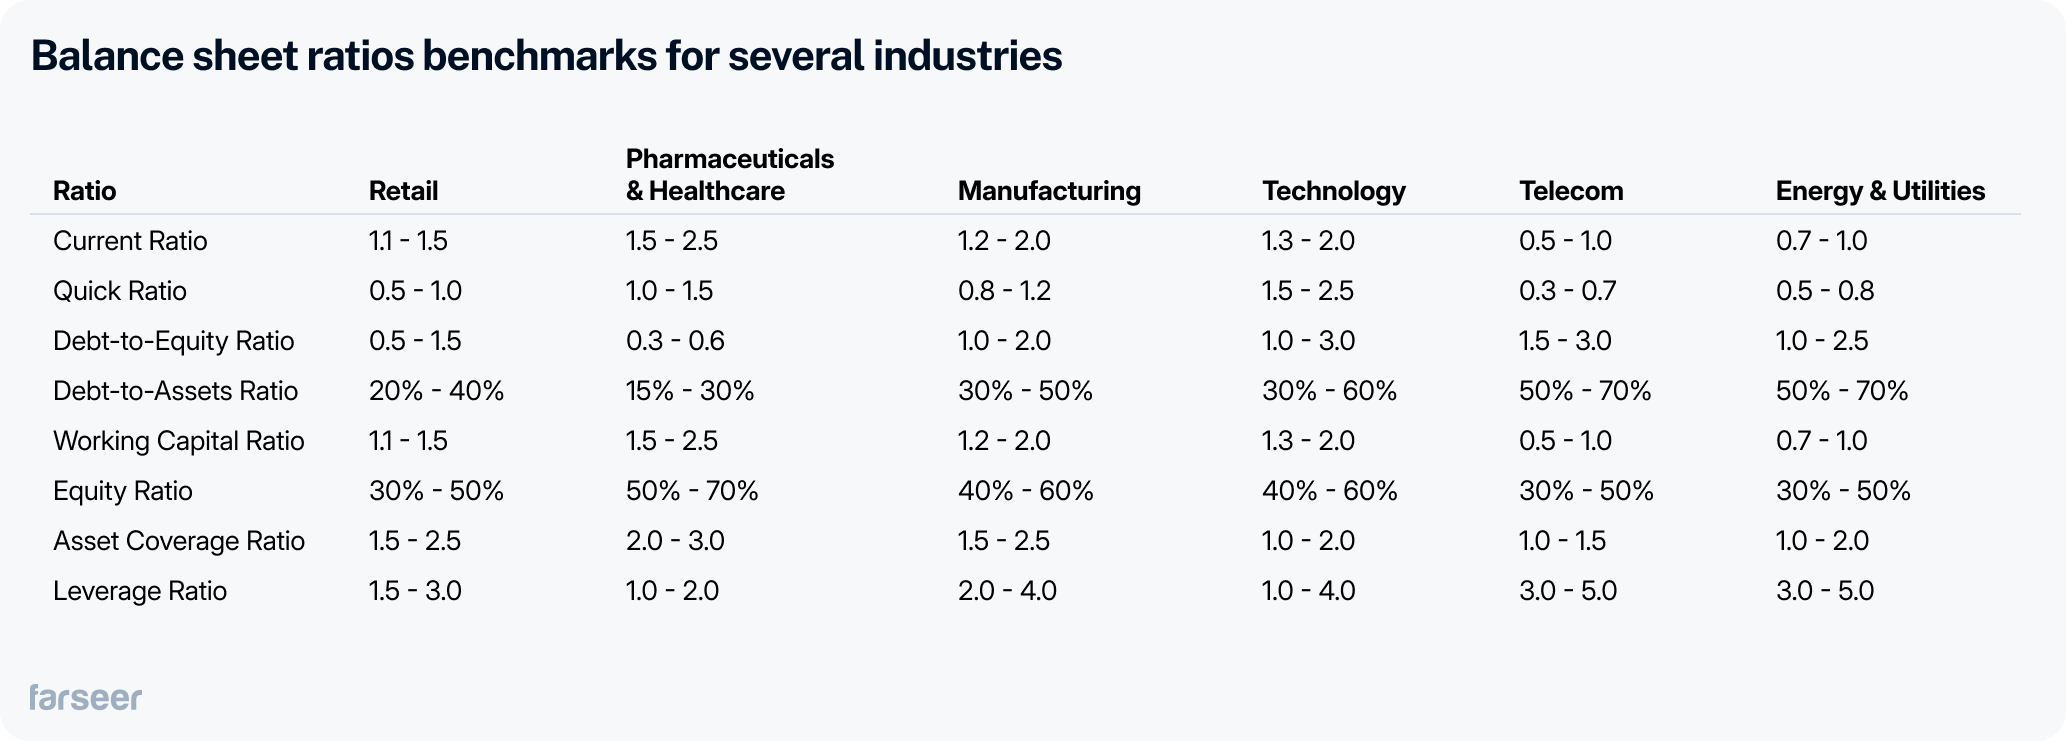
3. Then compare against benchmarks.
- Ratios make sense only when compared to industry averages, past performance, or competitors.
- For example, a retail company with a current ratio of 1.2 might be fine, but if competitors have an average of 2.0, it could mean that the company has liquidity problems.
4. Make sure to analyze trends over time.
- A single ratio at one point in time doesn’t tell the full story. Tracking ratios quarterly or annually helps identify positive or negative trends.
- If, for example, a company’s profit margin keeps declining, it may indicate rising costs or pricing pressure.
5. Finally, use these insights to make decisions.
- Finance teams use ratio analysis to make strategic decisions like cost-cutting, investment planning, or securing funding.
- Therefore, a company with, for instance, a high debt-to-equity ratio may need to slow down borrowing or improve cash flow before taking on new debt.
5 Key Categories of Financial Ratios
Now that it’s clear how ratio analysis works, it’s necessary to explain one of its most important parts – categories of key ratios.
Different financial ratios tell a different financial story. Some show whether a business can pay its bills, others reveal how efficiently it operates, and some highlight profitability or financial risk. Let’s explore how and go through some practical examples.
Liquidity ratios – Can we pay the bills?
Liquidity ratios measure whether a company has enough short-term assets to cover its immediate liabilities. Meaning – they tell you if a company has enough cash (or other assets that can be quickly turned into cash) to cover day-to-day expenses like supplier bills, salaries, etc.
There are two most common liquidity ratios:
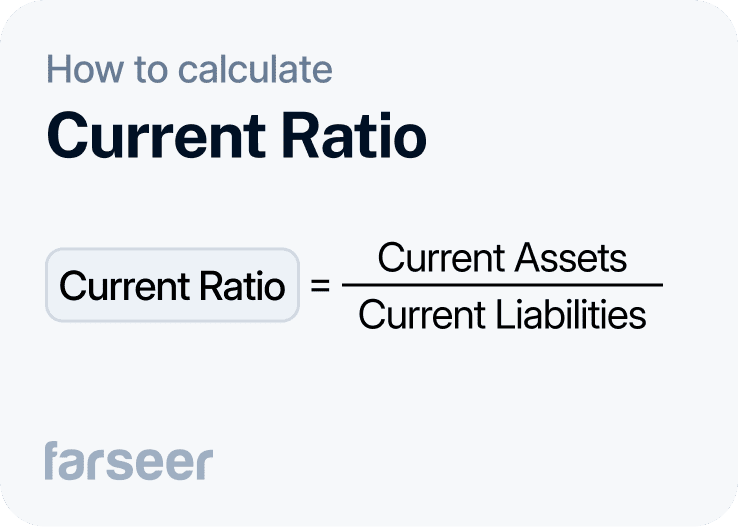
1. Current Ratio = Current Assets / Current Liabilities
- A ratio above 1 means the company has more assets than liabilities, which is generally a good sign.
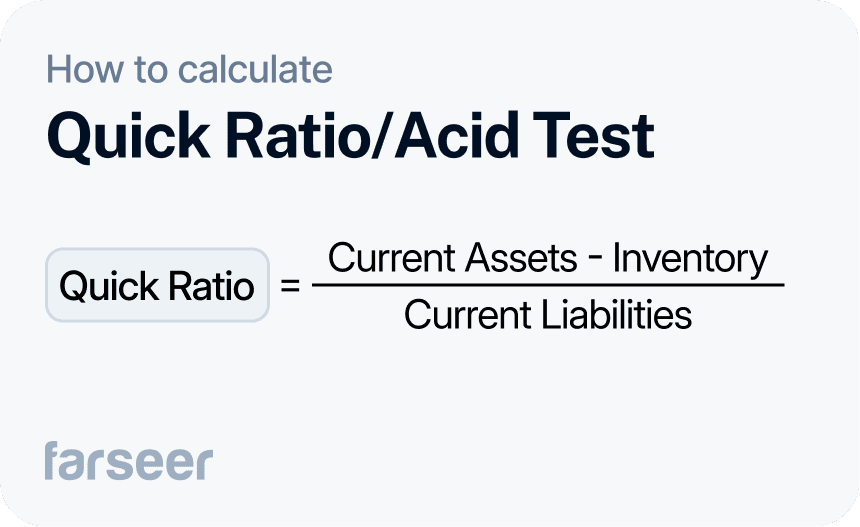
2. Quick Ratio = (Current Assets – Inventory) / Current Liabilities
- This ratio excludes inventory, making it a stricter test of liquidity. It’s useful for businesses where inventory takes longer to sell, like manufacturing.
Quick Ratio vs Current Ratio: Which One Tells You More About Liquidity?
Read moreProfitability ratios - Are we making enough profit?
These ratios show how effectively a company generates profit from its revenue. Key metrics include:
Gross Margin = (Revenue – Cost of Goods Sold) / Revenue
Operating Margin = Operating Income / Revenue
Net Profit Margin = Net Income / Revenue
Apple is a great example of profitability management. Its high gross margin (often around 40%) comes from premium pricing and cost control. If profitability ratios drop, it could signal rising costs or inefficient operations.
Efficiency ratios - Are we using our assets wisely?
Efficiency ratios show how well a company uses its resources. Two important ones are:
- Asset Turnover Ratio = Revenue / Total Assets
- Inventory Turnover Ratio = Cost of Goods Sold / Average Inventory
Retailers like Walmart closely track these metrics. A high inventory turnover ratio means products are selling quickly, reducing the risk of unsold stock. A low ratio, on the other hand, could signify overstocking or weak sales.

Leverage Ratios – Are We Taking on Too Much Debt?
Leverage ratios help assess financial risk. Two key ones include:
- Debt-to-Equity Ratio = Total Debt / Total Equity
- Interest Coverage Ratio = Operating Income / Interest Expense
Consider Tesla, which has taken on significant debt to expand production. If its debt-to-equity ratio climbs too high, investors might worry about its ability to repay loans. However, as long as earnings cover interest payments (high interest coverage ratio), the debt remains manageable.
Market Value Ratios – What Do Investors Think?
Market value ratios are important for publicly traded companies. Two most common ones are:
- Price-to-Earnings (P/E) Ratio = Stock Price / Earnings Per Share
- Earnings Per Share (EPS) = Net Income / Number of Shares
For example, Amazon often has a high P/E ratio, meaning investors expect strong future growth. A low P/E ratio, on the other hand, might suggest the stock is undervalued or the company is struggling.
How to Apply Ratio Analysis in Practice
Finance teams use ratio analysis in several ways:
- Benchmarking against competitors – Comparing key ratios with industry averages helps identify areas for improvement.
- Identifying financial risks – A declining liquidity ratio might signal potential cash flow issues.
- Supporting investment decisions – Investors and finance teams look at profitability and leverage ratios before making funding decisions.
For instance, when a company like Nike plans to expand into new markets, it most likely checks its return on assets (ROA) and debt ratios to ensure the investment makes financial sense.
Common Mistakes to Avoid
While ratio analysis is useful, misinterpretation can lead to poor decisions. Common mistakes include:
- Focusing on a single ratio – Looking at just the P/E ratio without considering debt levels or profitability can be misleading.
- Ignoring industry benchmarks – A high debt ratio might be normal in capital-intensive industries but risky in others.
- Overlooking seasonality – Retailers often have lower liquidity ratios before holiday sales, but that doesn’t mean they’re in trouble.
Conclusion
Ratio analysis helps finance teams make informed decisions, from managing debt to improving profitability. However, no single ratio tells the full story. By using a combination of liquidity, profitability, efficiency, leverage, and market value ratios, companies can gain deeper insights into their financial performance.
Want to ensure your company is financially stable? Start tracking these key ratios today.


A Complete Guide to Financial Statement Analysis for Strategy Makers
Read more
Best Financial Analysis Tools in 2026: Compare Features & Pricing
Read more