Gross Margin Calculator
How to Use the Gross Margin Calculator
To calculate your gross margin, enter a few key inputs:
Unit Price, Units Sold, Discount %, Returns, and Cost of Goods Sold (COGS).
If you want more precision, include freight, duties, or variable manufacturing costs – these represent your landed costs and show the true profitability of each product or SKU.
Once you fill in the fields, the calculator instantly shows:
- Gross Profit (value)
- Gross Margin (%)
- Net Revenue and Total COGS
- Unit-level margin and required price to reach your target margin
You can also download the results as a CSV or reset the calculator to test different pricing and cost scenarios.
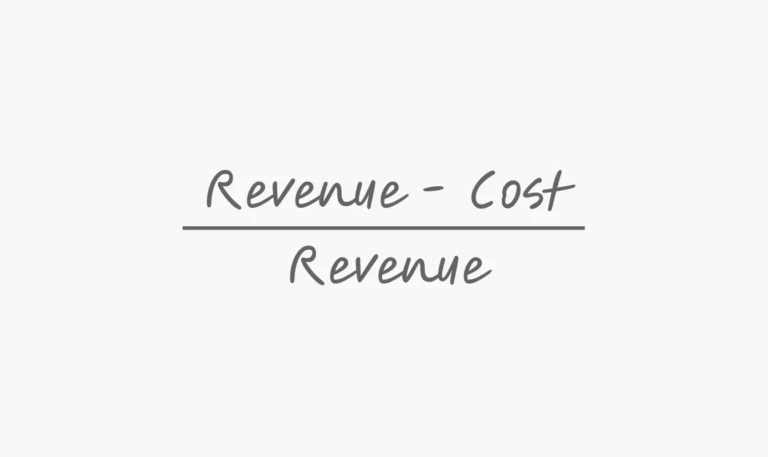
What is Gross Margin and How to Calculate It
Gross margin measures how much of your revenue remains after covering the direct costs of production or delivery.
It’s the simplest, most powerful signal of profitability – telling you how efficiently your company turns cost into value.
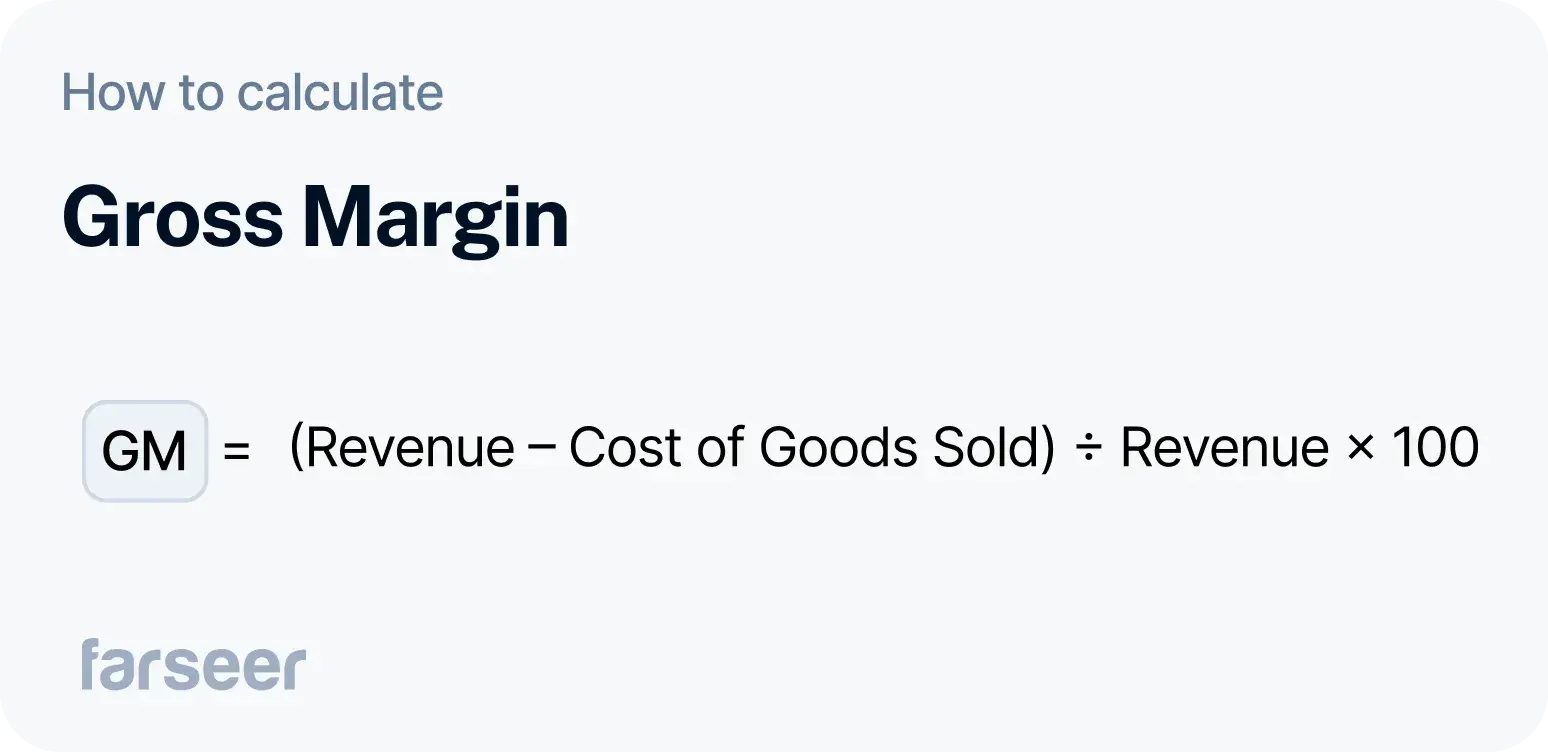
So for example, if you generate €1,000,000 in revenue and your COGS are €600,000, your gross profit is €400,000 – a 40% gross margin.
A higher margin means you retain more from every euro sold, giving you more flexibility for R&D, marketing, or operational investment.
Gross Margin vs. Gross Profit
While both measure profitability, they express it differently:
- Gross Profit is an absolute number – the difference between sales and production costs.
- Gross Margin is a percentage – how much of each euro stays after those costs.
Gross margin is better for comparing products, brands, or markets because it shows profitability relative to scale. A €2 million profit on €20 million sales (10%) is very different from €2 million on €5 million (40%).
Why Gross Margin Matters
Gross margin helps finance and commercial teams understand:
- Pricing power: how much room you have to adjust prices before eroding profit.
- Cost efficiency: whether production, logistics, or procurement costs are creeping up.
- Product mix: which SKUs or markets drive overall profitability.
Even small changes matter. Improving margin by 2–3 percentage points can dramatically increase operating profit, without selling a single extra unit.
Gross margin is also the foundation for advanced analysis like contribution margin, break-even point, and ROI forecasting – metrics that shape strategic decisions every day.
When to Use a Gross Margin Calculator
Use this calculator when you need to:
- Test pricing and discount scenarios without rebuilding spreadsheets.
- Compare product or market profitability side by side.
- Assess portfolio mix and contribution margin.
- Set target prices that meet strategic margin goals.
- Support forecasting and performance reviews with real margin data.
It’s especially valuable in industries like pharmaceuticals, manufacturing, and retail, where margins are tight, and small inefficiencies scale fast.
Gross Margin in Strategic Finance
Gross margin isn’t just a line on your P&L – it’s a strategic lever for decision-making.
It feeds into:
- Scenario planning: What happens if raw material costs increase by 10%?
- Capital allocation: Which products or regions justify additional investment?
- Pricing strategy: How do different discounts or tenders affect profit?
In modern FP&A, gross margin becomes a dynamic input – tested, simulated, and optimized regularly instead of calculated once a quarter.
Farseer for Margin Planning and Forecasting
With Farseer, you can:
- Build margin models by product, market, or customer segment
- Simulate “what-if” scenarios (price, volume, cost changes)
- Track gross, contribution, and net margins side by side
- Consolidate data across business units automatically
It’s the same logic behind this calculator – just scaled up for your full planning process.
Book a demo and see how finance teams plan profitably, faster, and with complete visibility with Farseer.