Profit Margin Calculator
How to Use This Profit Margin Calculator
The profit margin calculator here helps you figure out how profitable your pricing is. Enter two numbers:
- Cost – what it takes to produce or deliver the product or service
- Revenue – what you sell it for
Once you enter both, the calculator shows your gross profit margin—the percentage of revenue that stays after covering the cost.
Use it when you need a quick check on whether your prices make sense. You can:
- Test different price points for a product
- See how cost changes affect your margin
- Compare offers from suppliers
- Back up pricing decisions with data during planning
It’s simple on purpose. You only see what matters, so you don’t waste time filling out extra fields.
Why Profit Margin Matters
Gross profit margin shows if your pricing is doing its job. After covering the cost, it tells you how much money stays in the business. If the margin looks thin, there’s probably a pricing or cost problem to solve.
Say you’re comparing two products. One gives you a 30% margin, the other just 8%. That difference changes how you plan, especially when you’re deciding which products to push or cut.
If you’re managing a bigger catalog, margin helps you sort out what actually makes money. That’s why many finance teams rely on regular margin analysis to stay focused on what moves the needle.
The profit margin calculator here gives you a quick snapshot. But if you’re working with dozens of SKUs or product types, you’ll want to go deeper.
Use margin as a filter; it helps you back decisions with numbers, not guesses.
What Profit Margin Really Tells You
Profit margin shows how much money stays in the business after you cover direct costs. It helps you see if your pricing is working or if something needs to change.
The formula is simple:
Margin = ((Revenue – Cost) / Revenue) × 100
It gives you a fast check on how much you’re actually making. Most teams use it when reviewing prices or comparing products. If one product gives you a 35% margin and another barely hits 10%, that tells you where to focus.
Take a distributor, for example. Freight costs go up, and their margins drop below 25%. That’s a clear sign to revisit supplier deals or adjust pricing. You don’t need a full model to see the issue, just one number.
If you’re seeing margins drop, it might be time to look closer. Use margin analysis to track changes across time or product lines.
Where Finance Teams Use It
Gross margin is a tool for day-to-day decisions across teams.
In consumer goods distribution, margin helps decide which product lines to prioritize. If freight costs go up, margin flags where pricing adjustments are needed to keep targets intact.
In wholesale and retail, buyers use margin to pressure vendors. If a product eats into targets, it’s on the chopping block, unless better terms come in. Finance backs those calls with data.
In manufacturing, planners use margins to stay ahead of raw material changes. If input costs rise, it’s easy to spot where small price moves can fix compressed margins without hurting volume.
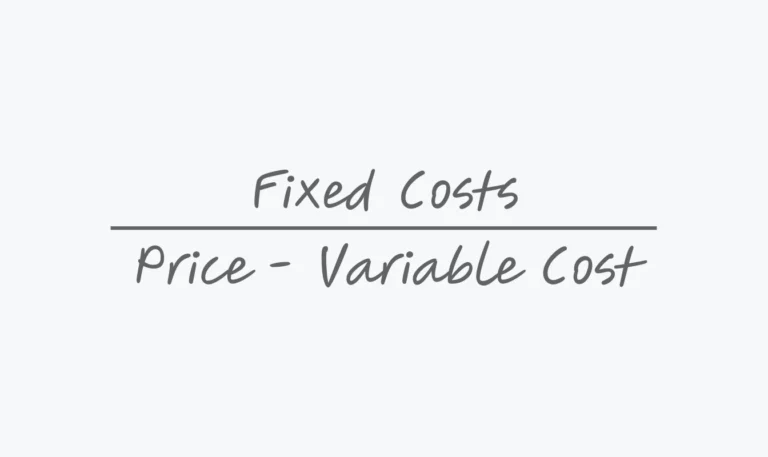
Already have your margin? Use this break-even calculator to find out how many units you need to cover your fixed costs.
If you’re working out volume-based targets, pair this with cost-volume-profit analysis to see how cost and pricing changes affect breakeven.
Planning Profitability Beyond One Product
Margin from one product is a starting point. But it doesn’t say much if you’re managing dozens.
Let’s say you run 30 SKUs. One pulls a 40% margin, but five others barely hit 10%. Without seeing the full margin mix, your P&L might look better on paper than it performs in reality.
To get the full picture, pull your results into a weighted average margin model. From there, it’s easier to track how changes in sales volume or cost structure impact overall profit.
Teams often overlook this when margin starts eroding slowly, month by month. But a small drop across your top sellers can take a bigger bite out of earnings than one underperforming SKU.
If you’re managing multiple revenue streams, use profitability analysis to evaluate overall product or customer margins. It helps you spot trends, see where value’s slipping, and act before it hits the bottom line.
Use More Than a Profit Margin Calculator. Plan and Simulate Profitability with Farseer
A profit margin calculator gives you a quick answer. Farseer helps you act on it.
Connect margin logic directly to your forecasts, test pricing changes across your entire catalog, and see how they affect total gross profit. No spreadsheet cleanups. No broken formulas.
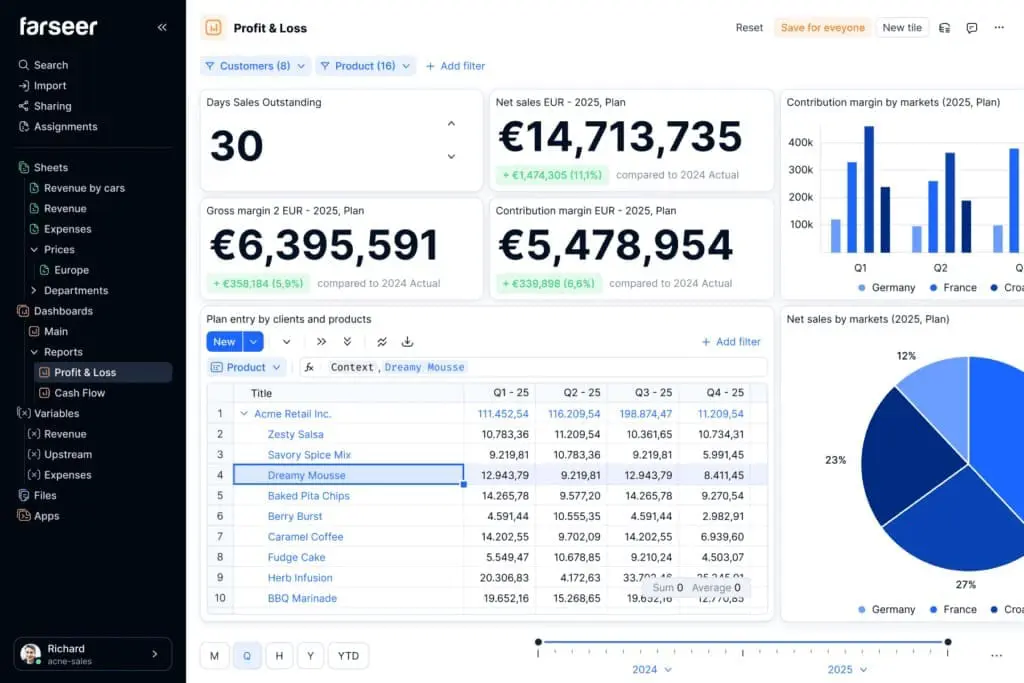
Whether you’re reviewing costs or setting new targets, Farseer gives you a model that updates in real time, so you always know where your margin stands.
If you’re ready to move beyond static tools and start planning with real impact, book a demo and we’ll show you how.