Cost-Volume-Profit (CVP) Analysis Explained (With Formula & Examples)

CVP analysis (cost-volume-profit) shows exactly how sales, pricing, and costs impact profit. Get it right, and you’ll know how many units to sell to stay profitable. Get it wrong, and targets get missed, budgets fall apart, and profit margins shrink fast.
Read: A Complete Guide to Financial Statement Analysis for Strategy Makers
Too many businesses rely on gut feelings instead of real numbers. CVP analysis makes it clear when to adjust prices, cut costs, or push for more sales, so forecasts stay accurate, budgets hold up, and profitability stays under control.
Here’s how it works.
What is Cost-Volume-Profit Analysis, and Why Does It Matter?
Cost-volume-profit (CVP) analysis is a simple financial model that breaks down how sales, costs, and pricing affect profit. It helps businesses set the right prices, control costs and hit profit targets – without relying on guesswork.
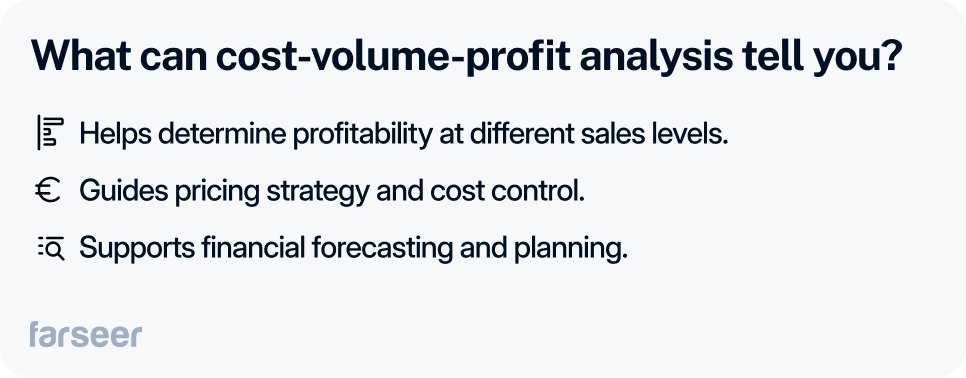
At its core, CVP answers three essential questions:
-
How many units do we need to sell to break even?
-
How will a change in price or cost affect profit?
-
What’s the best way to improve margins – cut costs, raise prices, or increase sales?
Why CVP Matters
Too many businesses set prices without knowing if they’ll stay profitable or chase sales that barely cover costs, similar to how companies choose financing options based on the pecking order theory. Violeta faced this challenge in sales planning, struggling to align pricing, SKU forecasting, and profitability goals before centralizing its financial planning process with real-time modeling using Farseer. Without CVP, it’s easy to:
- Price too low and lose profit.
- Underestimate costs and shrink margins.
- Set unrealistic sales targets and miss financial goals.
CVP lays everything out in numbers, so there’s no second-guessing.
Break-Even Analysis vs. CVP Analysis
Break-even analysis tells you when revenue covers costs – nothing more. CVP goes further. It models how different pricing, cost, and sales changes impact profit before you make a move.
For example:
- A manufacturer might calculate whether switching to a cheaper supplier saves more than it costs in quality control issues.
- A retailer might test whether offering discounts will increase sales enough to offset the lower margins.
CVP makes it easy to see what drives profit, and what holds it back.
The Key Numbers You Need to Know, And Why They Matter
CVP analysis depends on a few key numbers that define costs, profitability, and break-even points. Understanding these metrics is crucial for profitability analysis, as they help businesses fine-tune pricing, sales targets, and cost structures with confidence.
Fixed Costs vs. Variable Costs
CVP analysis starts with understanding costs.
- Fixed costs stay the same no matter how much you sell (rent, salaries, equipment).
- Variable costs change with sales volume (materials, commissions, shipping).
Why it matters:
- High fixed costs mean a higher break-even point and more risk.
- Pricing decisions depend on knowing unit costs – if variable costs are too high, margins shrink.
- Scaling requires the right balance – too many fixed costs make downturns riskier.
Example: A manufacturer choosing between automation (higher fixed costs, lower per-unit costs) or hiring more workers (lower fixed costs, higher variable costs).
Since CVP depends on demand estimates, these demand forecasting KPIs help businesses refine sales assumptions.
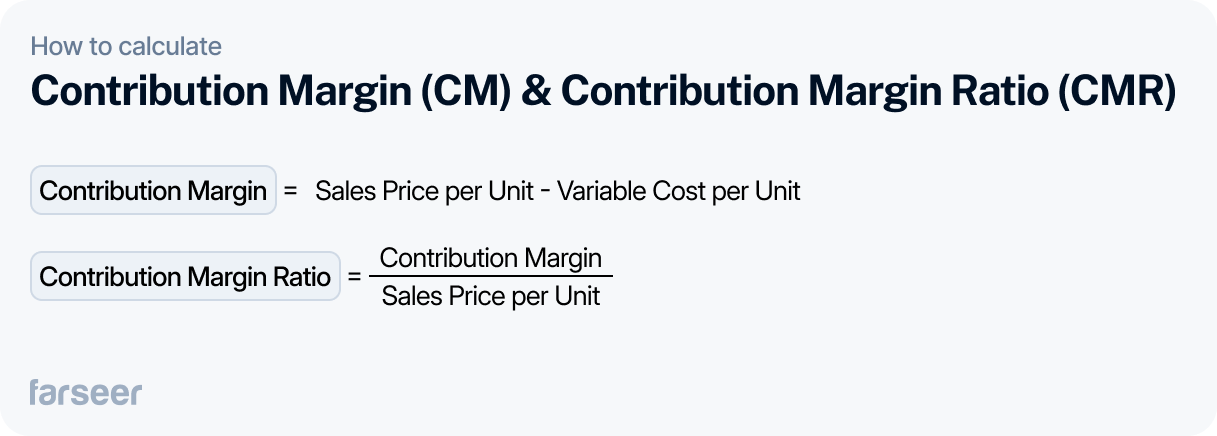
Contribution Margin (CM) & Contribution Margin Ratio (CMR)
The contribution margin shows how much profit each sale generates after covering variable costs. It’s a key number for pricing, product focus, and cost control.
Why it matters:
- A higher contribution margin means more profit per sale, making it easier to hit financial targets.
- It helps decide which products to push – low-margin products need high sales volume to stay profitable.
- It’s essential for break-even analysis and pricing decisions – knowing your CM makes it clear when to adjust prices or cut costs.
Example: A retailer comparing two product lines – one with a high contribution margin but lower sales volume, and another with a lower margin but high demand. By focusing on the right mix, they maximize overall profitability without chasing unprofitable sales.
This margin analysis guide breaks down how businesses adjust pricing and product mix to improve profitability.
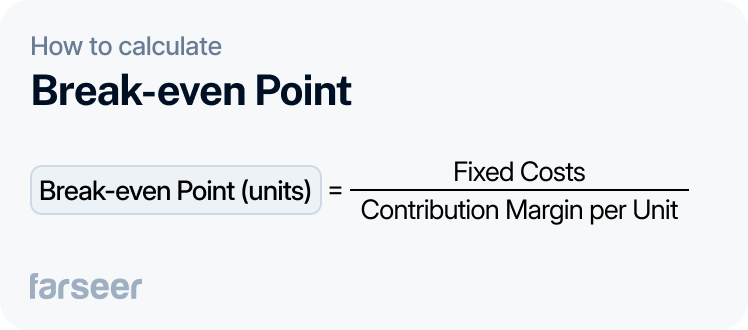
Break-even Point
The break-even point shows exactly how many sales you need to cover costs—before making a single dollar of profit. If you don’t hit this number, you’re losing money.
Formula:
Why It Matters:
- Tells you the minimum sales needed to avoid losses.
- Helps decide if your pricing and costs make sense.
- Keeps sales and financial targets realistic.
Example: An e-commerce brand spends $50,000 on fixed costs and makes $25 profit per unit after covering variable costs. They need to sell 2,000 units just to break even. If projections show only 1,500 sales, they either cut costs, raise prices, or rethink the product before it drains cash.
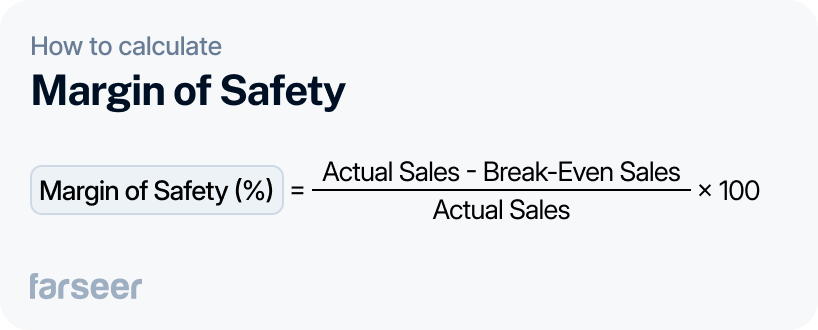
Margin of Safety: How Much Sales Can Drop Before You Lose Money
The margin of safety shows how far sales can fall before your business starts losing money. It’s a reality check – if demand drops, do you have enough room to stay profitable?
Formula:
Why It Matters:
- Reveals how much risk your business can handle.
- Helps plan for slow seasons or market downturns.
- Shows when to adjust pricing, expenses, or sales strategies.
Example: A retailer forecasts 20,000 sales but only needs 15,000 to break even. That means a margin of safety of 25%—sales can drop by that much before losses start. If demand dips below that point, they need to adjust pricing, cut costs, or rethink promotions to stay profitable. Tracking budget vs. actual performance helps spot risks early and make corrections before margins disappear.

When Cost-Volume-Profit Analysis Doesn't Match Reality
CVP analysis works best under specific conditions, but real businesses rarely operate under perfect conditions. Here’s where standard CVP models fall short and how to fix them.
- Prices and costs don’t stay fixed. CVP assumes selling prices and costs per unit remain constant, but businesses deal with supplier cost fluctuations, discounts, and inflation.
- Fix: Regularly update CVP calculations with real-time pricing and cost data.
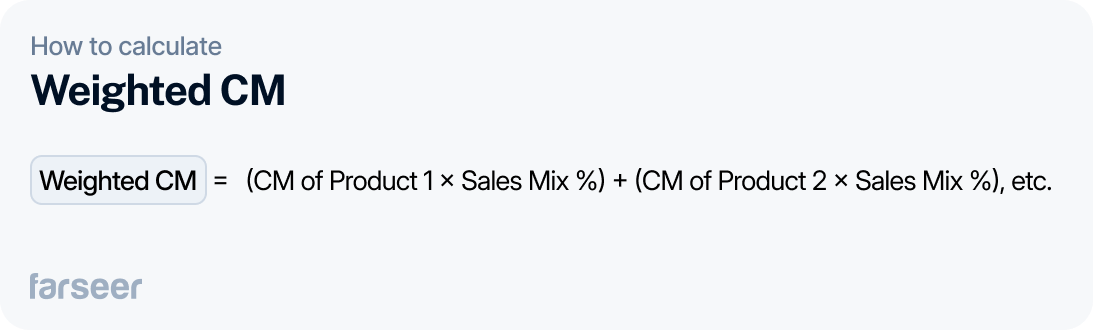
- Businesses sell multiple products. Standard CVP models assume a single product or a fixed product mix, but most companies sell different items with varying profit margins.
- Fix: Use a weighted average contribution margin to reflect real sales distribution.
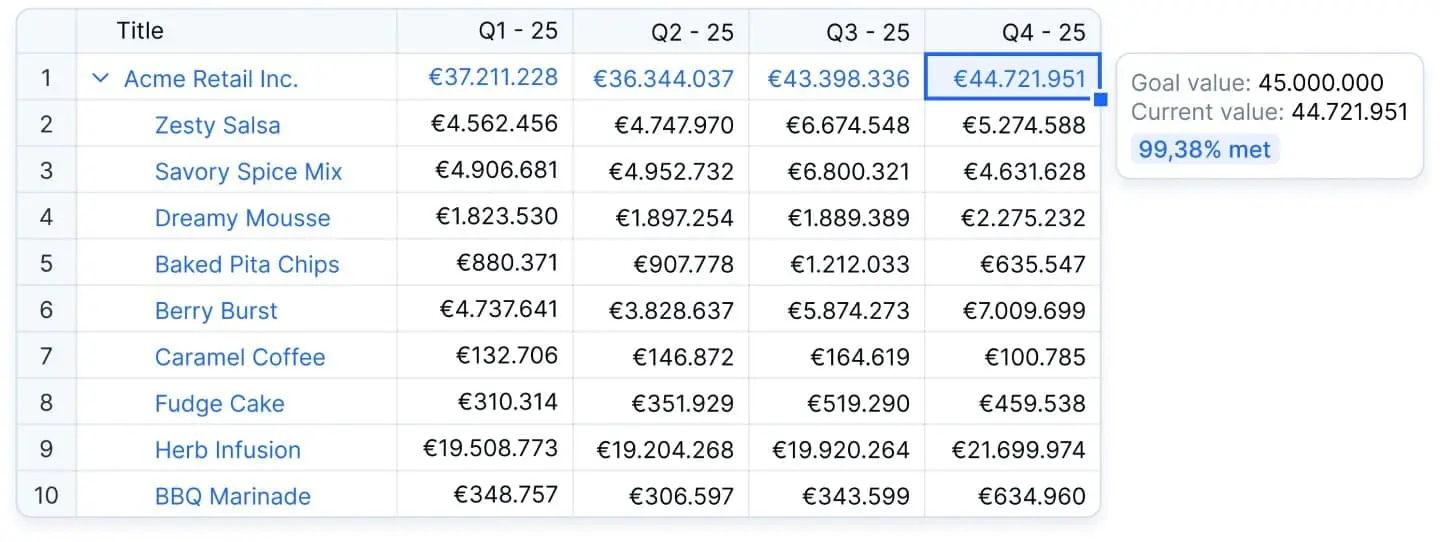
Example: A fast-food chain updates its menu and notices customers buying more low-margin items instead of high-margin ones. Even though total sales stay the same, profit drops. By tracking this shift, they adjust promotions and pricing to stay profitable.
Regularly comparing budget vs. actual performance can catch these shifts early and adjust CVP calculations accordingly.
How Businesses Use Cost-Volume-Profit Analysis Beyond Break-Even
With cost-volume-profit analysis, businesses test pricing, handle costs, and prepare for market shifts before they happen. It isn’t just about hitting break-even.
Testing Different Scenarios Before Key Decisions
Instead of guessing how price changes, cost increases, or sales drops will impact profit, businesses run different scenarios using CVP analysis. This helps them see the numbers before deciding what to do.
Example: A manufacturer checks if raising prices by 5% will cover rising material costs or if negotiating better supplier contracts makes more sense.
Adjusting Prices Without Losing Profit
Discounts and price cuts only work if higher sales make up for lower margins. CVP helps businesses see if the math adds up.
Example: A retailer considers a 10% price drop. They check if the boost in sales will make up for smaller profit per unit or if they should hold prices steady.
Planning for Inflation, Costs, and Seasonality
Inflation, supply chain disruptions, and seasonal demand shifts can wreck profits. CVP helps businesses adjust costs and pricing to stay ahead.
Example: A retail chain uses CVP to set holiday discounts, making sure lower prices still keep them profitable while maximizing seasonal sales.
Spreadsheets Can Make Cost-Volume-Profit Analysis a Pain
Cost-volume-profit analysis should be part of everyday financial planning, not just a one-time spreadsheet task. But spreadsheets make it frustrating.
Why Spreadsheets Make CVP a Struggle
Most finance teams rely on Excel, but it’s slow, manual, and full of errors:
- Numbers go stale fast – Prices, costs, and sales volumes change constantly, but spreadsheets don’t update automatically.
- Scenario planning is a headache – Testing different pricing or cost scenarios means endless tabs and version control chaos.
- One formula breaks everything – A single mistake throws off calculations, and tracking it down takes hours.
- Managing multiple products is painful – Different product margins and sales mixes don’t fit neatly into a basic CVP model.
- Reporting takes forever – Every update means manual data entry instead of real analysis.
How Farseer Fixes CVP
Farseer automates CVP analysis with real-time data, instant scenario planning, and error-free calculations. A manufacturer, for example, can test how rising material costs impact break-even points in seconds instead of spending hours fixing spreadsheets.
Key Takeaways
- Cost-volume-profit analysis shows what drives profit. It helps set the right prices, control costs, and hit targets.
- Break-even matters. Without it, pricing and sales targets are just guesses.
- The contribution margin is key. The higher it is, the easier it is to stay profitable.
- CVP isn’t just about break-even. Businesses use it to adjust pricing, manage costs, and plan for market shifts.
- Spreadsheets slow things down. Errors, outdated data, and manual updates make CVP harder than it should be.
- Automation makes CVP faster and more accurate. Tools like Farseer update data in real time, making pricing and forecasting easier.


A Complete Guide to Financial Statement Analysis for Strategy Makers
Read more
Best Financial Analysis Tools in 2026: Compare Features & Pricing
Read more