What Is Margin Analysis and How to Conduct It Step by Step

Margin analysis helps you determine how much of your revenue turns into profit – and where you might be losing money. It plays a crucial role in profitability analysis, providing insights into inefficiencies that can impact overall financial health.
Read: A Complete Guide to Financial Statement Analysis for Strategy Makers
This guide will give you simple, actionable steps to master margin analysis. Whether it’s refining pricing, cutting costs, or focusing on the most profitable parts of your business, you’ll learn how to use margin insights to boost your bottom line.
Understand how retained cash flow affects your profitability and operational growth.
How Margin Analysis Works And Why It Is Important
What is Margin Analysis
Margin analysis is an important tool for evaluating the profitability of your business, products, or services. It’s the difference between your sales price and the cost of goods sold (COGS). This difference, calculated as a percentage, is called the margin.
When you understand your margins, you see which areas are driving profitability and what you need to improve. It’s crucial for managing costs, pricing effectively, and improving overall financial performance.
Understanding your margins is important, but keeping them accurate takes smart planning. See how a 2-10 Rolling Forecast helps you stay ahead.
Three Most Important Margins
Three main metrics are most commonly used in margin analysis: gross, operating, and net margin.
Gross Margin
The gross margin shows how much money is left after you cover the cost of goods sold (COGS). It’s a key measure of how efficient your business is at turning revenue into profit.
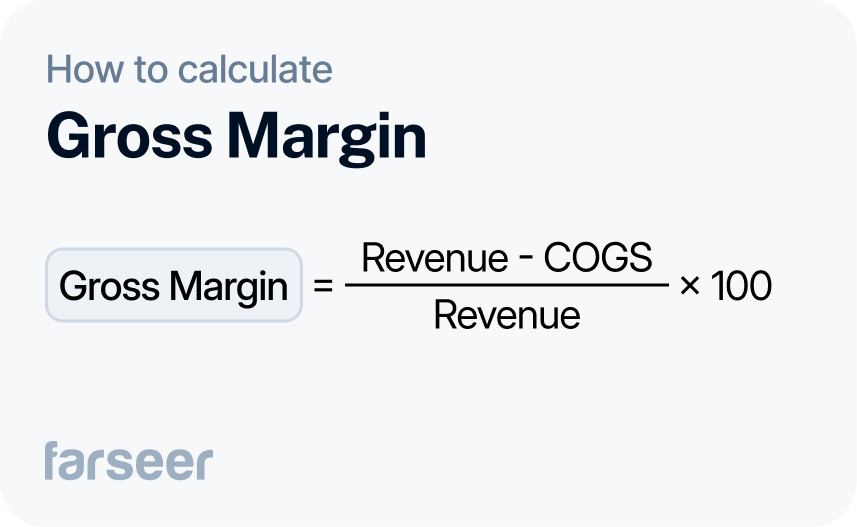
Example: If you bring in $1,000,000 in revenue and spend $600,000 on COGS, your gross margin is 40%. That means 40% of your revenue is left to cover other costs like salaries, rent, and profit.
Knowing your gross margin helps you spot inefficiencies in production or delivery costs. If it’s lower than expected, it might be time to revisit your pricing strategy or cost management.
Operating Margin
Operating margin tells you how much profit your business makes after covering expenses like salaries, rent, and utilities. A high operating margin means your operations are efficient, and your costs are under control. A low margin could be a sign of too high expenses or that you’re not charging enough for your products or services.
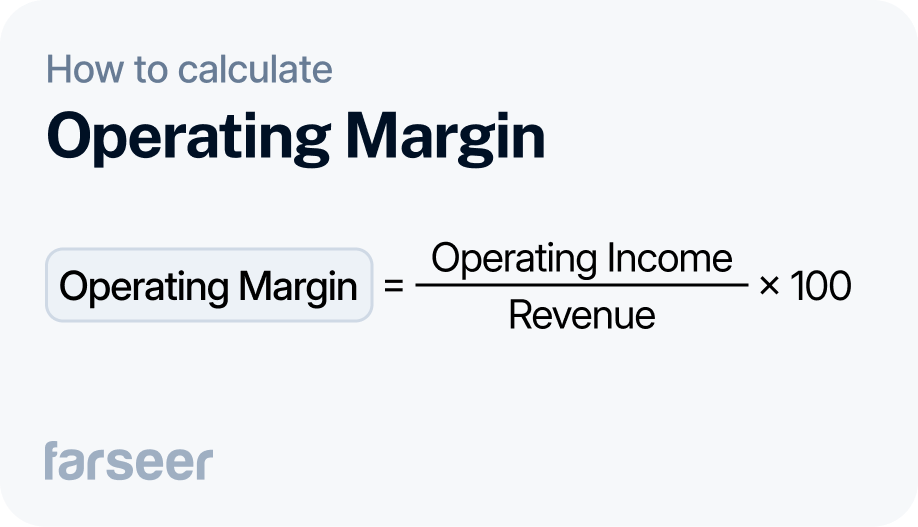
Example: If your revenue is $1,000,000 and your operating income is $200,000, your operating margin is 20%. That means 20% of your revenue is left after paying all operating costs.
Net Margin
Net margin shows how much profit your business keeps after paying all expenses, including operating costs, taxes, and interest. It’s the clearest way to see if your business is truly profitable.
A high net margin means you’re good at turning revenue into profit. A low net margin probably means your costs are too high or you’re carrying too much debt.
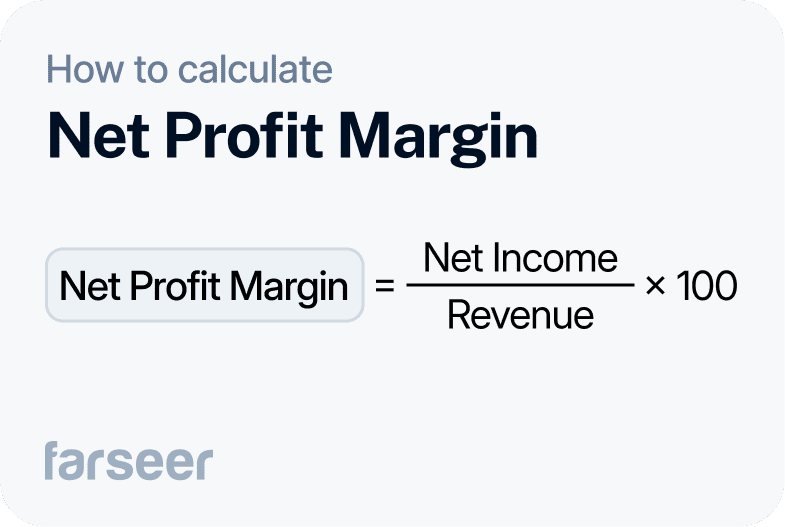
Example: If your revenue is $1,000,000 and your net profit is $100,000, your net margin is 10%. That means 10% of your revenue turns into profit.
Net margin is a big-picture indicator. It shows how well your business is performing and if your pricing, costs, and operations are aligned and generating profit.
Why Margins Are Important
Margins show you what’s working and what’s not. They help you focus on profitable products, adjust pricing, and cut unnecessary costs.
Read: The No-Nonsense Guide to Cost-Volume-Profit Analysis.
For example, rising production costs in your gross margin might mean it’s time to renegotiate with suppliers. A low operating margin could point to high overhead costs, like rent or salaries, that need to be adjusted for more efficiency.
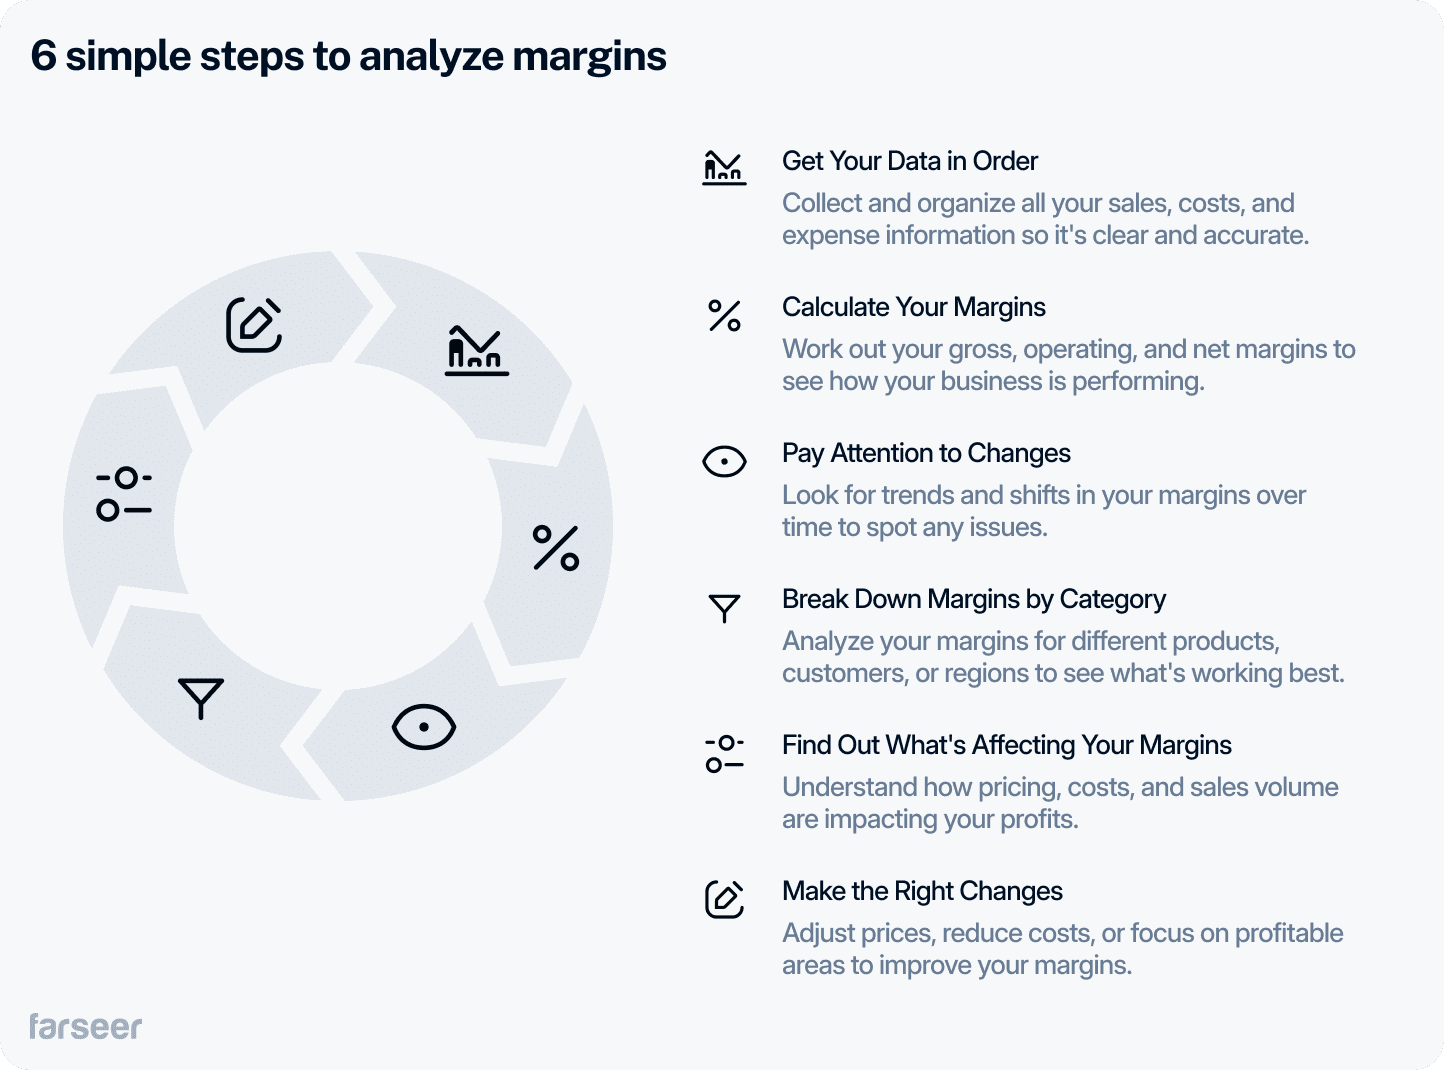
6 Simple Steps in Margin Analysis
Here’s the process of margin analysis, broken down into 6 simple steps.
Step 1: Start With Clear And Accurate Data
The first step in margin analysis (and every other analysis for that matter) is clean and accurate data. Gather detailed data on your revenue, costs, and expenses. Break it down into categories that make sense for your business, like products, customer groups, or regions.
FP&A software saves time by organizing your data quickly. The more detailed and clear your data is, the easier it will be to spot trends and make sense of the numbers.
Step 2: Calculate the Margins
Now that you have clean data, it’s time to put it to work. Use the margins you’ve calculated—gross, operating, and net—to see where your business is strong and where it’s falling short.
- Compare margins across different periods to track performance.
- Look for red flags, like declining gross margin, which might mean rising production costs.Use operating and net margins to find inefficiencies or areas where expenses are eating into profits.
Step 3: Focus on What’s Changing
After calculating your margins, pay close attention to how they change over time. Shifts in gross, operating, or net margins help you figure out what’s working and what needs fixing.
For example:
- Look for trends: dropping gross margins might mean rising costs, while flat net margins could signal pricing or expense issues.
- Use dashboards: tools make it easy to track changes and spot patterns over time.
- Connect the dots: shrinking margins and weak liquidity could point to cash flow problems. Learn more about liquidity and solvency ratios and how they fit into the bigger picture.
Step 4: Analyze Margins Across Different Segments
Not all parts of your business are equally profitable. Breaking down your margins by products, customers, or regions shows where you’re making money and where you’re not. This helps adjust pricing, cut costs, or prioritize investing in areas where it’s going to make the most difference.
- Products or services: Find your most profitable ones to grow and cut back on those dragging you down.
- Customer groups: Focus on high-margin customers and think about new strategies for less profitable ones.
- Regions: See which markets are performing well and where you might need to make changes.
Step 5: Find What’s Driving Your Margins
Margins are shaped by three main factors: pricing, costs, and sales volume. When you understand these drivers you’ll know what’s affecting your profitability, and what you’ll need to change.
- Pricing: Even small price increases on high-margin products can have a big impact.
- Costs: Rising costs, like materials or rent, eat into profits. Analyze fixed and variable costs to find areas to save.
- Sales volume: Low-margin products with high volumes can drag down your profits.
Once you know the drivers, test different scenarios to see what happens with your margins. For example, simulate a 5% price increase or a cost reduction in production. Scenario testing helps you see the impact of decisions before you make them.
Step 6: Improve Your Margins With the Right Changes
Analysis without action is not very useful. After you’ve analyzed your margins and tested scenarios, it’s time to use what you’ve found.
- Change pricing: Raise prices on profitable products or services where demand supports it.
- Reduce costs: Focus on cutting unnecessary spending, especially in areas with low returns.
- Shift resources: Prioritize the products, customers, or regions that drive the highest margins.
Keep reviewing your margins regularly to make sure you are delivering results. Small, thoughtful changes can lead to long-term profitability gains.
Read more: Profitability Planning Done Right: Common Pitfalls and Solutions
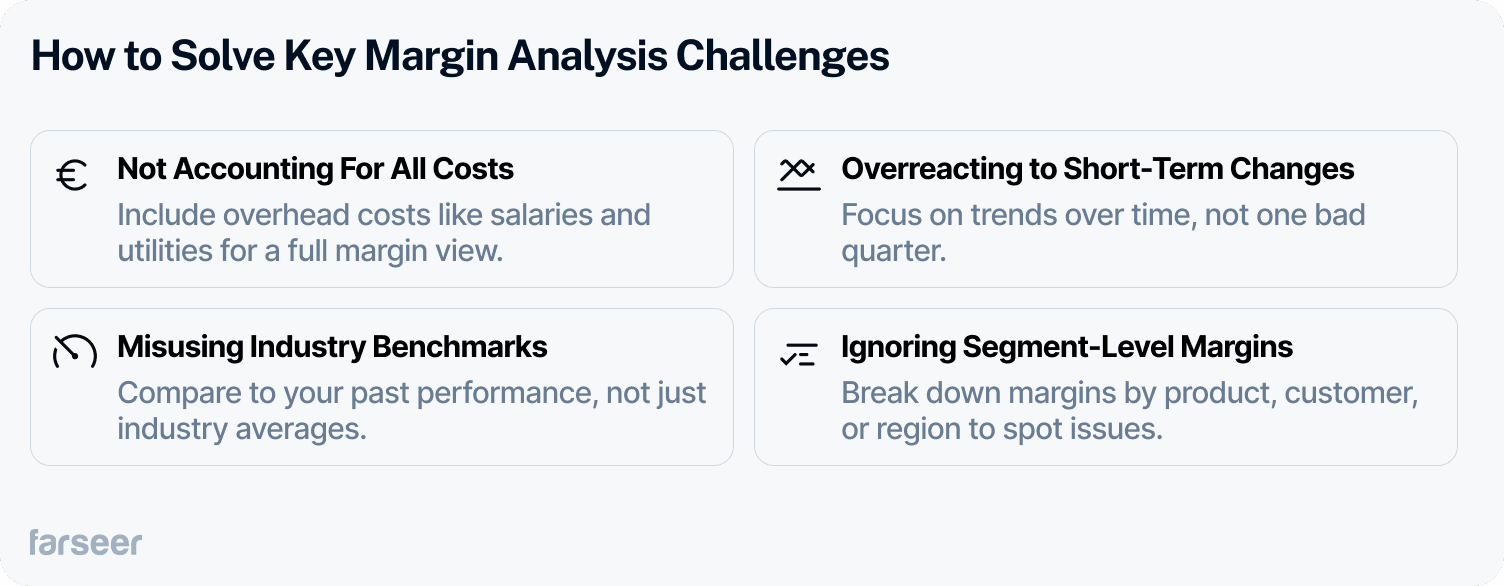
4 Common Challenges in Margin Analysis (And How to Solve Them)
Even with a solid process, there are common challenges that can trip you up. Here are some common issues and practical ways to handle them:
Not Accounting for All Costs
It’s easy to focus only on direct costs, like raw materials, and forget about overhead expenses, like salaries or utilities. This leads to inaccurate gross margin calculations.
How to Fix It: Always include all relevant costs in your COGS to get the full picture of your profitability.
Overreacting to Short-Term Changes
One bad quarter doesn’t mean you need to overhaul your pricing or slash expenses. Quick fixes can sometimes do more harm than good.
How to Fix It: Look at margin trends over several periods. Patterns over time are more reliable than short-term results.
Misusing Industry Benchmarks
It’s tempting to compare your margins to industry averages, but this can be misleading if your product mix or customer base is different.
How to Fix It: Focus on how your margins compare to past performance. Your trends tell you more than generic benchmarks.
Ignoring Segment-Level Margins
Looking only at your overall margins might hide underperforming products, regions, or customers.
How to Fix It: Break down margins by product, customer, or region. This helps you spot areas to fix—or expand on what’s working
Turning Margin Analysis Insights Into Results
Analyzing margins is only useful if you take action. Use what you learn to adjust pricing, cut costs, and focus on what’s working. Even small changes – like slightly raising prices or cutting waste – can lead to big gains over time. Consistently improving margins keeps your business competitive and profitable.
The right tools make the process easier and more effective. Violeta, a leading FMCG company, used Farseer to automate budgeting and forecasting. This gave them better visibility into margins and helped them make faster, smarter decisions.
Margin analysis is about using insights to drive real, measurable results. Start small, stay consistent, and watch your profitability grow.
Read more: The CFO’s Guide to Profitability Analysis Software (+Tool Recommendations)


A Complete Guide to Financial Statement Analysis for Strategy Makers
Read more
Best Financial Analysis Tools in 2026: Compare Features & Pricing
Read more