How to Do a Profitability Analysis That Actually Improves Your Bottom Line

Profitability analysis shows you what’s really making you money, and what’s just eating up resources. Too many companies chase revenue without realizing that some products, customers, or regions barely break even (or worse, lose money).
Finance teams can’t just look at top-line growth. You need to find the real profit drivers, fix bad pricing, and stop wasting resources on low-margin business.
Read: A Complete Guide to Financial Statement Analysis for Strategy Makers
This guide will show you how to analyze profitability the right way, where companies go wrong, and how to make smarter, data-backed decisions that actually improve the bottom line.
What Is Profitability Analysis and Why It Matters for FP&A?
Revenue doesn’t equal profit. Some products, customers, or regions bring in a lot of money but barely cover costs. FP&A teams need to know where the business actually makes money, and where it doesn’t.
Profitability Analysis Definition
Profitability analysis helps FP&A teams cut through misleading revenue figures and focus on actual profit drivers. A product with high sales might have razor-thin margins due to production and distribution costs, while a large customer might demand discounts and extensive service that eat into profitability.
FP&A teams use profitability analysis to:
- Fix pricing issues that hurt margins.
- Prioritize customers based on true profitability, not just revenue.
- Optimize resource allocation by focusing on high-margin products and services.
Profitability ratios are key to profitability analysis, helping measure financial performance at different levels.
The CFO’s Guide to Profitability Analysis Software (+Tool Recommendations)
Read moreWhy FP&A Needs Profitability Analysis
FP&A goes beyond tracking profit—it’s about increasing profitability. Many companies assume that high-revenue products and big customers drive the most profit. But when you factor in production costs, discounts, and service expenses, some of them barely break even.
Example: A retailer sees strong sales in multiple locations but realizes expensive leases are killing profit. Instead of just chasing revenue, they renegotiate leases or move to better locations.
Profitability analysis helps FP&A teams spot these issues before they hurt the bottom line. It shows where to adjust pricing, cut unnecessary costs, and shift resources to high-margin products or customers. Without it, companies risk wasting time and money in the wrong places.
Profitability analysis ensures finance teams track real performance, not just projections. See how in our budget vs. actual analysis guide.
Four Key Types of Profitability Analysis for FP&A
Some products, customers, markets, or sales channels generate strong margins, while others barely break even. FP&A teams need to break profitability down into four key dimensions.
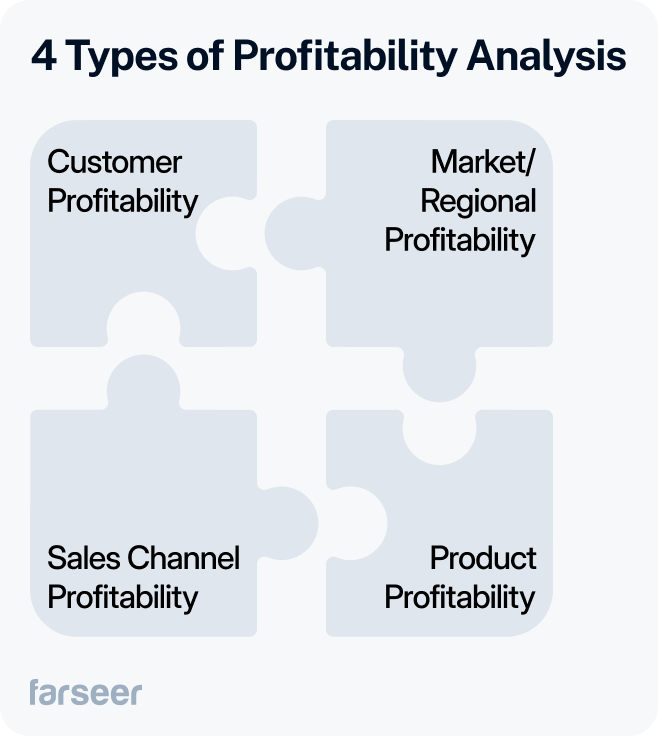
Product Profitability
Not all high-selling products are profitable. Some carry hidden costs, high production expenses, expensive distribution, or excessive service requirements that eat into margins. FP&A teams need to track profit per unit, not just revenue per unit, to make better pricing and product decisions.
Example: A home appliance manufacturer realizes that entry-level products require frequent repairs, eating into margins. Instead of chasing volume, they shift marketing toward higher-margin premium models, improving overall profitability.
Understanding these cost dynamics is key, and margin analysis helps finance teams assess product profitability more accurately.
Customer Profitability
Some customers look great on paper but barely make you money. Discounts, special service, or slow payments eat into margins, and finance teams need to track profit per customer, not just revenue.
Example: A food distributor supplies major supermarket chains with big orders. But those chains demand deep discounts and bulk rebates, creating extra expenses and squeezing profits. The company adjusts pricing to charge more for high-maintenance accounts and focuses on customers who pay faster.
Such large and slow-paying customers hurt profitability just as much as low-margin ones. Tracking how fast money moves through the business is key as well. Learn more in our cash conversion cycle guide.
Market/Regional Profitability
Some regions drive strong sales but struggle with profitability due to high costs, tax structures, or operational inefficiencies. FP&A teams need to analyze profit per location, not just revenue, to decide where to expand or cut back.
Example: A fashion retailer expands into a new market but struggles with slow inventory turnover and delayed customer payments. A comparative balance sheet analysis reveals rising inventory and receivables, signaling cash flow problems. The company adjusts inventory and credit policies to fix the issue.
Sales Channel Profitability
Not all sales channels are equally profitable. Some bring high revenue but come with steep commission fees, logistics costs, or slow payments. FP&A teams need to compare direct vs. indirect sales to see where margins are strongest.
Example: An industrial supplier sells through distributors and direct B2B channels. While distributors drive volume, their fees and long payment terms cut into profits. The company shifts focus to direct e-commerce, improving margins and cash flow.
Learn how to assess financial health across sales channels in our liquidity and solvency ratios guide.
How to Conduct a Profitability Analysis
A structured profitability analysis helps go beyond surface-level revenue tracking and pinpoint what’s actually driving profit.
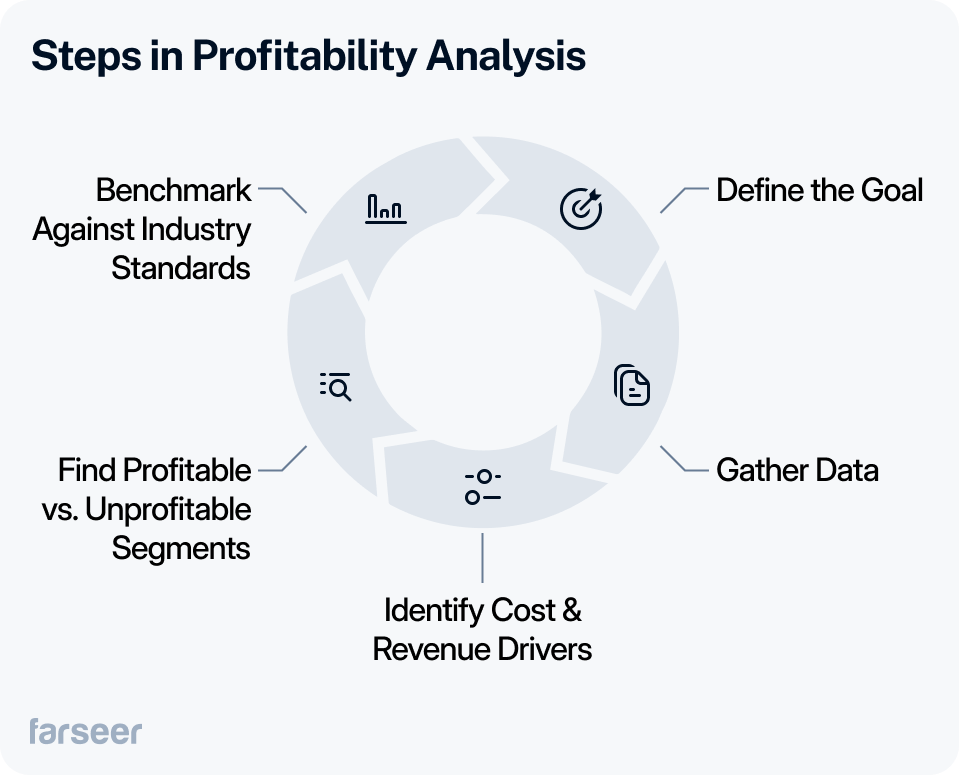
Step 1: Define the Goal
A profitability analysis is only useful if it’s tied to a clear business goal. Are you trying to fix pricing issues, cut costs, or optimize resource allocation? The objective determines what data you need and how you interpret the results.
Example: A logistics company notices that some customers request premium service but pay late, creating both extra expenses as well as cash flow issues. The goal of the analysis is to identify unprofitable accounts and adjust pricing or payment terms.
A structured variance analysis helps finance teams track profitability shifts over time.
Step 2: Gather Data
A profitability analysis is only as good as the data behind it. Finance teams need both financial and operational data to see the full picture.
- Financial data: P&L statements, balance sheets, cost breakdowns
- Operational data: Logistics costs, fulfillment expenses, service costs
Example: A manufacturer struggling with shrinking margins digs into logistics data and finds that rising shipping costs are eroding profits. By renegotiating freight contracts, they recover lost margin.
Accurate financial reporting is key. Learn how to structure statements in our income statement guide.
Step 3: Identify Cost & Revenue Drivers
To understand profitability, finance teams need to break down revenue and costs at a granular level.
- Revenue segmentation: Analyze sales by product, region, and customer.
- Cost breakdown: Identify direct costs (materials, labor) and indirect costs (logistics, marketing, overhead).
- Common mistake: Allocating overhead costs evenly instead of based on actual usage.
- Better approach: Use activity-based costing (ABC) to assign costs more accurately.
Example: A distributor realizes its biggest customer is barely profitable due to high fulfillment costs. By adjusting service fees, they restore margin without losing business.
Profitability shifts as cost structures change, making it essential to track cost-volume-profit relationships. Learn more in our cost-volume-profit analysis guide.
Step 4: Find Profitable vs. Unprofitable Segments
Revenue alone doesn’t tell the full story. Some customers, products, or markets look profitable on paper but barely break even after costs. You need to dig into cost structures to see which segments actually contribute to the bottom line.
Example: A chemical manufacturer realizes that small distributors require frequent reorders and higher service costs, while industrial clients place larger, stable orders with better margins. The company prioritizes industrial clients to improve profitability.
Tracking profitability at the account level helps finance teams catch hidden inefficiencies. Learn more in our account analysis guide.
Step 5: Benchmark Against Industry Standards
Comparing performance to industry benchmarks reveals profit margin gaps and areas for improvement.
Example: A logistics company realizes its transport costs are higher than competitors. By optimizing delivery routes and cutting fuel expenses, it boosts profitability.
Comparing against industry standards helps set realistic goals.
How Farseer Automates Profitability Tracking
Tracking profitability across products, customers, and business units is slow and unreliable with spreadsheets. Farseer automates this process, giving FP&A teams a real-time view of margins and making profitability analysis faster and more accurate.
Violeta, a leading hygiene products manufacturer, struggled with manual cost allocation and tracking SKU profitability across multiple markets. With Farseer, they automated cost distribution, pinpointed low-margin products, and optimized pricing strategies. This helped them increase profitability without increasing workload.

Farseer connects financial data across the organization, removing manual errors and hours (and even days) spent on reporting. Teams can model different scenarios, adjust pricing based on profitability insights, and focus resources on high-margin products.
If you’d like to see how Farseer helps companies like Violeta track and improve profitability in real time, book a demo, and learn more about automating your profitability analysis.
Key Takeaways
- Revenue doesn’t equal profit – high sales don’t always mean strong margins.
- Breaking down profitability by product, customer, region, and channel reveals where the business actually makes money.
- Cost structure matters – hidden expenses like logistics, service, and overhead can turn a profitable segment into a loss.
- Data-driven decisions improve pricing, cost allocation, and resource focus.
- Automation simplifies profitability tracking – tools like Farseer help businesses eliminate manual errors and optimize profitability in real time.


Financial Statement Analysis: The Complete Guide (With Step-by-Step Process)
Read more
Best Financial Analysis Tools in 2026: Compare Features & Pricing
Read more