How to Perform Account Analysis: A Step-by-Step Guide for FP&A Teams

Account analysis is one of the most practical tools in the FP&A toolkit. It provides the verified, trend-rich view of individual account activity that makes budgets more accurate, forecasts more reliable, and variance explanations more credible. Most often performed by accountants and FP&A analysts together, account analysis bridges the accuracy verification done in accounting and the forward-looking planning done in FP&A.
This guide covers what account analysis is, how it relates to account reconciliation, the step-by-step process for performing it, the key account types to analyse, and the use cases where it creates the most value.
Read more: Strategic Financial Planning That Actually Drives Results
What Is Account Analysis and Why Does It Matter?
Account analysis is the process of reviewing and examining individual general ledger accounts to identify trends, spot errors, investigate variances, and support financial planning decisions. An account is a category used to record specific types of financial transactions. Revenue accounts track income streams. Expense accounts track costs. Asset and liability accounts track what the company owns and owes.
Account analysis is typically performed monthly, quarterly, or at the end of the fiscal year. Its primary purposes are to maintain accurate financial records, identify any discrepancies before they affect reporting, ensure compliance with financial regulations, and provide the data foundation for budgeting and forecasting.
The distinction from financial statement analysis is one of granularity. Financial statement analysis reviews the three summary statements (P&L, balance sheet, cash flow). Account analysis goes one level deeper, into the individual accounts that aggregate into those statements, allowing the analyst to identify exactly which cost centre, product line, or transaction type is driving a summary movement.
Account Analysis vs Account Reconciliation: Understanding the Relationship
These two terms are closely related and often used interchangeably, but they serve different purposes in the financial close and planning cycle.
Account reconciliation is the verification layer. It confirms that the balance in a specific account is correct by comparing internal records against an external source or secondary ledger. Bank reconciliation compares the general ledger cash balance against the bank statement. Vendor reconciliation compares accounts payable balances against supplier statements. The question reconciliation answers is: is this balance correct?
Account analysis is the analytical layer. It takes the verified account balances produced by reconciliation and examines them for trends, patterns, variances, and implications for planning. The question it answers is: what does this balance tell us about the business and what should we do next?
In practice, account analysis cannot produce reliable insights without the reconciliation layer beneath it. A trend that appears in unreconciled data may reflect a data error rather than a real business change. This is why the two are best understood as two sequential steps in the same financial review process.
Chart of Accounts (COA)
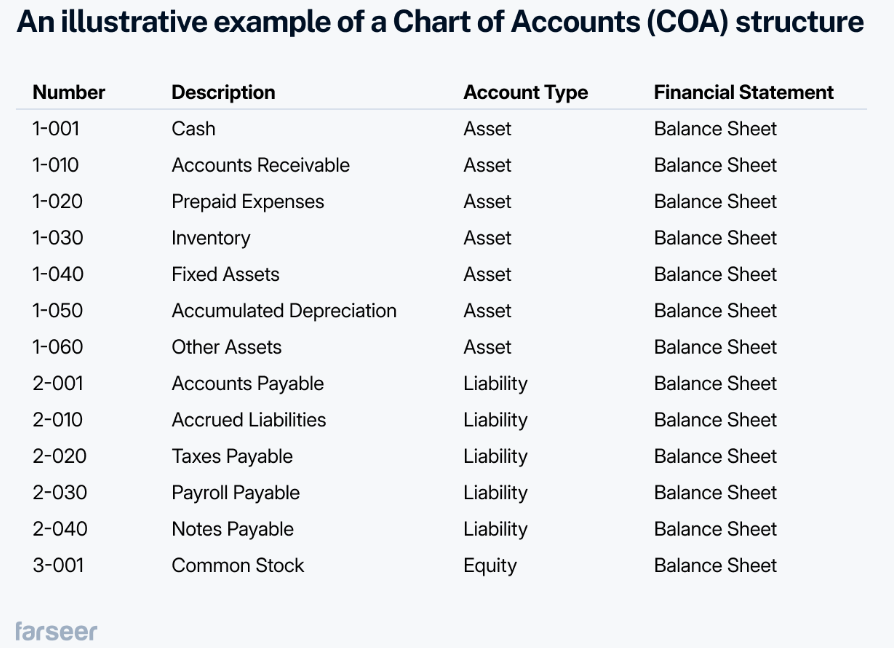
All companies organise their finances using a Chart of Accounts (COA), a master list that categorises financial transactions into sections like revenue, expenses, liabilities, and assets. This structure keeps financial data organised and allows analysts to investigate individual account activity within the broader financial statements.
International standards including IFRS and GAAP regulate COA structure, and many jurisdictions have their own additional requirements. In account analysis, balance sheet accounts require particular attention because they carry forward balances from one period to the next. Poor maintenance of balance sheet accounts compounds over time and can cause material errors in financial reports.
A typical COA uses numeric ranges to categorise accounts: assets in the 1000 range, liabilities in the 2000 range, equity in the 3000 range, revenue in the 4000 range, and expenses in the 5000 range. Understanding this structure is the prerequisite for navigating account analysis effectively.
Key Accounts to Analyse
Revenue Accounts (4000 range)
Revenue accounts track all income streams: sales revenue, service income, licensing fees, and other sources. They are typically numbered in the 4000 range (e.g., 4000 for sales revenue, 4100 for service income).
Analysing revenue accounts reveals sales patterns, seasonal spikes, and declines across periods. This is particularly important because different revenue types follow different timing patterns. A software company charging annual subscriptions spreads income recognition across months; a retailer records revenue at the point of sale. Understanding the timing of revenue recognition is critical for cash flow management and for building accurate rolling forecasts.
Expense Accounts (5000 range)
Expense accounts track all business costs and are typically numbered in the 5000 range (e.g., 5000 for COGS, 5100 for salaries and wages). They show where the business is spending money and in what proportions.
A critical distinction in expense account analysis is between fixed costs (rent, insurance, base salaries) and variable costs (raw materials, commissions, shipping). Fixed costs are predictable and easier to budget. Variable costs fluctuate with business activity and directly affect profit margins. Identifying which expense accounts are variable enables more accurate flexible budgeting and scenario planning.
Read: Cost-Volume-Profit (CVP) Analysis Explained (With Formula & Examples)
Liability Accounts (2000 range)
Liability accounts track what the company owes. Current liabilities (accounts payable, accrued expenses, short-term debt) and non-current liabilities (long-term loans, bonds payable) are typically in the 2000 range.
Tracking liability accounts is important for debt management, cash flow planning, and covenant compliance. When liabilities grow faster than assets or revenue, it is an early warning signal that the capital structure is under pressure. Accounts payable analysis specifically reveals whether the company is managing its payment terms effectively or beginning to stretch suppliers.
Asset Accounts (1000 range)
Asset accounts track what the company owns: cash, accounts receivable, inventory, property, and equipment. They are typically in the 1000 range.
Analysing asset accounts helps ensure resources are being used efficiently. A rising accounts receivable balance may indicate that customers are paying more slowly, with cash flow implications. Growing inventory relative to sales may indicate overproduction or weakening demand. Depreciation analysis is also important here: accumulated depreciation reduces asset values over time and must be reviewed regularly to ensure asset values in the financial reports are accurate.
The Account Reconciliation Process
For account analysis to produce reliable insights, the accounts being analysed must first be reconciled. The reconciliation process verifies that each account balance is correct before it is used as the basis for trend analysis or planning.
Step 1: Collect internal and external records. Pull the general ledger account balance alongside the external source it should match: bank statement for cash accounts, vendor statements for accounts payable, customer statements for accounts receivable, or subsidiary ledgers for intercompany accounts.
Step 2: Match transactions. Compare each transaction in the internal records to the corresponding entry in the external source. Automated reconciliation tools handle this matching, flagging transactions that match exactly and those where one entry corresponds to multiple transactions, such as a single payment batch covering multiple invoices
Step 3: Identify discrepancies. Items that do not match are flagged as exceptions. Common causes include timing differences (a payment recorded internally but not yet cleared externally), data entry errors (transposition or missing entry), and genuine discrepancies that require investigation.
Step 4: Investigate and resolve. For each exception, identify the root cause. Timing differences require no adjustment and will self-resolve when the transaction clears. Errors require correcting journal entries. Unexplained discrepancies that cannot be attributed to timing or error require escalation and may indicate control failures or fraud.
Step 5: Document and sign off. Record the reconciliation outcome, the adjustments made, and the approving reviewer. This documentation is part of the audit trail required for regulatory compliance and forms the foundation for the account analysis step that follows.
Key Reconciliation Types
| Type | What is compared | Primary purpose |
| Bank reconciliation | General ledger cash balance vs bank statement | Verify cash position; detect timing differences and unauthorised transactions |
| Vendor reconciliation | Accounts payable ledger vs supplier statements | Confirm all supplier invoices are recorded; identify and resolve disputes |
| Customer reconciliation | Accounts receivable ledger vs customer statements | Verify outstanding receivables; identify disputed or unpaid invoices |
| Intercompany reconciliation | Transactions between subsidiaries or divisions | Ensure consistency before group consolidation; eliminate intercompany balances |
| Inventory reconciliation | Inventory ledger vs physical stock count | Verify stock levels; detect shrinkage, waste, or recording errors |
How to Perform Account Analysis: A 5-Step Process
Step 1: Gather the Right Financial Data
Collect all relevant financial data for the accounts being analysed. Primary sources include trial balances, income statements, and balance sheets. The data must be complete, accurate, and reconciled before the analysis begins. Analysis built on unverified data produces unreliable insights.
Companies like Unilever use ERP systems to collect and consolidate financial data from multiple divisions, generating trial balances and financial reports across periods. The data infrastructure that makes this fast and reliable is the foundation of effective account analysis.
Step 2: Reconcile the Accounts
Before analysing trends or variances, verify that each account balance is correct. Follow the five-step reconciliation process described above. Any unreconciled differences should be resolved before proceeding. An analysis that identifies a trend in unreconciled data may be tracking a data error, not a real business change.
Step 3: Identify Variances and Trends
With reconciled account balances in hand, compare balances across periods: monthly, quarterly, and year-over-year. Apply horizontal analysis to calculate the absolute change and percentage change for each key account. Apply vertical analysis to express account balances as a percentage of revenue or total assets, enabling structural comparison across periods.
Look for accounts that are moving significantly faster than revenue, accounts that are trending in an unexpected direction, and accounts where the period-over-period pattern breaks from historical norms. Any of these signal that closer investigation is warranted.
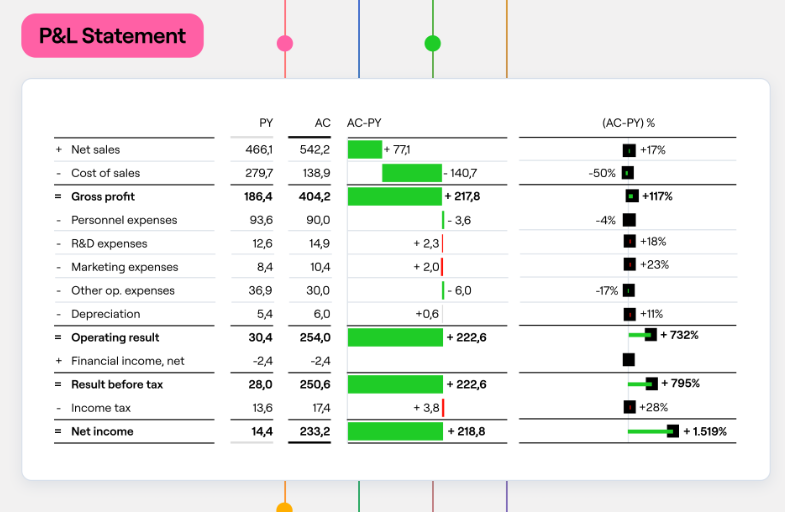
Example: An FMCG company conducting a quarterly account review notices that operating expenses have increased significantly. Further examination of the individual expense accounts within that category reveals that transportation costs have risen sharply, while all other operating cost accounts are tracking normally. The variance is concentrated and identifiable because the analysis worked at the account level, not the summary level.
Step 4: Investigate the Root Cause
Use variance analysis, the DERP framework, and the 5 Why Technique to investigate any significant discrepancies. A material movement in an account balance without an identified cause requires investigation before the next planning cycle. The investigation should identify whether the movement is a one-time event (a non-recurring charge or exceptional payment), a timing difference (costs recognised in the wrong period), or a structural change in the business (a trend that requires a response).
Example: The FMCG company’s transportation cost analysis reveals that three logistics suppliers increased rates simultaneously following a fuel cost spike. This structural increase requires both a budget adjustment for the current year and a revised cost assumption for the rolling forecast. The investigation converts a variance observation into an actionable planning input.
Step 5: Apply Insights to Budget and Forecast
The final step converts account analysis from a reporting exercise into a planning tool. Compare actual account performance against budget to identify where the original assumptions were off. Update rolling forecast assumptions to reflect the trends confirmed by the analysis. Revise budget assumptions where recurring patterns justify a structural change rather than a one-off adjustment.
When consistent patterns emerge across multiple account review cycles, such as transportation costs consistently running above budget, receivables days stretching beyond plan, and inventory turnover lower than forecast, those patterns become the basis for more accurate forward assumptions. Account analysis that feeds directly into the planning model is what makes forecasts progressively more reliable over time.
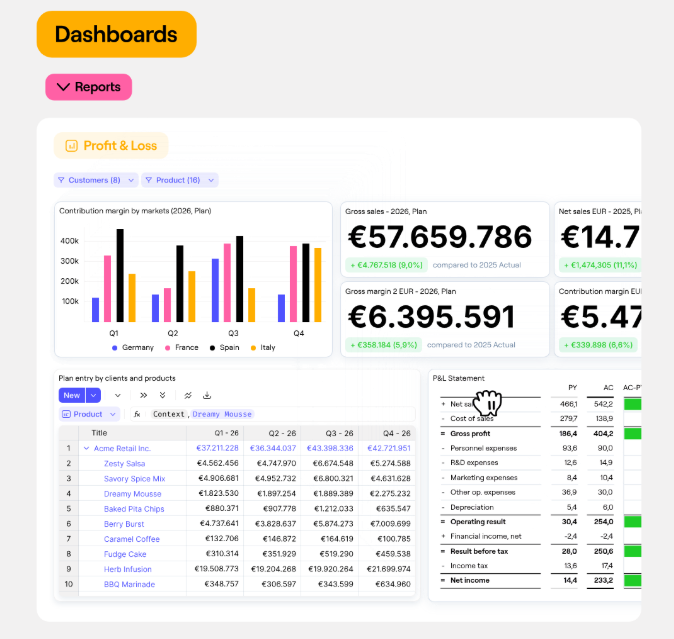
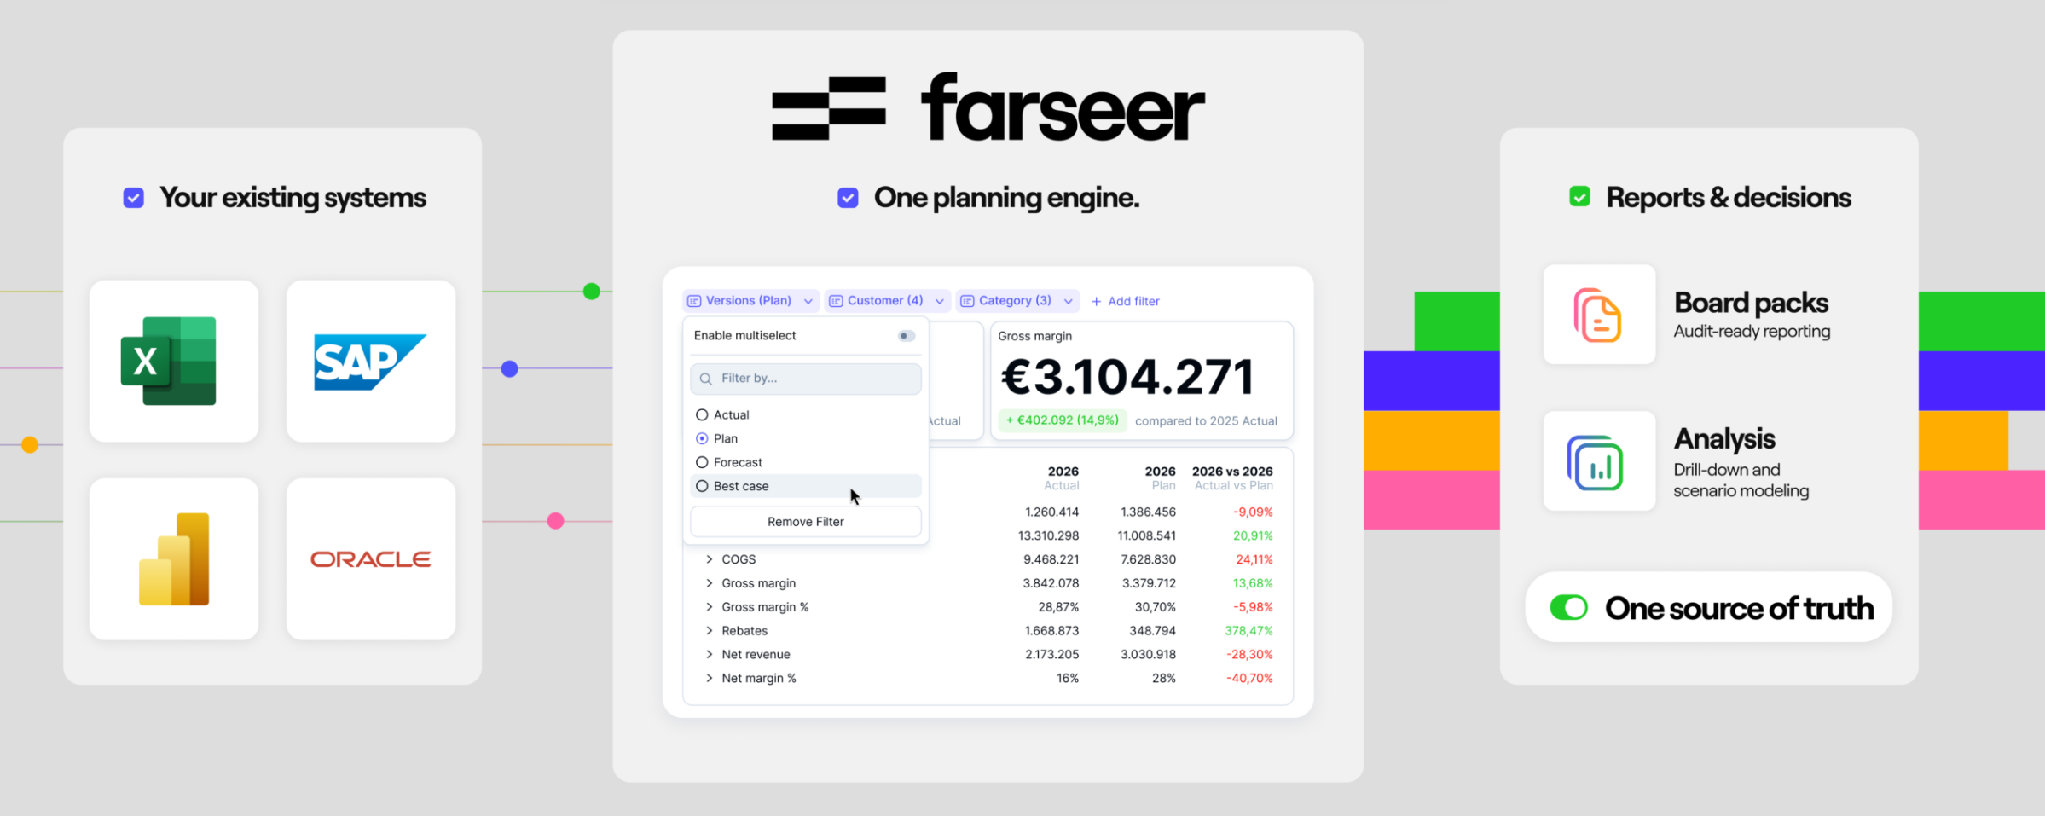
Farseer: Account analysis produces its best results when the data it works from is already clean, consolidated, and consistent across periods. In practice, most finance teams spend the bulk of their account analysis time assembling and verifying data rather than interpreting it. Farseer connects directly to ERP systems and maintains a consistent chart of accounts across periods, so account balances are consolidated and ready for analysis as soon as the period closes. Finance teams can drill from a summary P&L view down to individual account transactions without manual extraction. The time saved on data assembly is redirected to variance investigation and forecasting, the steps where account analysis creates the most value. Explore Farseer’s financial reporting and analysis capabilities at farseer.com.
Where Account Analysis Is Used
Budget Monitoring
Regular account analysis confirms whether actual spending and revenue are tracking against budget. By reviewing individual accounts rather than summary lines, finance teams identify exactly where variances are occurring before they compound. A marketing budget that is running 15% over plan looks different when account analysis reveals it is concentrated in one campaign rather than spread across all spend.
Fraud Detection
Systematic account analysis is one of the most effective controls for detecting unauthorized transactions, duplicate payments, and mis-posting. When account balances are compared against expected ranges and prior period patterns, transactions that fall outside normal parameters surface quickly. Inventory reconciliation in particular is a standard tool for detecting shrinkage and misappropriation.
Cash Flow Management
Accounts receivable and accounts payable analysis provides the granular visibility needed for accurate cash flow forecasting. Tracking which customer accounts have ageing receivables, which suppliers are being paid outside agreed terms, and how the cash conversion cycle is evolving across periods informs both short-term cash management and medium-term funding decisions.
Performance Evaluation
Account-level data connects operational performance to financial outcomes. Revenue account analysis by product line, region, or channel reveals where growth is happening and where it is not. Expense account analysis by cost centre identifies which parts of the business are operating efficiently and which are consuming disproportionate resources. This granularity is what makes account analysis more actionable than summary statement review alone.
Regulatory Compliance
Accurate, reconciled account balances are the foundation of financial statement accuracy and regulatory compliance. Tax filings, audit submissions, and lender reporting all depend on account balances that are current and verified. Regular account analysis ensures that discrepancies are caught and corrected before they reach external reports rather than after.
Account Analysis vs Other Financial Analysis Methods
| Method | Focus | Direction | Output |
| Account analysis | Individual accounts in depth | Vertical (within a single account across transactions) | Trend identification, error detection, planning input |
| Horizontal analysis | Full financial statement line items | Horizontal (same item, multiple periods) | Period-over-period change in dollar and percentage terms |
| Vertical analysis | Full financial statement structure | Vertical (all items as % of a base figure) | Cost structure and composition as a proportion of revenue or assets |
| Ratio analysis | Relationships between accounts | Derived (calculated from multiple line items) | Standardised performance benchmarks comparable across companies |
Account analysis works best when combined with horizontal analysis (to provide the period-over-period context for account movements) and vertical analysis (to confirm whether account balances are proportionally in line with overall business activity). Together they give both the detailed and the structural view that variance investigation requires.
Conclusion
Account analysis is the bridge between the accuracy of accounting and the forward-looking work of FP&A. By systematically reviewing individual account balances, investigating variances, and applying the insights to budgets and forecasts, finance teams build a planning process that improves consistently over time rather than repeating the same forecast errors each cycle.
The reconciliation step is not optional. Account analysis built on unverified data produces unreliable conclusions. The process works when reconciliation provides clean, trusted account data that analysis then converts into insight, and when that insight flows directly into the planning model rather than sitting in a standalone report. Farseer: Account analysis is only as valuable as what it connects to. Identifying a trend in operating expenses or a pattern in receivables timing creates value only when that insight flows into an updated forecast, a revised budget assumption, or a management decision. Farseer connects account-level analysis directly to the planning and forecasting model: a trend identified in account data updates the rolling forecast driver, a variance in accounts payable informs cash flow projections, and scenario analysis runs against the current account position rather than a month-old snapshot. If your team conducts account analysis separately from its planning process, Farseer provides the infrastructure to close that gap. Explore the platform at farseer.com.

FAQ
What is account analysis in finance?
Account analysis is the process of reviewing and examining individual general ledger accounts to identify errors, track trends, investigate variances, and support better financial planning decisions. It provides the granular, account-level insight that summarises financial statement analysis into actionable inputs for budgeting and forecasting.
What is the difference between account reconciliation and account analysis?
Account reconciliation verifies that account balances are correct by comparing internal records against external sources (bank statements, supplier invoices, subsidiary ledgers). Account analysis takes those verified balances and examines them for trends, variances, and planning implications. Reconciliation produces accurate data. Account analysis produces insight from that data. Both are needed and they work in sequence: analysis built on unreconciled data may track errors rather than real business trends.
Why is account analysis important for businesses?
Account analysis helps companies detect discrepancies early, control costs, monitor financial performance at a granular level, ensure compliance, improve budgeting accuracy, and provide verified data for forecasting. By catching errors and trends at the individual account level, finance teams identify issues before they affect summary financial statements or external reports.
What are the key accounts analysed during account analysis?
The most commonly analysed accounts are revenue accounts (income from sales and services), expense accounts (COGS, salaries, operating costs), liability accounts (accounts payable, loans, accrued expenses), and asset accounts (cash, accounts receivable, inventory, property and equipment). Balance sheet accounts require particular attention because they carry forward balances between periods.
How often should accounts be reconciled and analysed?
High-risk accounts such as cash, accounts receivable, and accounts payable should be reconciled monthly at a minimum. Analysis frequency depends on planning cadence: monthly for operational accounts that directly influence budgets and forecasts, quarterly for longer-cycle items such as depreciation schedules or long-term debt positions. Annual reviews are a minimum; monthly or quarterly cycles are best practice for organisations that use account analysis as a planning input.
How does account analysis improve budgeting and forecasting?
By identifying trends and variances in individual accounts, finance teams can adjust budgets more accurately, improve future forecasts, and better anticipate changes in costs, revenue, and operational performance. When consistent patterns emerge across multiple review cycles, such as transportation costs consistently above budget or receivables days stretching, those patterns become more reliable forward assumptions than point-in-time estimates.
What is the difference between account analysis, horizontal analysis, and vertical analysis?
Account analysis focuses on individual accounts in depth, examining specific transactions and balances within a single account. Horizontal analysis compares financial performance across multiple periods at the statement level. Vertical analysis examines financial statement items as percentages of a base figure like revenue or total assets. Account analysis provides the granular detail; horizontal and vertical analysis provide the structural and temporal context. All three are used together for comprehensive financial review.

Financial Statement Analysis: The Complete Guide (With Step-by-Step Process)
Read more
Best Financial Analysis Tools in 2026: Compare Features & Pricing
Read more