Horizontal analysis is an essential tool for making sense of financial trends. By tracking changes across periods, this method helps businesses spot patterns and make informed decisions.
From monitoring growth to managing costs, horizontal analysis gives you the insights needed to stay ahead and plan for what’s next. Ready to see how it can benefit your business? Let’s get started!
Related: A Complete Guide to Financial Statement Analysis for Strategy Makers
What is Horizontal Analysis?
Horizontal analysis is a method of financial statement analysis used to compare statement items (or financial ratios) across multiple periods. It tracks either growth or decline over time. It’s called “horizontal” because the data in financial statements is laid out, and compared side by side, or horizontally.
Changes in time can be tracked using absolute (currency) amounts, or percentages.
Each period is compared to a year you choose as a baseline to see how revenue, expenses or profits have evolved.
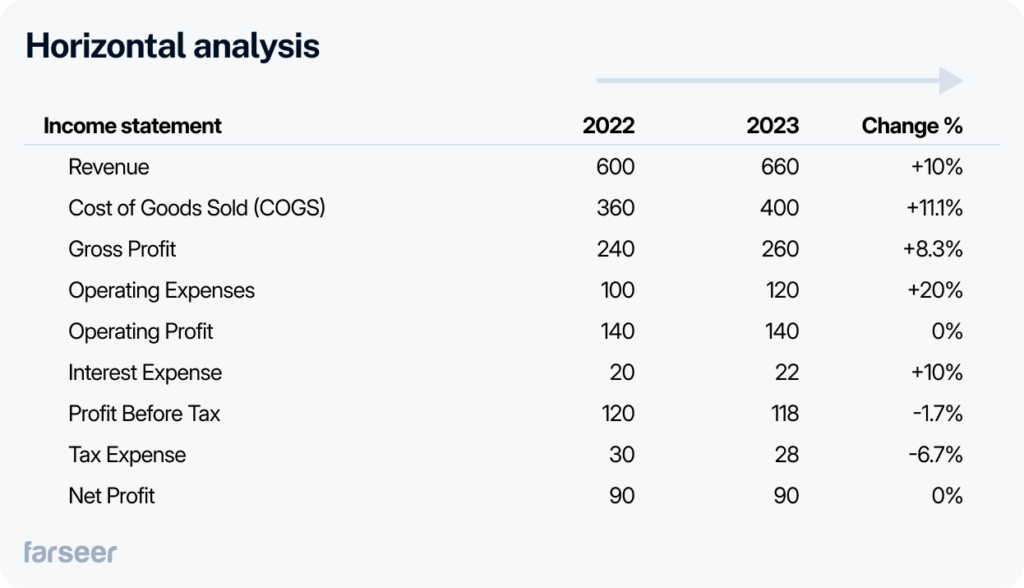
So, if a company’s revenue increased from $600,000 in 2022 to $660,000 in one year, horizontal analysis would show a 10% growth. Similarly, if the company’s COGS went from $360,000 to $400,000, that’s an 11.1% increase. Horizontal analysis is most commonly used on income (P&L) statements and balance sheets. You can use it with cash flow statements, although that’s not common, because cash flows fluctuate more, and show less consistent long-term trends than P&L and balance sheets.
Horizontal analysis is especially useful in manufacturing, retail, and technology, simply because tracking revenue growth, cost control, and profitability in those industries over time is key. It’s also useful in industries with seasonal patterns (consumer goods, hospitality, etc).
When data is simplified into clear side-by-side comparisons, businesses can find trends and make informed decisions easier.
How Horizontal Analysis Works
Let’s go about this step by step, using a hypothetical ACME Inc company as an example:
1. Collect Data
Start by gathering financial data for periods you want to compare. It can be revenue, COGS, expenses or any other financial ratio you want to track. This way, you’ll get a snapshot of the company’s performance over time, and will be able to compare them.
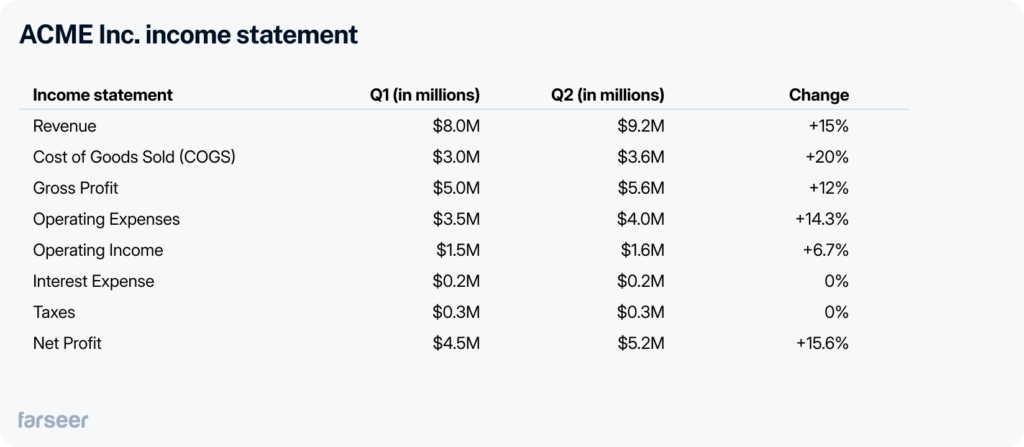
Let’s say you’re an FP&A analyst in ACME Inc., and you know that its revenue in Q1 was $8 million, and it increased to $9.2 million in Q2. Operating expenses rose from $3.5 million to $4 million during the same period.
2. Calculate Changes
When you have the data, calculate the percentage or absolute changes between the periods. This way, you can quantify how much a line item or a ratio grew or declined, and track its performance.
ACME’s numbers from the previous step obviously grew. Revenue rose by 15%, and operating expenses increased by 14.3%. Comparing these two helps you figure out if revenue growth can keep up with rising costs.
3. Interpret Results
The final (and the most important) step is making sense of the changes. Costs rising faster than revenue may be a red flag that you’ll want to address. Consistent growth, on the other hand, probably means your company is doing something right.
In ACME’s case, revenue grew, but so did the operating expenses. This means that, as an FP&A analyst, you probably want to suggest tighter cost control to decision makers to keep the profitability in check.
By following these steps, horizontal analysis enables businesses to track performance trends over time and make data-driven decisions.
Key Use Cases of Horizontal Analysis
Here are some areas where horizontal analysis is especially useful:
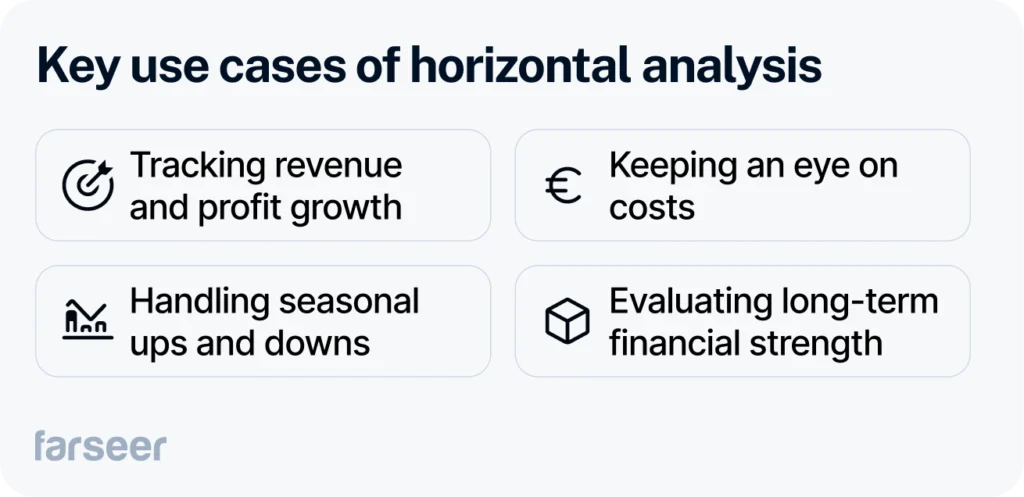
Tracking Revenue and Profit Growth
This is the most common use of horizontal analysis. A retailer might look at their year-over-year sales looking for significant long-term trends and make sure that the profits grow together with revenue.
Keeping An Eye on Costs
Comparing costs like COGS and operating expenses across periods and finding what could be more efficient is also a common use case for horizontal analysis. A manufacturer might notice that its expenses are rising faster than its sales, and closely look at cost control.
Handling Seasonal Ups and Downs
For companies with strong seasonality effects, like FMCG or tourism, horizontal analysis is very useful for comparing peak and off-peak performance. For example, a hotel chain could focus at summer sales to better plan staffing and inventory.
Evaluating Long-Term Financial Strength
Keeping the business strong over time, and keeping an eye on financial stability is an important use case for horizontal analysis. A tech company might track its profit margins or debt levels to make sure it’s on the right financial track.
Horizontal Analysis vs. Vertical Analysis
Vertical analysis and horizontal analysis complement each other, but they focus on different aspects of financial performance.
Horizontal analysis compares financial data over multiple periods, and track changes in revenue, expenses, and profit. It identifies trends and is especially useful for spotting long-term patterns or seasonal variations.
Vertical analysis focuses on a single period and expresses each line item as a percentage of a base figure, such as total revenue or assets. It’s great for assessing cost structures or understanding how individual components contribute to overall performance within one period.
When to Use Horizontal and Vertical Analysis?
Use horizontal analysis to track changes over time, like how your revenue or costs are growing.
Use vertical analysis to see how your costs and revenue break down in a single period or compare them to competitors.
When used together, both methods provide a more detailed view of a company’s financial health. It’s best to combine them with financial ratios for a deeper analysis.
Pros and Cons of Horizontal Analysis
Horizontal analysis is a useful tool, but like any method, it has its pros and cons.
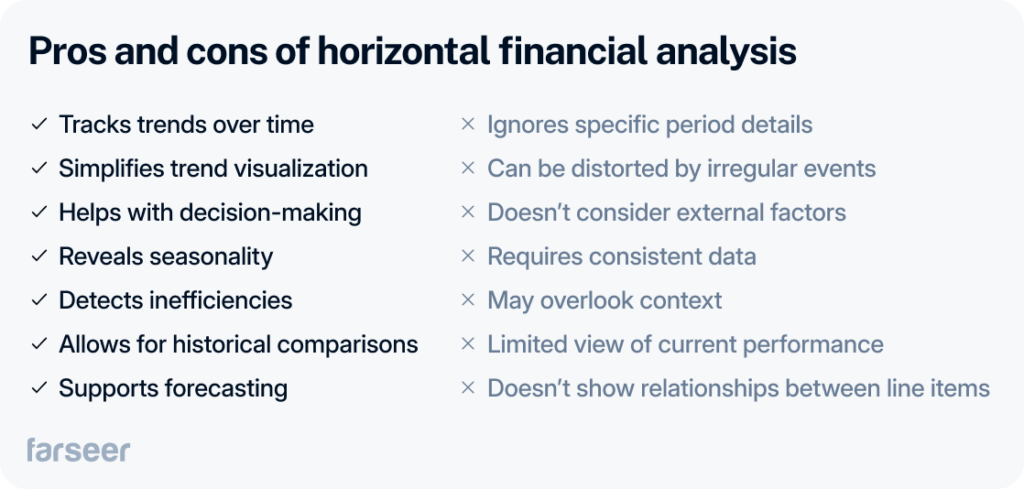
Pros of Horizontal Analysis
- Tracks trends over time: It helps find long-term trends in revenue, expenses, and profits, allowing businesses to spot growth patterns or fluctuations.
- Simplifies trend visualization: Provides an easy way to see changes across periods, and makes it simple to spot anomalies or consistent growth.
- Helps with decision-making: By comparing performance across periods, managers can make informed decisions about cost control, pricing, and resource allocation.
- Reveals seasonality: It’s valuable for identifying seasonal trends, showing how performance changes between peak and off-peak periods.
- Detects inefficiencies: It highlights whether costs are rising faster than revenue, signaling areas for potential cost control.
- Allows for historical comparisons: Companies can use it to benchmark current performance against past results, tracking multi-year growth.
- Supports forecasting: Past trends help businesses forecast future performance, aiding in growth planning and cost management.
Cons of Horizontal Analysis
- Ignores specific period details: Focusing on trends over time can miss critical short-term details within a single period.
- Can be distorted by irregular events: One-time events, such as asset sales or unusual expenses, can distort trends and lead to inaccurate conclusions.
- Doesn’t consider external factors: It doesn’t account for inflation, currency changes, or other economic factors that may distort the analysis.
- Requires consistent data: It depends on accurate data over time. Changes in accounting methods or one-time events can skew results.
- May overlook context: It focuses on trends but might miss the internal or external factors driving those trends.
- Limited view of current performance: It may not capture important details about current operations.
- Doesn’t show relationships between line items: It doesn’t illustrate how different financial items, like revenue and expenses, interact within a single period.
How to Use Horizontal Financial Analysis in Practice
Horizontal analysis helps track trends and make better decisions. Here’s how to make practical use of it.
Automating Horizontal Analysis with FP&A Tools
Once you have financial data from different periods, the tricky part is organizing and comparing it. Luckily, modern FP&A tools make this easier. They automate collecting data and comparisons for multiple periods. They also help you see trends in real-time, and make it faster to spot changes and make crucial decisions.
Example:
Violeta, a hygiene products company, used FP&A software to automate its financial analysis. With real-time dashboards, they could track costs instantly and make better decisions.
Using Horizontal Analysis for Forecasting
By its nature, horizontal analysis is useful to forecast future performance by analyzing how key metrics change over time. Comparing data across periods makes it easier to identify trends for future projections.
Example:
In an example of a comparison of PepsiCo’s common-size income statement for several years, it’s obvious how horizontal analysis combined with vertical analysis can help find crucial trends in forecasting expenses for example.
Scenario Planning and Sensitivity Analysis
Looking at percentage or absolute changes across periods makes it easier to model different financial scenarios. With horizontal analysis, companies can simulate how rising costs or economic downturns affect future performance.
Including Horizontal Analysis in Regular Financial Reviews
Using horizontal analysis in monthly or quarterly reviews helps businesses track performance trends and spot potential issues. By regularly monitoring key metrics like revenue and expenses, companies can make timely adjustments to stay on track with their long-term goals and improve decision-making.
Conclusion
Horizontal analysis is a great way to keep track of financial trends over time. It helps you spot patterns and make smarter decisions.
From forecasting future performance to planning for different scenarios or managing costs, this method makes it easier to stay on top of changes.
By combining horizontal analysis with tools like FP&A software and scenario planning, companies can make decisions that are not just reactive but also forward-thinking. It’s an essential tool for staying ahead and keeping your strategy on track.
