How to Choose the Right Revenue Forecasting Model for Your Company

Choosing the right revenue forecasting model is no longer just about getting close – it’s about staying ahead. Forecasting used to be just another finance task. Now it’s one of the key parts of how companies navigate their business. In corporations with hundreds of employees, multiple product lines, and operations across several countries, it’s no longer enough to “just get it close.” Leaders want speed, accuracy, and adaptability – especially when market conditions change overnight.
The challenge? Many teams still use Excel. They deal with outdated data, manual tweaks, and confusion over which version is correct. You don’t need a crystal ball to see that this approach doesn’t work in the long run.
Read: Rolling Forecast – 101 Guide For Smarter Planning
In this article, we’ll break down the most common revenue forecasting models, when they do and don’t work and why most modern finance teams end up using a hybrid approach.
You’ll also get a practical framework to help you pick the right model based on how your business really operates.
3 Most Common Revenue Forecasting Models
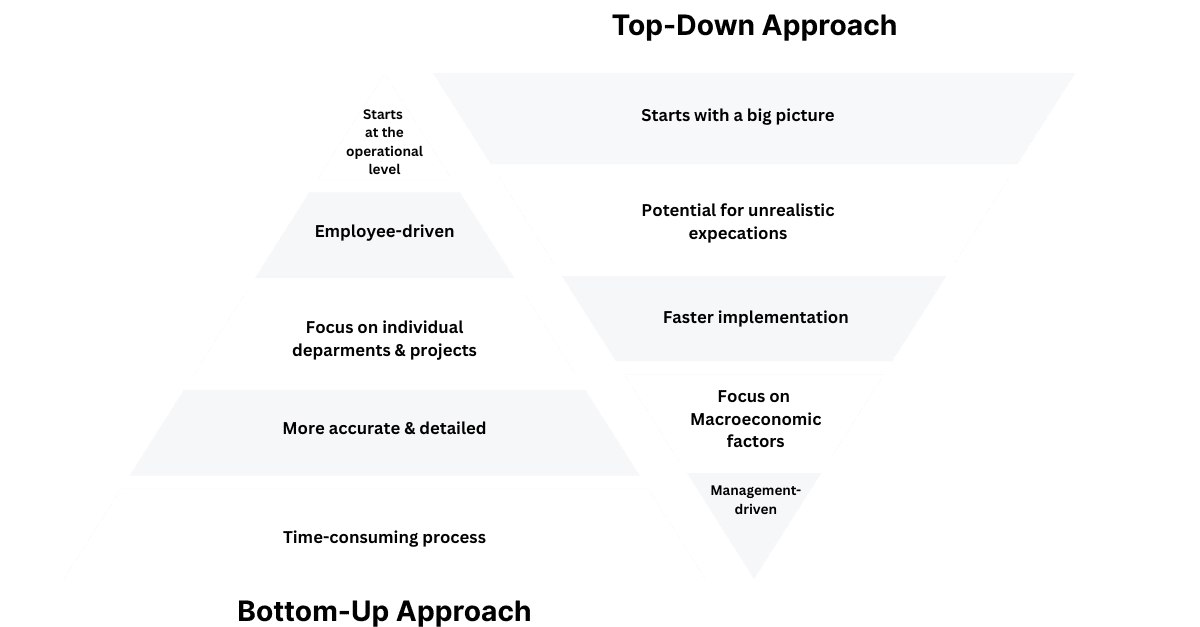
Top-down forecasting – Used for high-level strategic direction
Top-down forecasting starts from high-level goals and breaks them down. Think of a Group CFO saying, “We want to grow revenue by 10% next year,” and expecting each region and product line to hit their share of that target.
This model works well for strategic planning – especially if you’re entering new markets or launching new products. For example, a pharma manufacturer expanding into a new region might base its forecast on how much market share it expects to get and overall economic conditions in that region.
But this approach often falls apart in practice. If the targets don’t match what sales, production, or the market can actually deliver, you’ll end up missing goals and constantly reworking the forecast.
Bottom-up forecasting – More granular and data-driven
Bottom-up forecasting starts at the source: your SKUs, your customers, your territories. It uses real input from sales, demand planners, and finance teams. It’s detailed, precise, and takes longer to build.
For example, a food manufacturer forecasting revenue per region, per distributor, per product line, is likely using a bottom-up approach. Its biggest advantage is that it’s extremely accurate and it involves strong ownership from commercial teams.
The catch? It takes a lot of time and only works if your data is clean and easy to access. If you’re using spreadsheets or pulling info from different systems, you’ll spend weeks just pulling it all together before you can even start analyzing.
Historical trend-based forecasting – Using past data for projections
Historical trend models (or linear regression forecasting) project future revenue based on past performance. They’re quick to build and often used in stable environments with predictable cycles.
A packaging company with stable customers and steady material costs might do fine with a historical model – until supply chain issues or price changes cause issues.
The biggest limitation? They can’t react to change. And right now, change is the norm.
Hybrid forecasting models: The real-world approach
No serious finance team in a manufacturing or FMCG environment is using just one model. In practice, hybrid models are the norm.
Take a regional beverage distributor – they might start with revenue goals set by the board, but then check and adjust those numbers using real input from sales reps and distributors. They can use historical sales data at the same time as their current forecast to check for inconsistencies. For example, if this year’s forecast for a certain product looks much higher or lower than last year’s actual sales, it could be a red flag. Comparing the two helps catch mistakes or unrealistic assumptions early.
This mix brings flexibility and speed. But it only works if your system can keep up. That’s why the tools you use really matter when building a revenue forecasting model that works across departments and regions. Switching to a modern forecasting tool for rolling forecasts helps finance teams move faster, reduce errors, and keep models aligned across the business – without rebuilding everything from scratch.
Not sure where to begin? Our guide to Planful competitors maps strengths, limitations, and best-fit use cases for hybrid workflows.

How to Choose the Right Model
Here are a few simple but important questions that can help you figure out which forecasting model actually fits your business:
- Is your sales data clean, consistent, and stored in one place – or are you chasing numbers across emails, spreadsheets, and different systems?
- How often are you updating your forecast? Once a year? Every quarter? Monthly?
- Are you forecasting at a detailed level, like per SKU or customer segment? Or is it more high-level by category or region?
- And maybe the most important one – are other departments (like sales, production, or logistics) giving you structured, reliable input? Or are you guessing what they’ll do?
If your company has multiple product lines, operates in different countries, or has more than one business unit, chances are a hybrid model is your best bet. But here’s the catch: it only works if you’ve got your data centralized, inputs structured, and a process that lets you make changes quickly. Without that, even the best model on paper will fall apart in real life.
Read: 9 Common Sales Forecasting Software Features You Actually Need
Why Excel falls short - and what to use instead
Most companies we speak with. no matter how large or complex, still start with Excel. And honestly, it makes sense. It’s flexible, familiar, and easy to set up. For basic forecasting, it gets the job done.
But as soon as you start dealing with multiple planners, departments, and countries, Excel starts showing its limits.
- Version control becomes chaos: You end up with 10 different versions of the same file floating around, and no one’s really sure which one is up to date. Someone always forgets to update their tab or overwrites someone else’s work.
- Teamwork slows down: You can’t work in real time with others, so you’re stuck passing files around and waiting for everyone’s input to come in. It slows everything down – especially when deadlines are tight.
- Most of your time is wasted on prep: Instead of analyzing trends, adjusting assumptions, or answering “what if” questions, your team spends hours pulling numbers together, fixing formulas, and chasing missing inputs. In moments like these, automated ad hoc reporting can be a practical way to quickly surface the numbers you need, without rebuilding the whole model.
That’s why a lot of CFOs and finance teams are moving to platforms like Farseer. They want a system that brings all their planning into one place, updates in real time, and is actually built to handle complexity – without needing to rebuild the whole thing every time something changes.
Real-world wins: How a telecom provider reduced their forecasting time by 30% and time for consolidation of planning scenarios by 80%
A great example of this in action is Hrvatski Telekom, one of the largest telecom providers in Croatia. They have over 5,000 employees and more than 70 planners across the group. Each planner had to manage around 50 input sheets every quarter, which meant they were buried in spreadsheets from the start.
Forecasting cycles stretched out over 10 days, and any change required endless email threads and manual updates. After switching to Farseer, they cut planning time by 30%, reduced consolidation time by 80%, and dropped from 10 days of forecasting to just 2.
They centralized planning across four legal entities. At the same time, they unlocked real-time reporting, scenario planning, and even ESG reporting for their parent company, Deutsche Telekom.
It’s a clear case of what happens when the right tools replace Excel chaos: faster decisions, better data, and more time for strategic work.
Hrvatski Telekom
Read case studyConclusion: Forecasting is a Strategic Asset
The revenue forecasting model you choose will directly impact how fast and how well your company can act. Revenue forecasting isn’t just a finance task anymore – it’s how you make better decisions, faster.
And in today’s market, that could be the difference between hitting your EBITDA target or missing it entirely.
Key takeaways:
- There’s no one-size-fits-all revenue forecasting model: Top-down works for strategic direction, bottom-up is great for accuracy, and historical models are quick but risky in volatile markets. Most complex companies end up using a hybrid.
- The right model depends on your data and structure: If your sales data isn’t centralized or you’re not getting reliable input from other departments, even the best model won’t work as intended.
- Excel holds you back: It’s fine for small teams, but with multiple planners and business units, it creates chaos: version control issues, delays, and wasted hours on data prep.
- Better tools deliver real results
- Forecasting is a strategic asset: Your chosen model and system affect how fast you react and hit targets.