Ad Hoc Reporting for Finance Teams Who Can’t Wait on IT

Ad hoc reporting gives finance teams the speed and control they need when time is short and the pressure is high. Instead of waiting for the next scheduled report, they can pull exactly the numbers they need, right when they need them.
It’s how controllers answer urgent questions from the board, or how analysts check a forecast mid-month without looping in IT. The point is simple: sometimes you can’t wait, and a standard report won’t help.
Read: What Great Financial Reporting and Analytics Actually Look Like
Ad hoc reporting solves real problems fast. It’s not about working outside the process. It’s about making the process work better when decisions can’t wait.
What Is Ad Hoc Reporting? A Real-World Finance Perspective
Ad hoc reporting means creating custom, one-off reports when standard ones don’t cover what you need. It’s not part of a routine. It’s triggered by a question that can’t wait for the next monthly report or forecast cycle.
In finance teams, it usually happens when someone needs data now to make a decision. Think: reforecasting mid-month, prepping for an audit, answering a board question, or looking into a sudden cost spike. You open your reporting tool, set your own filters, pull just the slice of data that matters, and move.
Read: Choosing the Right Financial Reporting Tool: 9 Options Compared
These reports are fast, focused, and temporary. They’re not about polishing a dashboard for leadership. They’re about solving something today with the data you already have.
Example: A finance manager at a telecom company spots a variance in tower maintenance spend. They create an ad hoc report to break down Q3 OPEX by vendor, region, and site to find the issue, before it hits the forecast.
Ad Hoc Reporting vs. Ad Hoc Analysis
Ad hoc reporting gives you a filtered snapshot of what’s happening in your data. You pull numbers, slice by dimension, and look at the result. It’s structured and focused on showing specific figures, usually in tabular format.
Ad hoc analysis is about figuring out why something happened. It starts with a question and follows the data across different layers. You’re looking for correlations, causes, and patterns. The goal isn’t just numbers but insight.
The difference is in mindset. Reporting delivers answers. Analysis creates better questions.
Example: A controller at an FMCG company pulls an ad hoc report showing high delivery costs in one region – reporting. Then they compare those costs with promotion periods and find a spike linked to a campaign – analysis. That kind of variance analysis helps uncover trends behind the numbers.
Canned Reports vs. Ad Hoc Reports: When One Fails, the Other Wins
Canned reports are prebuilt, standardized, and scheduled. The term canned comes from the idea that these reports are packaged in advance (just like canned food) ready to be opened and consumed on a regular basis. You know when they’ll arrive, what they’ll show, and how they’re structured. Think monthly P&Ls, trial balances, or board dashboards.

Ad hoc reports are different. They’re built on the spot to answer one specific question. No templates. No waiting. Just a fast way to get the right slice of data when something doesn’t look right.
You need both. Canned reporting gives consistency. Ad hoc gives speed and focus when that consistency isn’t enough.
Example: A pharmaceutical controller tracks R&D spend using a monthly dashboard. When regulatory fees spike in one project, they pull an ad hoc report by cost center and timeline to isolate the issue and adjust forecasts.
Canned reports can still drive your month-end process when done right. See how in this monthly financial report guide.
Drill-Down Reporting: The Hybrid Your Team Actually Needs
Drill-down reporting gives you the structure of a regular dashboard with the flexibility to explore. You start from a high-level number and click through to see the details by region, team, or timeline. There’s no need to create a separate report.
This makes it easy to spot issues, understand what’s behind them, and take action fast. It’s not about building from scratch. It’s about using what’s already there and going deeper when something looks off.
Finance teams use this when they want control without adding complexity. The right FP&A tool supports this with layered views and real-time updates that stay aligned with the rest of the model.
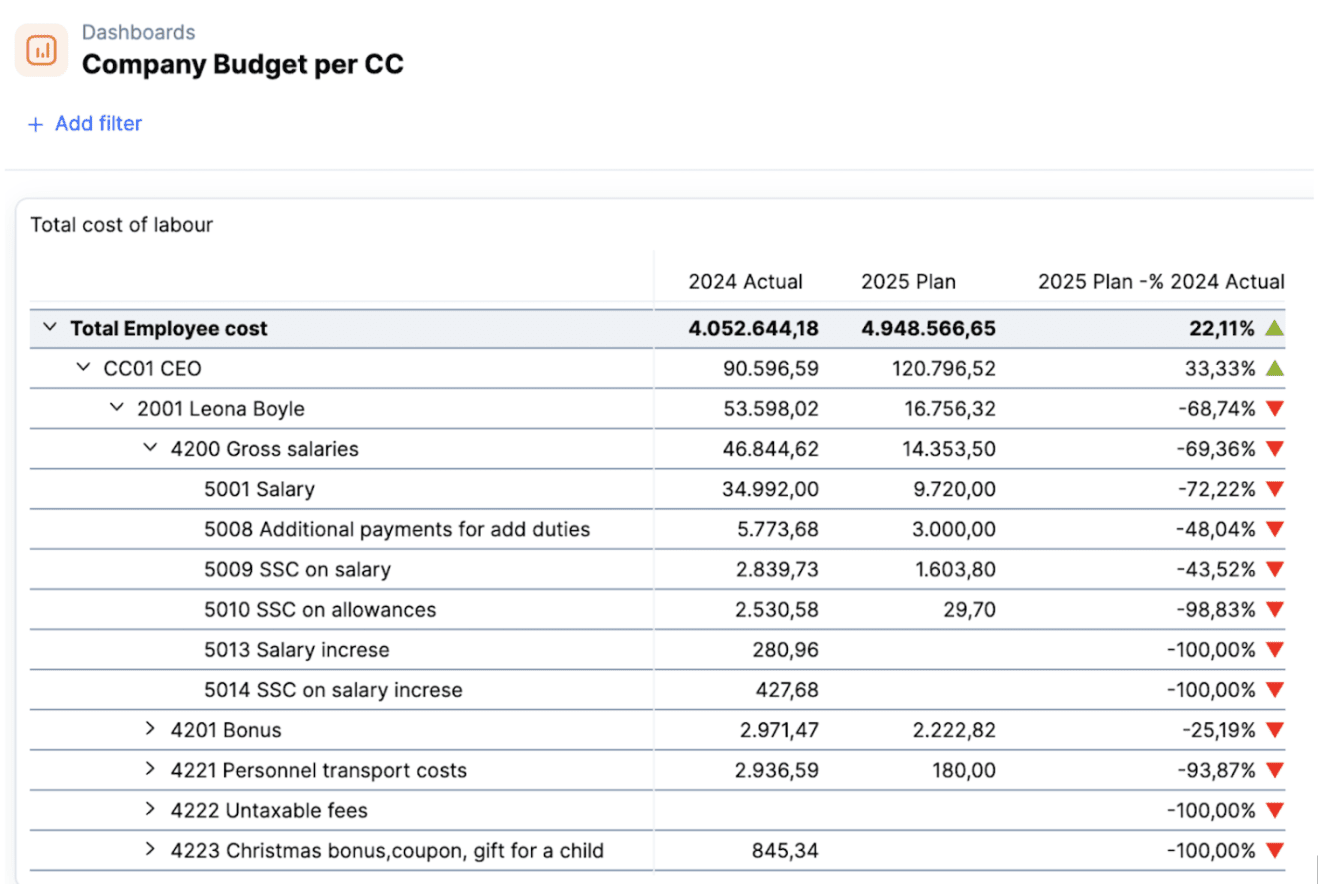
Example: A finance manager sees total employee costs have gone up, even though individual salaries and bonuses have dropped. Using drill-down, they spot a big increase in FTE. The team added more lower-paid roles, which drove the overall cost higher. With that clarity, they adjust future planning to factor in headcount shifts, not just salary averages.
The Process & Best Practices for Ad Hoc Reporting
Start with a clear question. “Why did payroll jump in Q2?” is a lot more useful than “Show me HR costs.” Specific questions lead to reports that actually help you decide what to do next.
Always use trusted data. Stick to shared models or validated sources so you’re not comparing numbers from different definitions. If one team uses gross profit and another uses net margin, your reports won’t match up.
Use filters the way your team thinks about the business: cost center, region, SKU, vendor. Keep it simple and consistent.
When you notice you’re rebuilding the same logic, save it. Reusable blocks save time and cut errors. Tag your reports with the creator, timestamp, and a quick note on what it’s solving. That way, when someone reuses it, they know what they’re looking at.
Read: Revenue vs Gross Profit: Understanding the Difference to Avoid Planning Errors
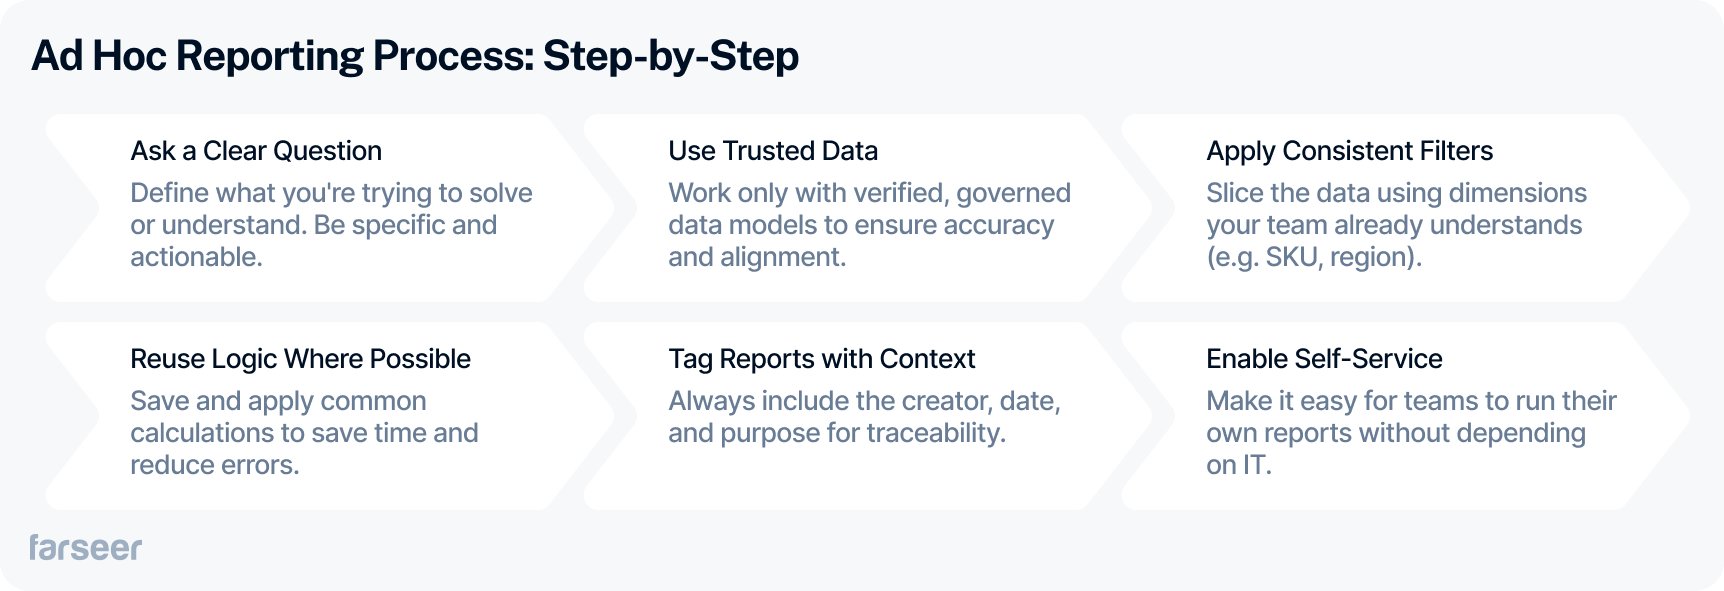
Make sure people can build reports without asking for help. A solid self-service setup lets business users get answers fast, without waiting in line behind other requests.
This works especially well in planning cycles where teams need to track flexible budget variance. Having a setup that supports that kind of quick adjustment makes all the difference.
Real-World Use Cases for Ad Hoc Reporting
An ad hoc report shows its real value when finance teams face questions that dashboards and standard reports cannot answer. It gives you speed to dive into the right numbers and fix issues before they grow. Here are a few examples where pulling a quick ad hoc report made a real difference.
FMCG: Raw material costs spike without warning. The controlling team pulls an ad hoc margin report by SKU and country. They find where profit is slipping and adjust pricing before the month closes.
Telecom: After a big 5G rollout, the CFO asks why project costs are higher than planned. Finance pulls an ad hoc report breaking CapEx down by region and supplier. They spot two vendors charging more than agreed and fix it before the next payment.
Pharma: During a board review, leadership wants to see the early impact of new rebate deals. The FP&A team pulls an ad hoc gross-to-net report by brand and channel. They find where rebates helped sales but hurt margins and update their forecast on the fly.
Benefits of Ad Hoc Reporting That Actually Matter
Good ad hoc reporting makes finance teams faster, sharper, and more confident. And when it’s built on top of structured analytics and reporting practices, the impact multiplies.
When you build it on clean data models, clear rules, and shared logic, it becomes a real advantage, not another shortcut.
Read: What Great Financial Reporting and Analytics Actually Look Like
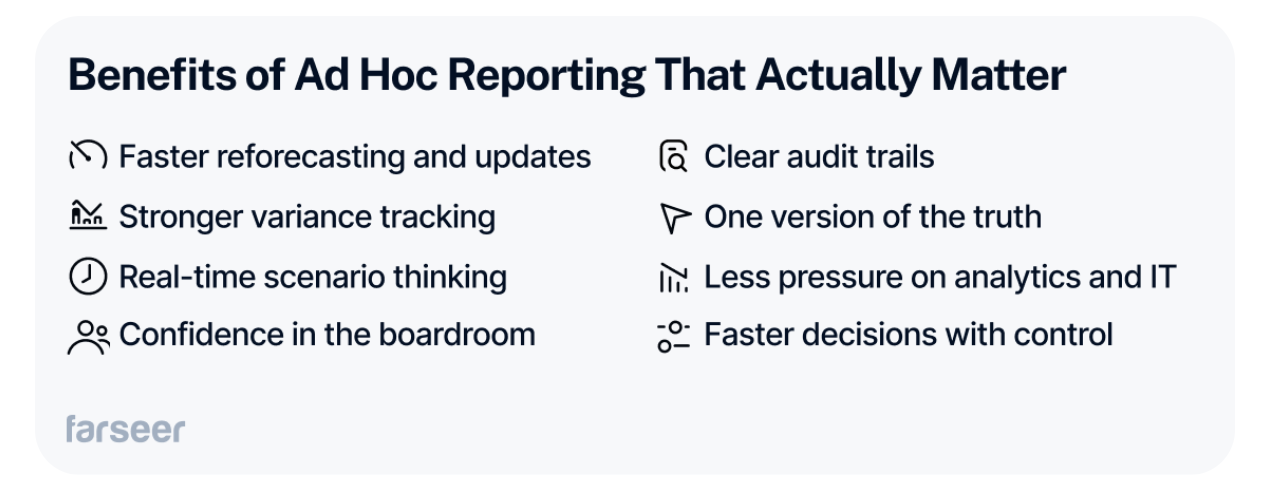
Here is what strong ad hoc reporting gives you:
- Faster reforecasting and updates
Teams can grab fresh numbers, update key drivers, and fix plans right when they need to. - Stronger variance tracking
Users can spot problems early by slicing actuals across regions, products, vendors, or any other key view. (If you want to stay on top of deviations fast, learn more about budget vs actual analysis). - Real-time scenario thinking
Finance can tweak cost, revenue, or headcount drivers and instantly see the impact on their forecast. - Confidence in the boardroom
When leadership asks tough questions, finance can answer right away with trusted numbers from the source. - Clear audit trails
Every ad hoc report shows who pulled it, when they pulled it, what data it used, and how it was filtered. - One version of the truth
Everyone builds reports from the same numbers and rules, so teams stop fighting over which figure is right. - Less pressure on analytics and IT
Business users answer their own questions without waiting in line for a custom report. - Faster decisions with control
Teams move quickly but stay grounded in real data, not guesswork.
Ad hoc reporting is not a shortcut. It is how smart finance teams stay fast without losing control.
Common Issues (and How Finance Teams Stay in Control)
Ad hoc reporting moves fast, but without the right setup, it can cause bigger problems later. Good finance teams know how to keep it clean and reliable from the start.
Here is what to watch out for:
- Data silos
If teams pull numbers from different places, reports do not match. Always use one shared model as the source. - Metric confusion
When margin or revenue is calculated five different ways, trust disappears. Define core metrics and lock them into your reporting system. - Random reports everywhere
Without structure, reports pile up. Set clear rules for saving and naming ad hoc reports. - Slow, clunky tools
If your software lags when users need quick answers, they stop using it. Use a tool that handles large models and live queries with no delay. - Overuse of new reports
Not every small question needs a fresh build. Teach users to explore drill-downs and filters before asking for a new report.
Set these basics early. Strong ad hoc reporting should speed up decisions, not create more cleanup work later.
The Right Tool for Real Ad Hoc Reporting Control
Ad hoc reporting only works when your tools are built for it. This is not about flashy dashboards or pretty graphs. It is about real support for fast finance decisions.
Here is what the right tool should give you:
- Governed logic, so everyone works from the same margin, cost, and headcount numbers
- Full audit trails for every metric change and every report created
- Role-based permissions, so users only see what matters to their work
- An Excel-native or spreadsheet-style interface that feels familiar, not forced
- Real-time data connections to your ERP, CRM, and planning systems
- A self-service query builder with pre-approved fields
- Drill-through and drill-down reporting built into one flow
- A separate metric layer that keeps calculations consistent across teams
Good ad hoc reporting starts with the right platform behind it.
Looking for a tool that already does all this?
Farseer gives you governed logic, real-time data, easy drill-downs, and a spreadsheet-native interface your finance team can pick up fast. No messy setup. No broken reports. Just real control when you need it.
Key Takeaways on Ad Hoc Reporting
- Ad hoc reporting gives finance teams fast answers when standard reports are too slow or too broad.
- Good ad hoc reports are built on trusted data, clear logic, and shared definitions across the team.
- Use ad hoc reports to spot issues early, answer board questions, and reforecast quickly without waiting for the next reporting cycle.
- Combine ad hoc reporting with drill-down reporting for even faster insights without starting from scratch.
- Strong ad hoc reporting setups need self-service access, audit trails, and a single source of truth behind every number.
- Ad hoc reporting works best when it fits inside a structured process, not when it replaces one.
- If your team struggles with slow tools, messy data, or endless report requests, it is time to upgrade your stack.
- Farseer gives finance teams a way to pull real-time numbers, explore them freely, and keep reporting fast and clean.