Top-Down vs Bottom-Up Forecasting in Demand Planning: Pros, Cons and How to Choose

Why does the choice between bottom-up and top-down forecasting matter so much in demand planning? Because the method you use determines not just the accuracy of your numbers. It shapes how your organisation collects information, who has a voice in the process, and how quickly you can respond when reality diverges from plan.
In simple terms: top-down starts with management setting targets and distributing them down the organisation. Bottom-up starts with the most granular data available and builds upward. It works at the SKU, the store, and the sales rep level. Neither method is universally superior. Both break down in predictable ways when applied incorrectly.
This article covers how each method works in practice, where each one fails, a third option most teams overlook, and a decision framework for choosing the right approach for your business.
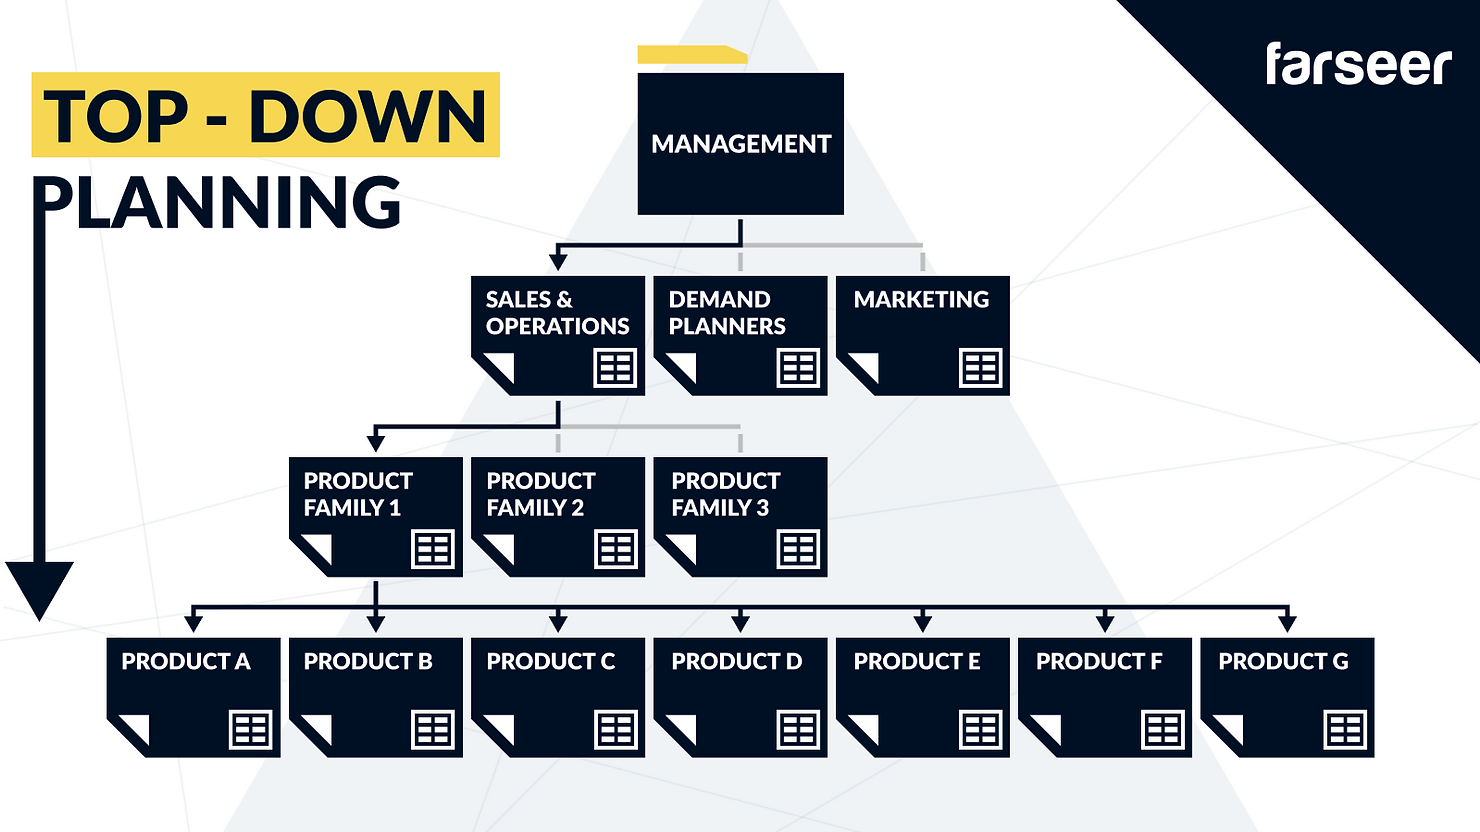
Top-Down Forecasting in Demand Planning
Top-down forecasting is the simpler of the two approaches. Management or central planning begins with macro assumptions about market growth rates, historical revenue trends, and strategic targets. Those assumptions are then translated into product, channel, and regional forecasts.
A typical monthly top-down process works as follows:
- Management uses market research, competitive benchmarks, and prior-year performance to set overall revenue targets.
- The central planning team and sales challenge these figures against current market signals.
- Demand planners break the total down to product group level.
- Historical split ratios are used to allocate volumes to distribution centres, channels, and months. Seasonality and planned promotions are factored in at this stage.
Where top-down works well: strategic planning, investor reporting, new market entry, and situations where speed matters more than granular accuracy.
Where it breaks down: when macro assumptions do not reflect what is happening at the SKU or channel level. A product category forecast of +10% tells a regional sales manager very little about which specific SKUs to prioritise. It also masks significant variation between high-velocity and slow-moving items.
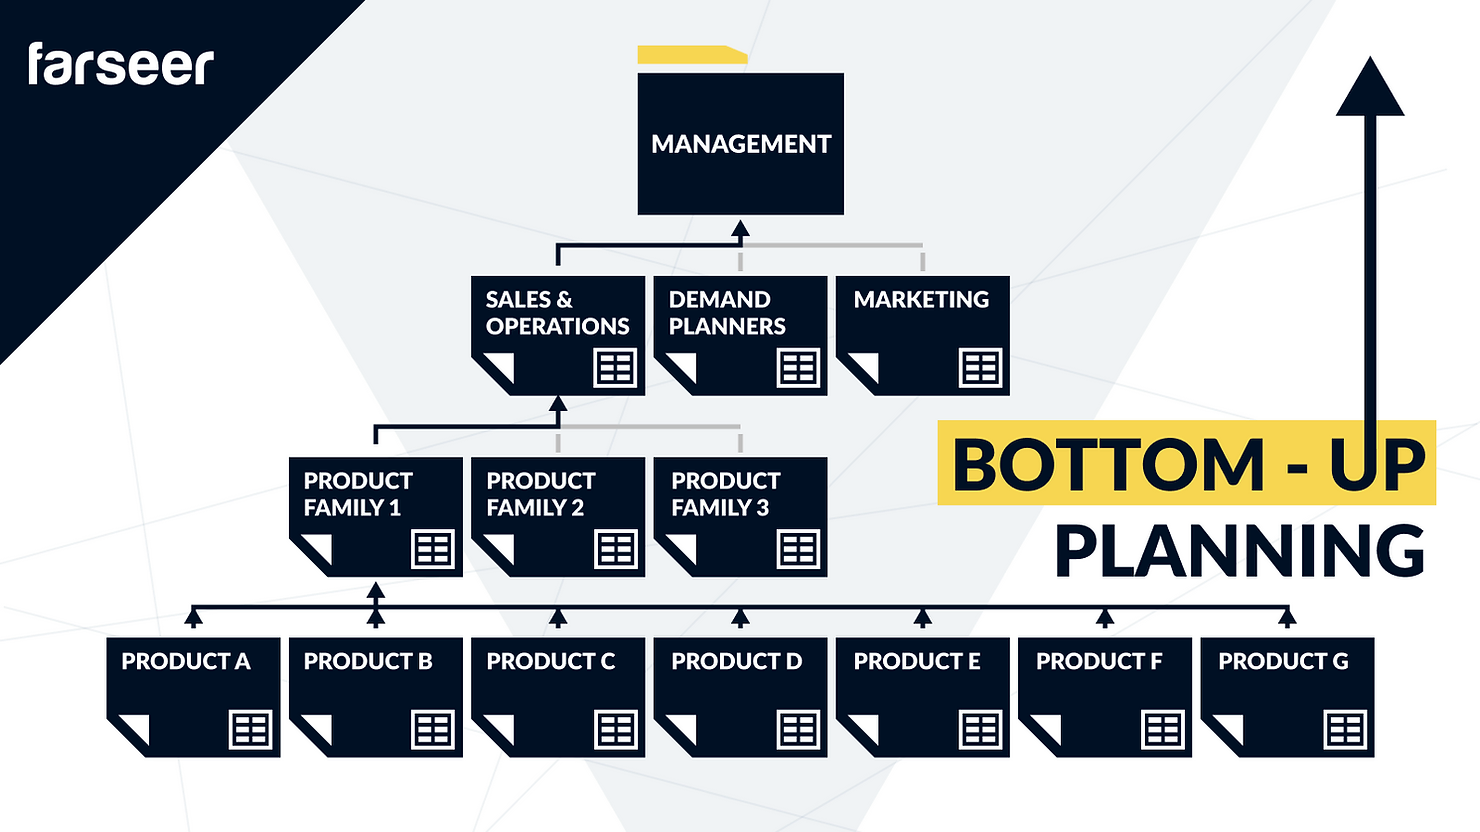
Bottom-Up Forecasting in Demand Planning
Bottom-up forecasting builds the demand picture from the most granular level available. This is typically the individual SKU across channels, regions, and time periods. The key distinction is that forecasts are shaped by people closest to the customer, not handed down from above.
A typical bottom-up process runs as follows:
- Central demand planners generate an initial statistical baseline at the SKU level using historical data and modeling.
- Local demand planners review and adjust these figures using regional intelligence. This includes promotional plans, competitive dynamics, and distribution changes.
- The sales team layers in commercial knowledge: upcoming deals, customer feedback, and pipeline activity.
- New product forecasts are developed separately using analogue products or market research, since no sales history exists.
- Volume forecasts are translated to revenue values.
- Management reviews and often challenges the consolidated forecast before sign-off. Operations then uses it to build the production and inventory plan.
Where bottom-up works well: operational planning, SKU-level replenishment, S&OP, and any context where granular accuracy directly drives cost. This includes excess inventory, stock-outs, and production scheduling.
Where it breaks down: when data quality is poor, when the organisation lacks cross-functional discipline, or when the SKU count is so high that full bottom-up coverage becomes impractical.
Read: How to Go from Top-Down to Bottom-Up Budgeting and Forecasting
Pros and Cons: Side-by-Side Comparison
| Criterion | Top-Down | Bottom-Up |
| Speed | Fast. Fewer inputs and quicker sign-off. | Slow. Requires consolidation across levels. |
| Accuracy | Lower. Based on aggregated assumptions. | Higher. Reflects real demand signals. |
| Data requirement | Low. Market data and aggregates suffice. | High. Clean SKU and regional data required. |
| Employee engagement | Low. Decisions made centrally. | High. Field teams and planners contribute. |
| Bias risk | High. Management optimism is common. | Lower. Ground-level inputs reduce bias. |
| Best for | Strategy and investor reporting. | Operations, S&OP, and replenishment. |
Middle-Out Forecasting: The Third Option
Most demand planning discussions present a binary choice. In practice, a third approach has gained traction. It is particularly useful in organisations with large SKU counts across multiple product families.
Middle-out forecasting operates at the product-category or product-family level. Planners forecast demand at this intermediate tier, then disaggregate downward to individual SKUs and roll upward to total revenue.
Read: Annual Recurring Revenue vs Revenue: How Each Metric Impacts Financial Forecasts
This approach strikes a balance. It avoids the granularity burden of full bottom-up while retaining more accuracy than pure top-down. It is particularly effective in FMCG, retail, and manufacturing where product families share common demand drivers such as seasonality, promotions, and shelf placement.
A Concrete Example: ABC Beverages
Consider a beverage company with a flagship juice brand covering 150 SKUs and a new sparkling water range with 20 SKUs.
Top-down: Management forecasts 12% revenue growth and allocates it by category. Demand planners distribute to SKUs using historical split ratios. The process takes two days.
Bottom-up: Regional sales teams submit weekly sell-out data. Planners build SKU-level statistical models, incorporate regional promotion calendars, and develop new-product assumptions for the sparkling water range. The process takes two to three weeks across eight regional teams.
Hybrid: Management sets the 12% growth envelope. Planners apply bottom-up models to the top 40 SKUs driving 80% of revenue. Top-down ratios handle the long tail. New sparkling water SKUs are forecasted using analogue assumptions. Total time is one week, with materially better accuracy on high-velocity SKUs.
Read: How to Choose the Right Revenue Forecasting Model for Your Company
The Hybrid Approach: Where Most Companies End Up
The three most common failure points in demand planning are consistent across industries.
- Siloed data: Finance, sales, and operations work from different versions of the truth.
- Inefficient communication: Too many emails, spreadsheet handoffs, and disconnected approval chains slow the process.
- Outdated tools: Manual data extraction from legacy ERP systems and version-control chaos in shared spreadsheets create recurring problems.
The hybrid approach addresses these through three core principles.
- Effective collaboration: The demand planning process flows in both directions. Management sets the macro envelope. Field teams shape the granular forecast.
- Single source of information: One validated, frequently updated data environment that all stakeholders can reference and trust.
- Automation: Reports, data integration, status notifications, and model updates are automated. This frees planning time for analysis and decision-making rather than data wrangling.
In practice, a hybrid process works like this. Management sets a top-down revenue target. Demand planners build a bottom-up SKU forecast using the latest actuals and market intelligence. The two are reconciled in a structured S&OP review, with gaps discussed, assumptions challenged, and a single agreed number produced. This reconciliation loop, repeated monthly or quarterly, is where the real value of hybrid planning is created.
Read: Finance Automation in 2026: Tools, Use Cases, and Real-World Strategy
| One of the most common barriers to hybrid demand planning is the tooling. Coordinating top-down targets from finance with bottom-up inputs from sales and operations requires a shared environment where both can coexist without version-control chaos. Farseer’s connected planning platform enables finance and demand planning teams to work within the same model simultaneously. Top-down targets stay visible alongside bottom-up actuals, so reconciliation becomes a structured conversation rather than a spreadsheet firefight. See how it works at farseer.com. |
How to Choose: A Decision Framework
| Factor | Use Top-Down If… | Use Bottom-Up If… |
| Data availability | Limited historical data is available. | Clean, granular transactional data exists. |
| Company stage | Early-stage, pre-revenue, or new market entry. | Established operations with mature data systems. |
| Planning horizon | Strategic planning over 12 or more months. | Operational planning for 1 to 12 months. |
| Stakeholder audience | Board, investors, or executive team. | Operations, supply chain, or sales management. |
| SKU count | Thousands of long-tail SKUs to cover. | A manageable set of high-velocity SKUs. |
| Speed requirement | Results are needed quickly. | Accuracy matters more than speed. |
When none of these factors point clearly one way, default to hybrid. Most mature demand planning organisations do.
Conclusion
Top-down and bottom-up forecasting are not competing philosophies. They are tools with different strengths. Top-down aligns the organisation around shared targets and produces results quickly. Bottom-up builds accuracy from the ground up and surfaces the detail that drives operational decisions. Middle-out offers a practical middle ground when full bottom-up coverage is impractical.
Most organisations benefit from running both simultaneously. Top-down serves strategic alignment. Bottom-up serves execution. The discipline of reconciling the two through a structured S&OP process is where forecasting moves from a data exercise to a genuine planning capability.
The limiting factor is rarely the method. It is usually the tools, the data quality, and the cross-functional discipline to maintain the process over time.
If your team is working through the shift from static, top-down budgeting to a more responsive, connected planning model, Farseer brings financial and operational forecasts into a single platform. Scenario planning, rolling forecasts, and real-time actuals are all linked. Whether you are running S&OP cycles, managing SKU-level demand, or trying to align finance and commercial teams on one number, Farseer is built for exactly that problem. Explore the platform at farseer.com.
Bottom up Forecasting in Demand Planning
Conclusion

FAQ
What is the main difference between top-down and bottom-up demand forecasting?
Top-down starts with a high-level target set by management and distributes it downward to products and channels. Bottom-up builds the forecast from the most granular level, aggregating individual SKUs, stores, or sales reps upward. Top-down is faster. Bottom-up is more accurate for operational purposes.
Which method is more accurate, top-down or bottom-up?
Bottom-up is generally more accurate for operational planning because it captures real demand signals rather than distributing macro assumptions downward. That said, accuracy depends on data quality. Unreliable field data can make bottom-up worse than a well-calibrated top-down model.
What is a hybrid forecasting approach in demand planning?
A hybrid approach uses top-down for strategic targets and bottom-up for operational SKU or channel-level planning. The two are reconciled through a structured S&OP process. Most mature demand planning organisations use some form of hybrid because neither pure method alone handles both strategic and operational needs effectively.
What is middle-out forecasting?
Middle-out forecasting operates at the product-family or category level, then disaggregates to SKUs and rolls up to totals. It avoids the data burden of full bottom-up while providing more operational detail than pure top-down. It is widely used in FMCG, retail, and manufacturing with large SKU counts.
When should a company use top-down forecasting?
Top-down is most appropriate for early-stage companies without historical data, long-range planning horizons of 12 or more months, investor or board-level reporting, and situations where speed matters more than granular accuracy.
How does modern planning software change the bottom-up vs top-down decision?
Historically, bottom-up required significant manual effort. Teams had to collect inputs from many sources, consolidate in spreadsheets, and manage version control. Modern FP&A platforms like Farseer automate much of this process. This makes bottom-up and hybrid approaches accessible to mid-market organisations that previously defaulted to top-down out of practical necessity.
What are the most common failure points in demand forecasting?
The three most consistent failure points are siloed data, over-reliance on historical patterns, and poor cross-functional communication. Siloed data means finance, sales, and operations work from different numbers. Over-reliance on history means the forecast fails to account for market changes or new products. Poor communication means the assumptions behind a forecast are never clearly shared or challenged.
Can top-down and bottom-up forecasts run simultaneously?
Yes, and many organisations do exactly this. Finance maintains a top-down strategic plan for board reporting. Demand planners maintain a bottom-up operational forecast for replenishment and production. Farseer supports both views within a single connected model, surfacing discrepancies before they become month-end surprises.