Understanding a company’s financial health involves several factors, and a comparative balance sheet is one of them. After all, financial statements provide a clear picture of business performance
Read: A Complete Guide to Financial Statement Analysis for Strategy Makers
A comparative balance sheet allows you to compare the company’s financial position over several periods. In the end, this helps you identify trends and patterns over time, whether it’s growing assets, increasing liabilities, or any shifts in equity.
But this tool isn’t just about numbers; it’s about storytelling through data. It’s about revealing whether a company has stable growth, is facing risks, or making progress on its financial goals.
If you’d like to find out how to use it to benefit your company’s finances – read on.
What is a Comparative Balance Sheet?
A comparative balance sheet is a financial report that displays two or more balance sheets side by side. This enables you a clear comparison of a company’s financial position over different periods. Usually, businesses use this system to compare data from consecutive years or quarters, which helps them track performance trends from different angles.
In 2022, Apple reported total assets of $352.76 billion, slightly up from $351.00 billion in 2021. However, liabilities grew from $287.91 billion to $302.08 billion during the same period. This comparison highlights Apple’s increasing debt since it took on more liabilities to finance share buybacks and dividends. Shareholders’ equity also dropped from $63.09 billion in 2021 to $50.67 billion in 2022, showing a decrease in the company’s retained earnings.
This kind of comparison shows Apple’s financial strategy – they leverage debt to return value to shareholders. This makes it easier for stakeholders to assess whether the company is growing, maintaining liquidity, or taking on higher financial risk.
Format of a comparative balance sheet
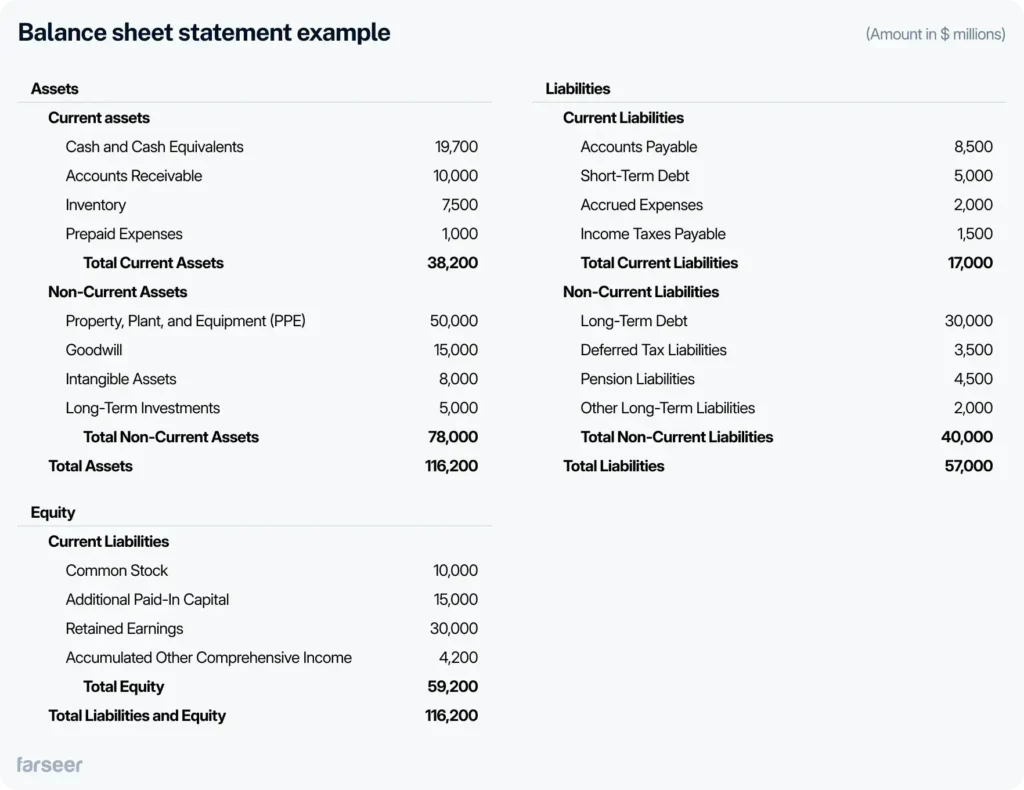
A typical comparative balance sheet consists of 2 columns, and each column signifies a different reporting period. For example, one column might show data from the current year, while the other shows figures from the previous year. In this way, it’s easier for the finances to notice increases or decreases over time. Some comparative balance sheets may also include a third column to calculate the percentage change between periods. This provides a clearer view of growth or decrease.
Key components of a comparative balance sheet
Assets
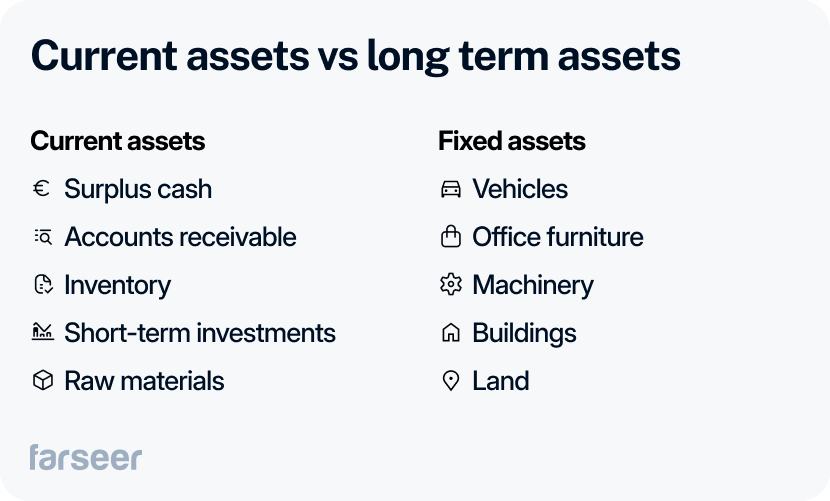
These are divided into 2 groups: current and long-term assets. Current assets refer to items like cash, accounts receivable, and inventory, that are expected to be converted to cash or used within a year. Long-term assets refer to items that will provide value over a longer period, like property, plant, and equipment.
Liabilities
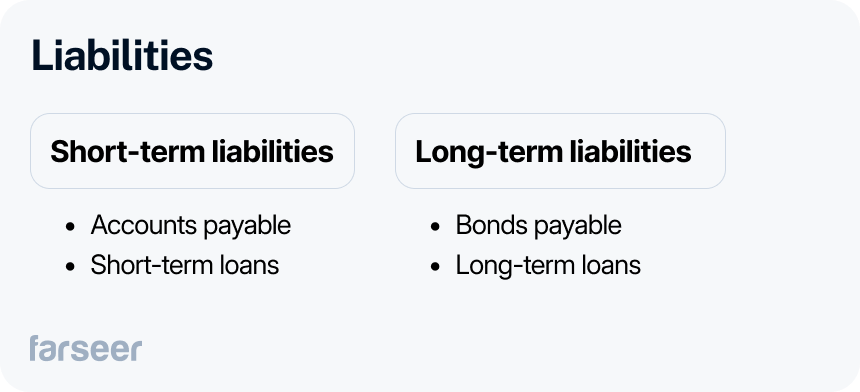
Liabilities can also be divided into 2 groups, depending on the amount of time that a company needs to settle them. Therefore, short-term liabilities are debts or obligations the company needs to settle within the next year, such as accounts payable or short-term loans. On the other hand, long-term liabilities are obligations that extend beyond one year, like bonds payable or long-term loans.
Equity
Equity represents what’s left of a company’s assets after all its debts and obligations (liabilities) have been paid off. It includes things like retained earnings (profits the company has kept) and common stock (shares issued to investors). In other words, it’s a part of the company that truly belongs to the shareholders.
How it differs from a regular balance sheet
A regular balance sheet provides a snapshot of a company’s financial status at a single point in time, meaning that it shows only one period’s worth of data. On the other hand, the comparative balance sheet allows for the tracking of financial changes over time. When you compare two periods, you can easily notice whether you’re dealing with growth, decline, or stability and in which aspect. And that’s not all – it enables users to identify trends, such as improvements in cash flow, increases in debt, or changes in equity, which may not be visible from a single-period balance sheet.
If you want to know about the limitations of a regular balance sheet, read: What Are Primary Limitations of the Balance Sheet (and How to Overcome Them).
Why Is It Important to Use a Comparative Balance Sheet
1. Spot trends easily
As mentioned, a comparative balance sheet is a vital tool for spotting trends in a company’s financial performance. When you compare financial data across several periods, such as consecutive years or quarters, you can easily recognize and report on patterns.
For example, you may notice that assets are steadily growing, which indicates increased business stability. Or you can notice that liabilities are decreasing, suggesting the company is improving its debt management. This helps you decide whether the company is on a positive trajectory or if there are areas of concern that need to be tackled.
2. Make more informed decisions
Since you can spot trends easily, this should help owners and managers make better-informed decisions. For example, if the comparative balance sheet shows a consistent increase in inventory, it might signal an opportunity to scale up operations. However if liabilities are growing faster than assets, management may decide to focus on cost-cutting or debt-reduction measures. When you’re on track with changes like these, you can adjust strategies promptly. Whether we’re talking about reallocating resources, new investments, or initiating growth plans. Raw data become actionable insights.
Read: What is a Review Engagement? A Practical Guide for Businesses
3. Build confidence from investors and stakeholders
A comparative balance sheet also plays a crucial role in transparency. When companies provide side-by-side comparisons of financial data over time, it allows investors and stakeholders to easily assess the company’s financial health. This level of transparency helps build trust. This means that investors can better evaluate risks and returns. And this will make them more confident in their decision to invest or continue supporting the business. This sort of clear financial reporting can also have a huge impact on shareholders since in this scenario they can easily and transparently assess the company’s performance.
Read 5 Best Financial Analysis Tools to Look Out For in 2025
How to Read a Comparative Balance Sheet
How to interpret all of the numbers on a balance sheet like this and get the most out of it? Let’s break down the most the most critical areas:
Cash flow
One of the first figures everyone is interested in is cash flow and its changes between periods. A rise in cash flow can mean that the company has improved its cash management, or that it’s more efficient in generating cash from its operations. On the other hand, a drop in cash flow might indicate potential liquidity issues, and the first “leak” to take a look at is its short-term obligations. If there aren’t enough means to cover these, it is questionable whether a company has enough liquidity to fund growth.

Debt levels
Now let’s take a look at the liabilities. If liabilities are growing, it might reveal financial issues, especially if the company’s assets aren’t increasing at a similar rate. This could indicate rising debt levels that might affect future borrowing capacity. On the other hand, if liabilities are shrinking, the company could be paying off its debts, which is a sign of good financial health and more available cash for future investments.
Equity
What if equity changes?
Changes in equity can reveal important information about shareholder or owner value. If equity is increasing over time, it generally means the company is either retaining more earnings or issuing additional shares. This shows that the business is growing and it can boost the confidence of investors. However, a decline in equity might suggest that the company is experiencing losses or has distributed significant dividends. This may be a wake-up call you need and may require further investigation.
Calculating percentage changes
One of the easiest ways to make comparisons over multiple periods is by calculating the percentage change between periods for key items like assets, liabilities, or equity. This shows clearly just how much certain figures have grown or shrunk.
For example, if a company’s assets grew by 10% year-over-year, but liabilities increased by 20%, this uneven growth could signal financial risk. Meaning, that its debt is increasing by a higher percentage than its assets. Calculating percentage changes makes it easier to understand the scale of financial shifts, rather than just focusing on the raw numbers.
Examples of Comparative Balance Sheet Use
Year-over-Year Financial Assessment
Let’s take a simple example of a retail company using comparative balance sheets to assess its financial health over two consecutive years.
And let’s say that in Year 1, the company had total assets of $500,000 and liabilities of $300,000. In Year 2, its assets grew to $600,000, but liabilities also increased to $380,000.
- Trend analysis: The increase in assets by $100,000 suggests that the business expanded, possibly through inventory growth or the acquisition of new equipment. However, the rise in liabilities by $80,000 might raise concerns, especially if they grow faster than assets in the future.
- What you can conclude from that: Based on this comparison, the company might decide to manage its debt more carefully. In order to avoid financial stress, while still capitalizing on the growth of its assets.
Practical scenarios
There are several practical situations where comparative balance sheets become crucial:
- Reviewing seasonal business trends: Many businesses, like retail and tourism, have ups and downs in their sales and costs throughout the year due to seasonal trends. A comparative balance sheet helps track these shifts every year to see if these seasonal highs and lows are growing or shrinking. For example, if a retailer’s assets (like inventory) always rise during the holiday season but drop afterward, a comparative balance sheet can show this pattern. This information is crucial for managing inventory and financial planning during busy or slow seasons.
- Preparing for an audit: This type of document is key for auditors and based on everything mentioned so far, it’s rather obvious why. It shows how the company’s financial position has evolved, and highlights areas where further investigation might be necessary, like unexplained changes in liabilities or equity.
- Securing loans: Lenders often ask for comparative financial statements, including balance sheets, to evaluate a company’s ability to repay loans. A strong balance sheet showing growth in assets and stable or declining liabilities over time can increase a company’s chances of securing really good loan terms.
Conclusion
Whether it’s adjusting financial strategies, identifying risks, or planning for future growth, a comparative balance sheet provides a clear picture of how a business is evolving. As such, it is a crucial aspect of any financial planning system developed within a company.
Use it regularly – and it will help your business stay financially healthy, proactive, and better positioned for long-term success.
