Classified Balance Sheets in Practice: Structure, Uses & Example

When we talk about balance sheets, we’re actually referring to the core financial statements that describe a company’s financial health at a specific moment.
A balance sheet outlines a business’s assets, liabilities, and shareholder equity. This makes it easier for stakeholders to understand a business’s financial standing. However, when it comes to making in-depth assessments and analyses, a standard (or let’s call it traditional) balance sheet is sometimes not enough. This is where a classified balance sheet comes into play.
Read: A Complete Guide to Financial Statement Analysis for Strategy Makers
In what way is a classified balance sheet different from a regular one, what are its components, and how does it actually look – read on to find out.
What’s a Classified Balance Sheet?
A classified balance sheet is actually a standard balance sheet – but with much more detail. It organizes information about assets, liabilities, and equity into specific, meaningful subcategories. These are for example current vs. non-current assets and current vs. non-current liabilities, based on their characteristics and time frames.
Why the extra division and what does it bring to the table?
A classified balance sheet provides more detail, allowing finance professionals to better understand a company’s financial health. By separating assets into current (used or converted to cash within a year) and non-current (long-term resources), it becomes easier to assess liquidity. If current assets are sufficient, the company can cover daily costs – a key sign of stability. The same logic applies across other subcategories, which is the core value of this format.
Why Use a Classified Balance Sheet?
A classified balance sheet delivers better financial insights through its separation of assets and liabilities into current and long-term categories beyond what standard financial reports provide. The main advantages include:
-
Clearer Liquidity & Solvency View: The view of liquidity and solvency becomes clearer through this format because it helps determine short-term obligation fulfillment (e.g., current ratio or working capital).
-
Transparency for Stakeholders: Financial health and risk assessment becomes easier for investors and lenders because they can see immediate obligations against future ones.
-
Compliance with Standards: The standards of GAAP and IFRS demand or suggest classification because it leads to better reporting and comparison capabilities.
-
Improved Management Decisions: Leadership can instantly identify liquidity shortages and funding requirements together with investment possibilities through this format.
Components of a Classified Balance Sheet
As mentioned, the main components of a classified balance sheet are the same as in the standard one – Assets, Liabilities, and Equity. But in this case, each section is further organized into more categories. Here’s how:
Assets
Assets refer to the resources a company owns and they can be used to generate value. In a classified balance sheet, they are divided into:
Current Assets: These are assets that can be converted to cash or used up within a year. They include:
-
Cash and Cash Equivalents
-
Accounts Receivable
-
Inventory
-
Prepaid Expenses
Non-Current (Long-Term) Assets: These are expected to provide value over a period longer than one year:
-
Fixed Assets
-
Intangible Assets
-
Investments
Each asset type plays a unique role – current assets ensure liquidity, and non-current assets support operations and market position over time.
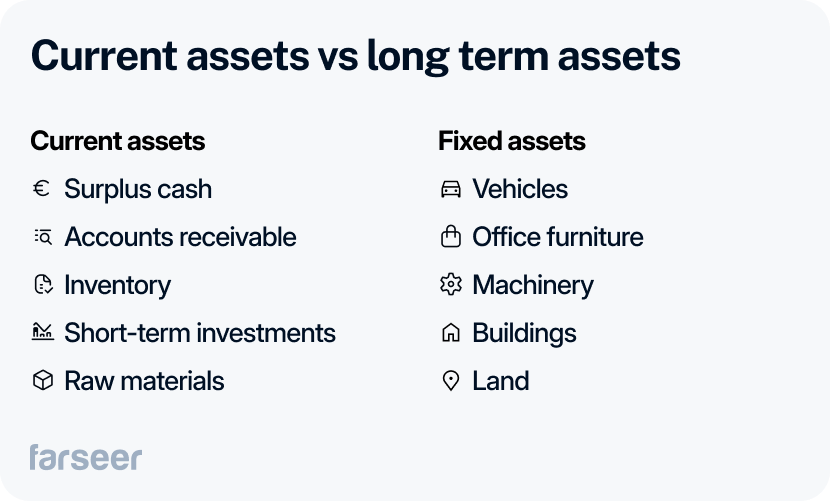
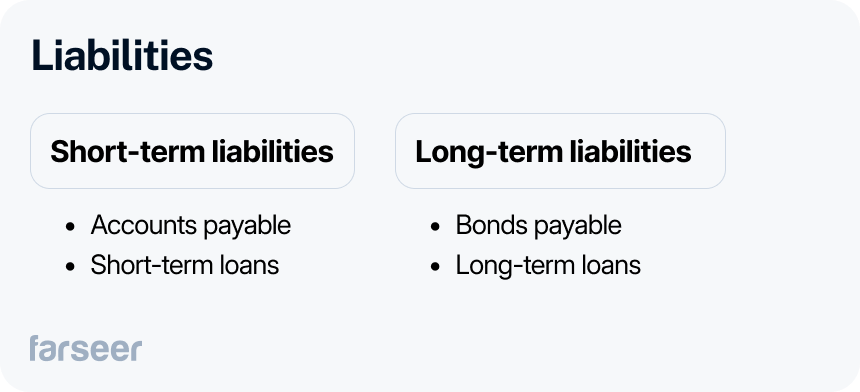
Liabilities
Liabilities represent obligations a company owes to others. These are also divided into short- and long-term categories:
Current Liabilities: Obligations due within a year, such as:
- Accounts Payable
- Short-Term Loans
- Accrued Expenses
- Unearned Revenue
Non-Current Liabilities: Long-term obligations due beyond one year, including:
- Long-Term Debt
- Deferred Tax Liabilities
- Pension Obligations
These categories show how a business manages both immediate and future financial obligations.
Equity
Equity is what is left of a company’s assets once all liabilities are paid off – the net worth of the company. It typically includes:
- Common Stock: The par value of shares issued to investors
- Retained Earnings: Profits retained in the business
- Additional Paid-In Capital: Contributions by shareholders over the par value
If a company has $1 million in assets, and $400,000 in liabilities, the remaining $600,000 is equity.
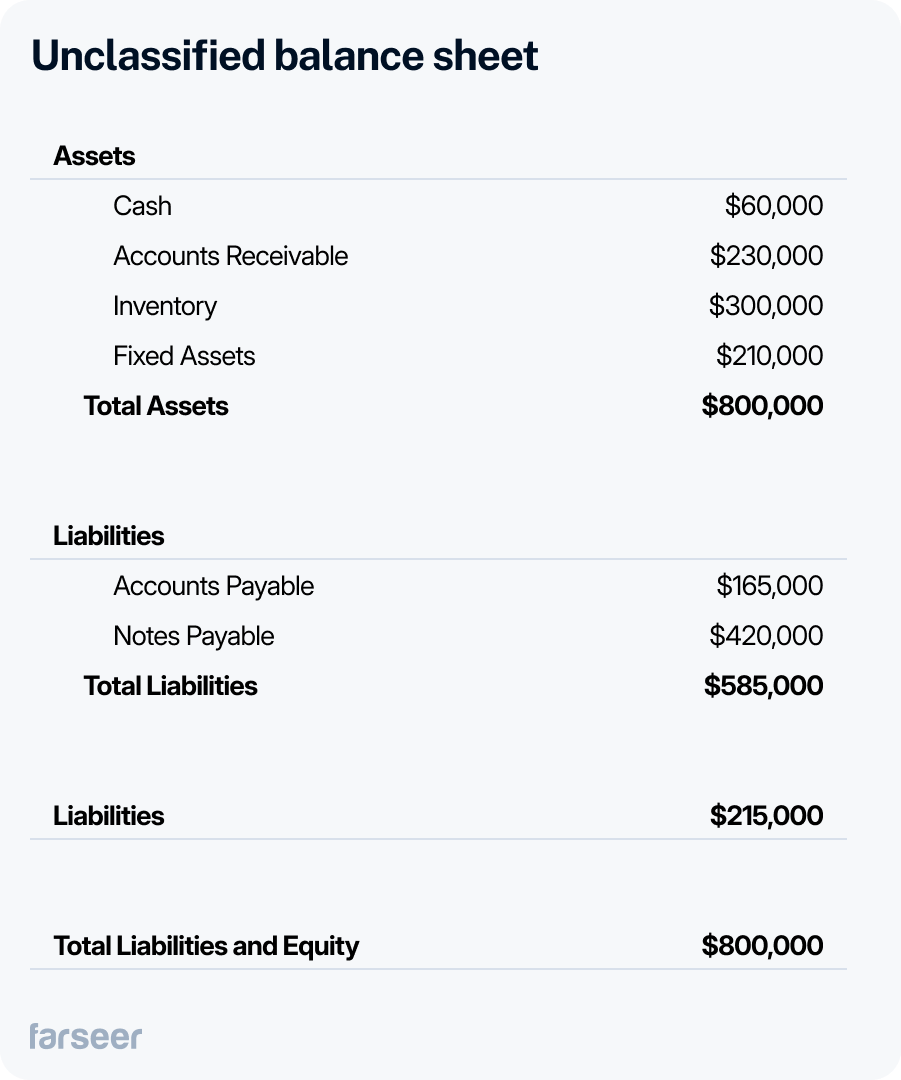
Classified vs Unclassified Balance Sheet
A classified balance sheet and an unclassified balance sheet present a company’s financial position differently. Here’s how they’re different:
- Structure and organization: A classified balance sheet breaks elements into subcategories, while an unclassified one lists total values.
- Readability and analysis: Classification allows easier analysis of liquidity and solvency.
- Use cases: Classified formats are standard in external reporting; unclassified ones are used in simpler or internal settings.
Read: What’s a Comparative Balance Sheet and Why You Need It
How to Prepare a Classified Balance Sheet
List Assets by Type — Split assets into current (cash, inventory, receivables) and long-term (equipment, patents, etc.). Add subtotals and total them.
List Liabilities by Term — Split liabilities into current (due within 1 year) and long-term (e.g., bonds payable). Again, subtotal and total.
Add Equity — Include items like common stock, retained earnings, and capital reserves. Sum for Total Equity.
Balance the Equation — Ensure Assets = Liabilities + Equity. If not, recheck for errors.
Format Cleanly — Use clear headings: “Current Assets,” “Long-Term Liabilities,” etc. Include subtotals and final totals. Add company name, statement title, and date.
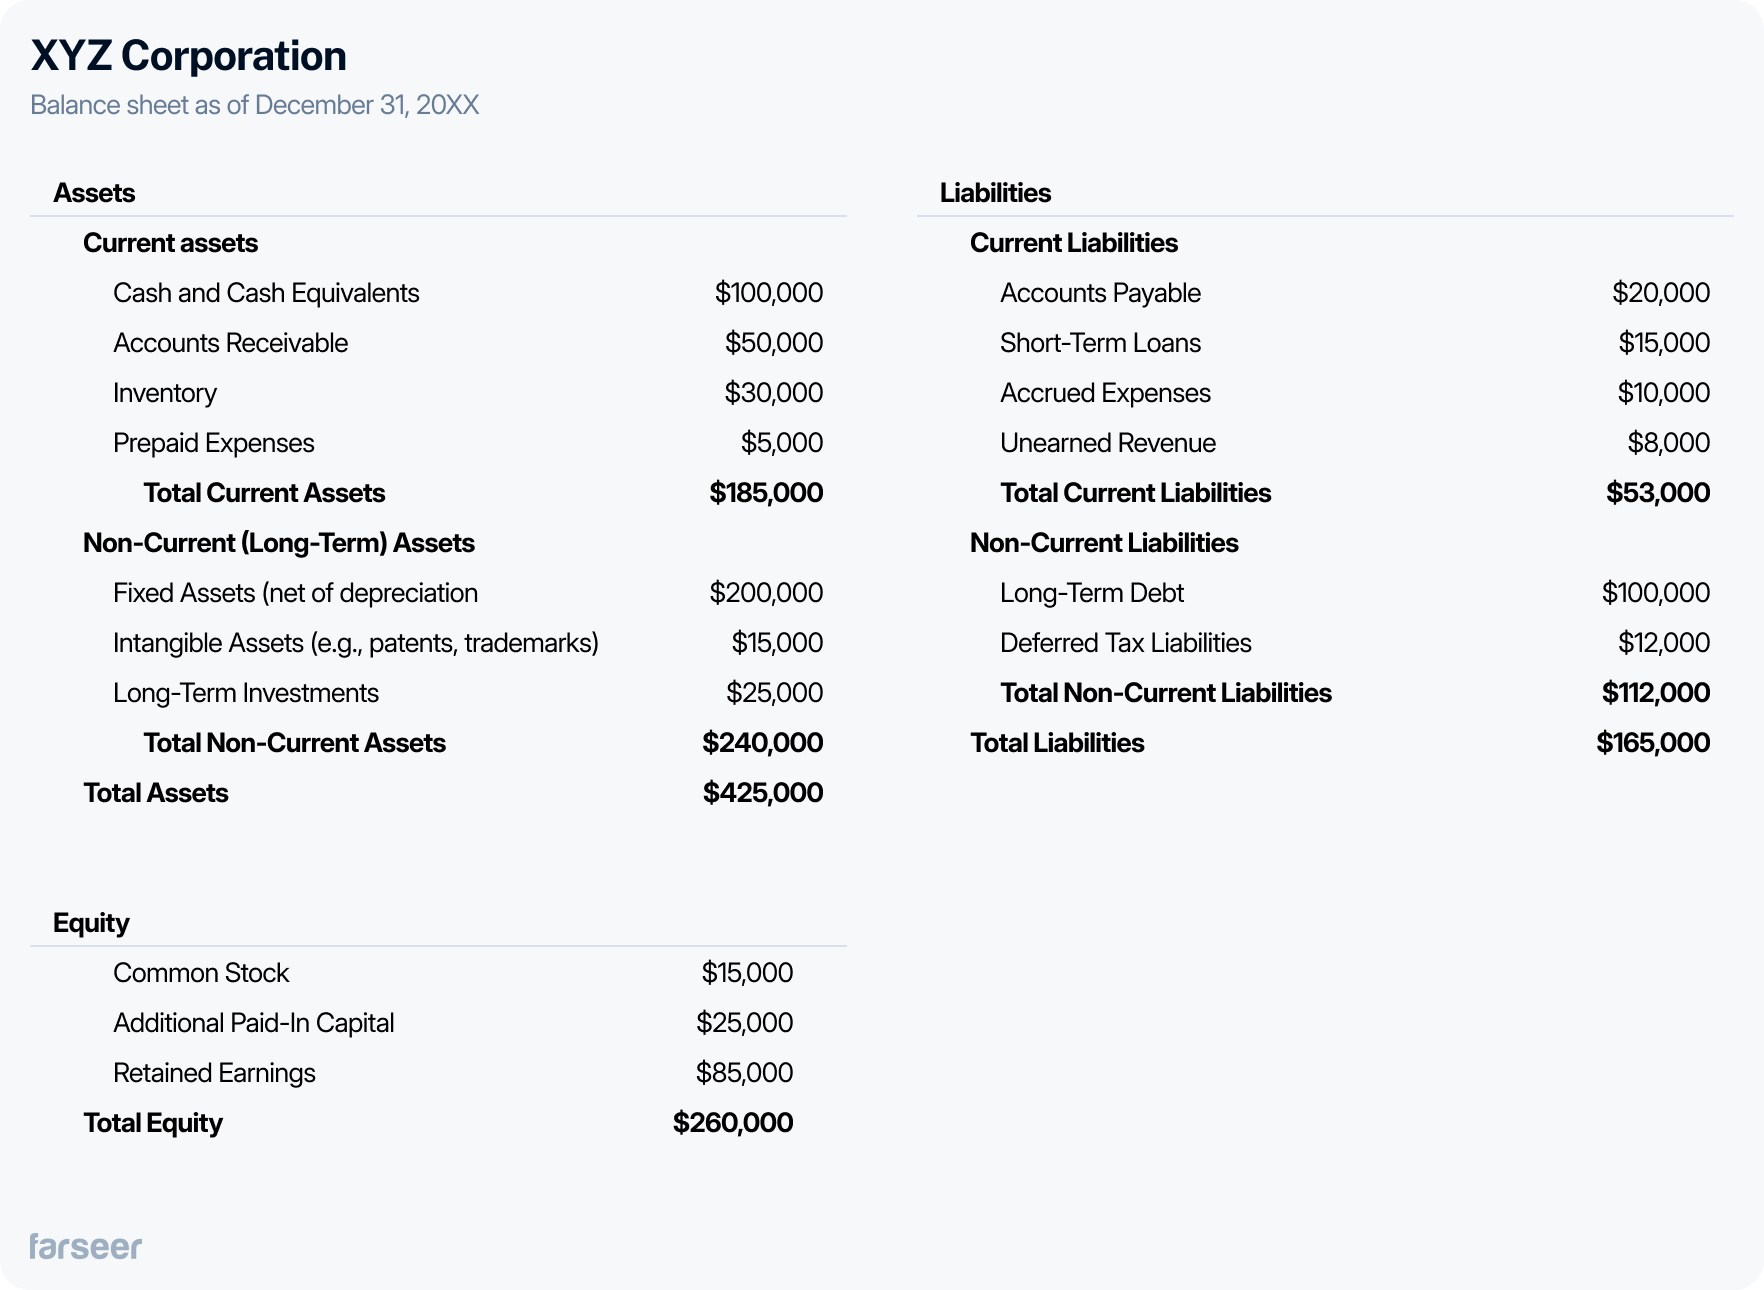
Classified Balance Sheet Example
Common Mistakes to Avoid in Classified Balance Sheets
Although a solid template exists for creating a classified balance sheet, several common errors should be avoided. The list below shows frequent mistakes and their negative impacts:
-
Misclassification of Assets and Liabilities: Improper assignment of assets and liabilities between current and long-term periods leads to misleading financial ratios because it distorts their time-based meaning. Categorize all elements by their correct time horizon to maintain accurate liquidity and solvency metrics.
-
Omitting Key Line Items: The balance sheet becomes incomplete and inaccurate if key items like accrued expenses, prepaid expenses, or intangible assets are left out. All relevant accounts must be in their proper sections to give stakeholders full financial transparency.
-
Inconsistent Classification Across Periods: Comparing results is difficult when classifications change between periods without explanation. Use consistent practices so users can analyze trends reliably.
-
Failure to Update for Depreciation and Math Errors: Not updating long-term assets for depreciation or amortization inflates values and distorts net asset reports. Always update values by the balance sheet date to stay accurate and compliant.
Basic addition mistakes can throw off the entire balance sheet. Confirm that Assets = Liabilities + Equity and double-check all subtotals. Even small errors can cause major reporting issues.
✅ Tip: Use a checklist or FP&A software to catch errors and maintain consistency.
Conclusion
If we have to choose between a classified and an unclassified balance sheet – the classified one will be more useful in almost any scenario. When you have a categorized overview of your business assets, liabilities, and equity, it’s much easier to get a picture of a company’s financial state, you can find specific info in a matter of minutes and potential problems are easy to spot.
Whichever the case – a correct balance sheet is a must, and what can help you in maintaining accuracy are tools like Farseer. It helps you track assets, liabilities, and equity without hustle, removing the need for manual entries. If you’d like to give it a try, feel free to book a demo with our experts, we’d be happy to provide more info on how to track your financial health better.
If you’re working with multiple reporting periods or need to standardize how different teams report balance sheet items, this free Excel balance sheet template can help. It includes Actuals, Plans, and Forecasts in the same structure – with auto-calculated ratios and clean monthly views built in.


Financial Statement Analysis: The Complete Guide (With Step-by-Step Process)
Read more
Best Financial Analysis Tools in 2026: Compare Features & Pricing
Read more