From Excel to Connected Planning: A Practical Migration Strategy for Finance Teams

If you lead an FP&A team, you have lived this scene. It is the third week of the budget cycle.
Someone just emailed a file called “Budget_v5_Round2_FINAL_FINAL.xlsx.”
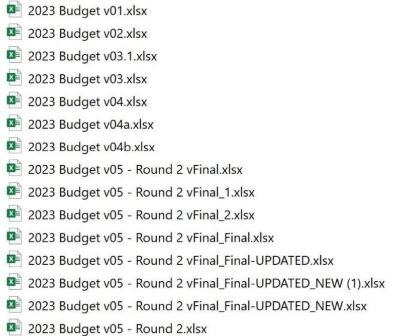
A driver got overwritten somewhere on a hidden tab. The CFO wants a fresh re-forecast by Friday. And you already know that half of Friday will be spent reconciling numbers instead of explaining them.
Read more: What Great Financial Reporting and Analytics Actually Look Like
This article is about getting out of that loop. Not by banning Excel entirely. But by moving the heavy lifting into a connected planning environment that finance actually owns.
We will walk you through what connected planning really means, how to know if you are ready, and a phased migration roadmap you can run without burning out your team. Along the way, we will show what each concept looks like inside a real FP&A platform, using Farseer as an example.
Let us get into it.
Why does this matter now?
Planning has changed. It used to be an annual event. Now it is closer to a continuous conversation that touches sales, operations, HR, and the board, often in the same week.
Spreadsheet-only workflows struggle with that pace. They were built for one analyst and one model, not for ten contributors updating shared assumptions in real time. The speed, the data volume, and the collaboration demand of modern FP&A all push past what a spreadsheet was designed to do.
CFOs have noticed. Many are actively moving their teams off Excel toward cloud planning platforms to gain collaboration, transparency, and productivity.
But let us be fair to Excel. It is not the villain. For most teams, Excel is the right place to start. It is just the wrong place to stay once you add multiple entities, more revenue lines, and more stakeholders who all want a say.
So, the goal is not “no spreadsheets ever.” That is a fantasy, and frankly nobody wants it. The goal is to move from fragile, siloed Excel models to a connected planning environment that becomes the backbone of how your business makes decisions. That is the migration we are going to plan.
Excel got you here. It will not get you to the next stage.
Let me say the nice part first, because it is true.
Finance loves Excel for good reasons. It is everywhere. It is flexible. It does not need a project plan to open. You can build a model in an afternoon and nobody has to approve it. Add PivotTables, XLOOKUP, Power Query, and a clean link into Power BI, and Excel can carry a planning process much further than people expect.
That flexibility is also a trap. Here is where it starts to break.
Complexity is the first trigger. The moment you add multiple entities or currencies, more product lines, and serious reporting demands from investors, the board, or regulators, your spreadsheet models start to strain. Each new requirement adds another tab, another link, another manual step.
Then come the operational symptoms. You know them well. Version chaos, where nobody is sure which file is final. Budget cycles that stretch for weeks. Overwritten cells and broken formulas that nobody catches until the numbers are already in front of leadership. Manual consolidations that eat entire days.
Collaboration is the next casualty. Excel is wonderful for one person. Once more than a handful of people need to input data, it turns into an email relay. You send templates out. You chase them down. You stitch them back together by hand. The process becomes the bottleneck.
And the real cost is hidden in plain sight. In spreadsheet-heavy teams, analysts spend most of their time gathering, cleaning, and structuring data. Very little time is left for the part that actually creates value, which is the analysis. You hired sharp finance people. They are doing Excel data plumbing.
So, the key point here: Excel helped you get here. Connected planning is how you get to the next stage.
What Connected Planning actually means for Finance?
Connected planning links people, data, and models across finance and the rest of the business so that plans and forecasts stay aligned in close to real time. Instead of isolated files sitting in each function, you have one central model that everyone works from. The drivers and assumptions are shared. When something changes, it changes everywhere at once.
Picture the difference.
In the spreadsheet world, your revenue model lives in one file, headcount in another, OpEx in a third, and the consolidated P&L in a fourth. Someone updates the hiring plan. Now three other files are wrong, and you may not find out until close.
vs
In a connected model, you change the hiring plan once. Salaries, the P&L, and the cash flow all update together.
Modern platforms make this possible through a few common capabilities. Multi-dimensional models. Built-in workflow so you know who has submitted what. Audit trails so you can trace numbers. And integrations into your ERP, CRM, and HRIS so actuals flow in without anyone retyping them. Many platforms now layer AI on top for forecasting and anomaly detection. Just remember that AI amplifies whatever you feed it. Good data and clean process get better. Messy data and broken process get worse, faster.
Read: How to Build a Headcount and Salaries Report: Step by Step
The benefits land squarely in the FP&A context. Planning cycles get shorter because actuals arrive automatically and models recompute at scale. Governance improves because security, role-based access, and data lineage cut down on spreadsheet anarchy. And cross-functional alignment finally becomes real, because you can connect the P&L to workforce, sales, and operational plans in one place.
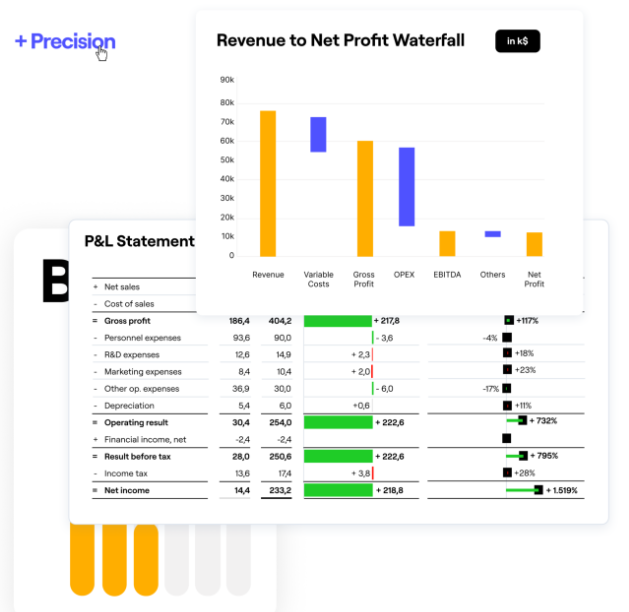
This is where it helps to see the concept in a tool. Take Farseer as an example. It is built around a single connected model where you change one driver and watch it flow through your full three-statement model. It ingests and standardizes data from your ERP, CRM, and HRIS into one source of truth, so you are not reconciling four systems by hand. That is connected planning made concrete. One model, shared logic, live data, instead of a folder full of files that argue with each other.
But the next obvious question is…
Are you actually ready to leave Excel?
Before you build a business case, run a quick readiness check. Migrating a clean process makes life better. Migrating a messy one just moves the mess into a more expensive home.
Start with the business and complexity triggers. Go through this list honestly.
- Does your budget process take more than six weeks end to end?
- Does your monthly closing and reporting take more than five working days?
- Do you operate across multiple entities, currencies, or regions?
- Do three or more finance people, or several functional stakeholders, contribute to plans?
- Have you already been burned by a material model error?
- Do you have new investor or board reporting demands, or an ERP change on the horizon?
A simple rule of thumb. If three or more of those are true, it is time to move.
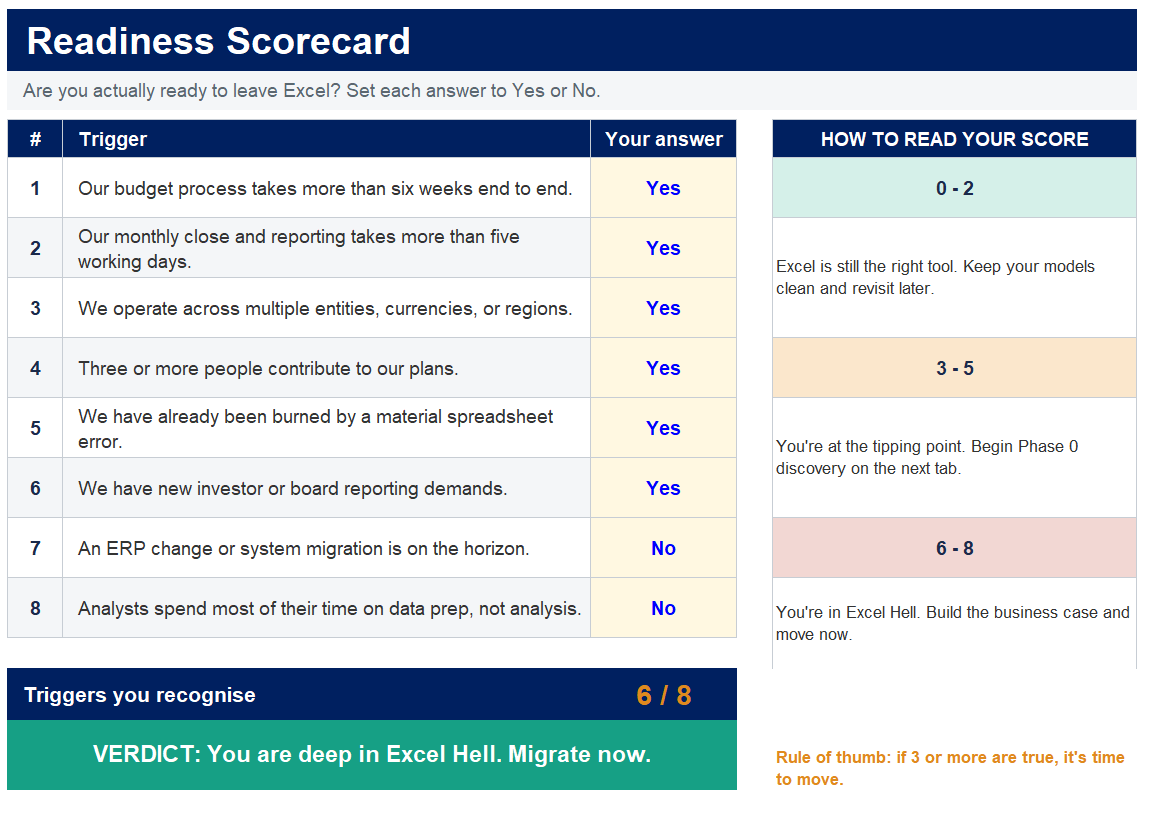
Not sure where you land? The free From Excel Hell to Heaven: Migration Blueprint has a readiness scorecard that does this for you. Tick the triggers and it scores whether it is time to move.
Download it here:
Next, check your data and process readiness. This is the part teams skip, and it hurts later. You need a reasonably clean and consistent chart of accounts and dimensional structure. If your dimensions are a mess, a new tool will faithfully reproduce that mess. You also need your core budgeting, forecasting, and reporting processes to be stable. New technology exposes broken processes. It does not fix it.
Finally, check the organizational mindset. Do you have leadership sponsorship, and a willingness to invest in change management rather than just licenses. And does everyone understand that even an initial phase is a two-to-three-month journey, not a two-week install. Set that expectation early. It will save you a lot of awkward conversations later.
If you have cleared most of these, you are ready. Now let us plan the move.
The phased migration roadmap
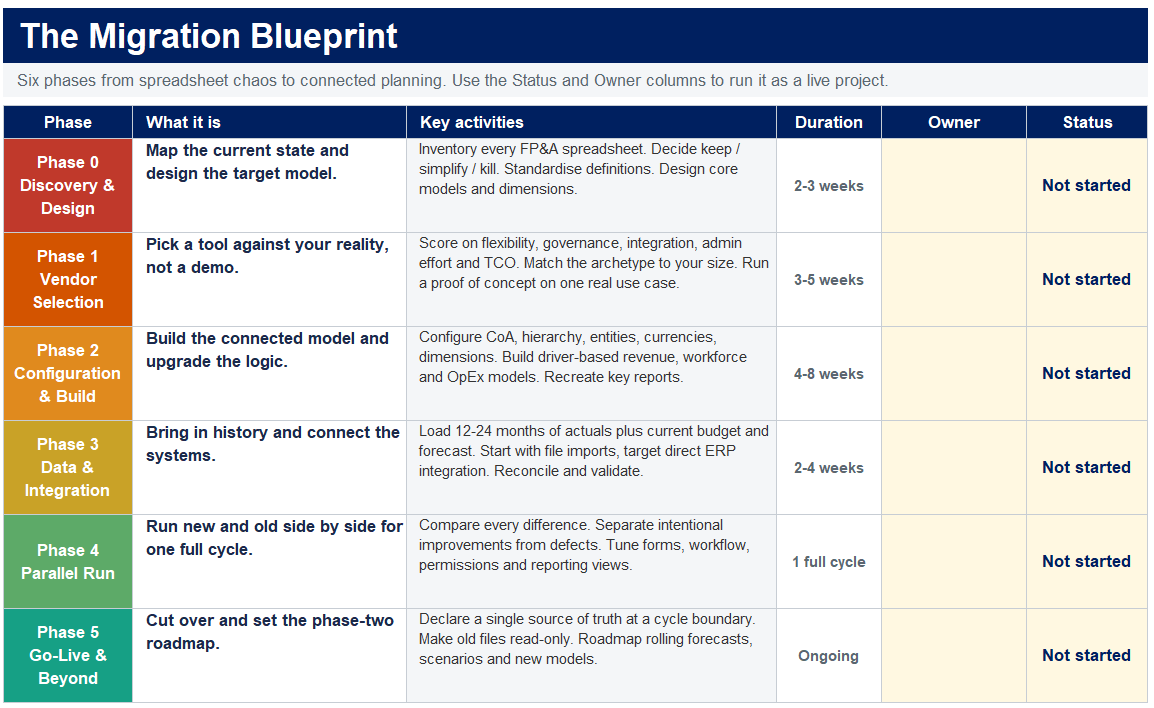
This is the heart of the whole thing. Resist the urge to do it all at once. A big-bang migration is the single most common reason these projects fail. Phase it.
Phase 0: Discovery and design
You cannot migrate what you have not mapped. So, start by inventorying every spreadsheet your FP&A function relies on. Budgets, forecasts, management reports, driver models, allocations. For each one, note the owner, the data sources, and the dependencies. This is tedious. Do it anyway. You will almost always find duplicate reports and forgotten files driving live decisions.
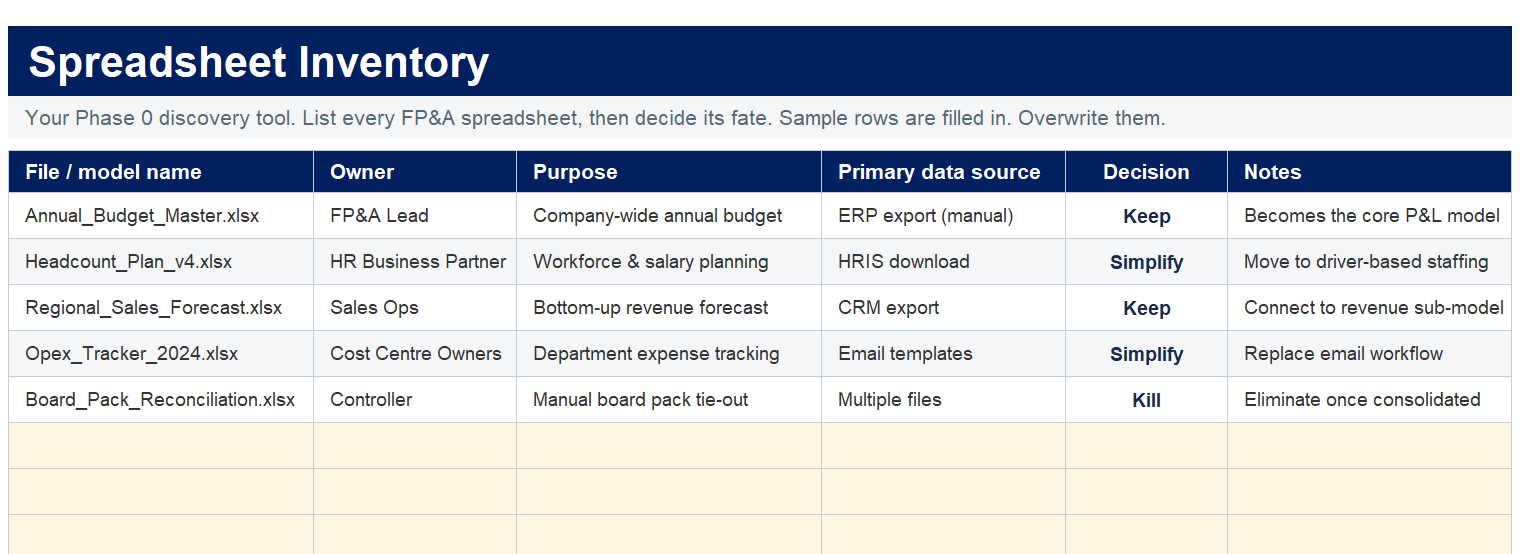
Then decide what to keep and what to simplify. Kill redundant reports. Consolidate line items that are too granular to matter. And standardize your definitions. Agree, in writing, what “headcount,” “bookings,” and “ARR” actually mean. You would be surprised how many teams quietly use three different definitions of the same word.
Now design your target model architecture. Define your core models, which are the P&L, balance sheet, and cash flow. Define your key sub-models, such as revenue, workforce, OpEx, Capex, and any SaaS metrics. And define your dimensions, which typically include entity, cost centre, product, customer, channel, scenario, and time.
Close Phase 0 by setting a tight scope and clear success criteria for Phase 1. Something concrete, like “deliver a working OpEx and headcount planning model for next year’s budget in the new platform.” Narrow scope is your friend.
Phase 1: Vendor Selection and Fit
Now pick a tool, but pick it against your reality, not a flashy demo. Evaluate on the criteria that will matter in eighteen months.
Look at modelling flexibility versus governance. You want both, but tools weigh them differently. Look at integration with your ERP, CRM, and HRIS. Look at the ease of administration, and ask the hard question. Will finance own this model, or will you be permanently dependent on IT and consultants for every change. Then weigh time to value and total cost of ownership.
Read: Finance Automation in 2026: Tools, Use Cases, and Real-World Strategy
There are cloud FP&A platforms aimed at the mid-market. There are heavyweight enterprise connected-planning suites built for large, global, multi-entity operations. And there are Excel-first platforms that keep the spreadsheet as the interface while centralizing data and controls underneath. Each archetype fits a different size and complexity of the team.
This is also where the trade-offs get real. The most powerful enterprise platforms are flexible, but that power comes with steep setup, a real learning curve, and ongoing dependence on dedicated admins or consultants. Small structural changes can take serious effort. For a lot of mid-market and growing enterprise teams, that is a heavy price for capability they may not fully use. The newer wave of no-code platforms is aimed squarely at that gap, letting finance build and change models without queuing a request and waiting two weeks for IT.
Whatever you shortlist, do not buy off a generic demo. Run a proof of concept on one high-impact use case with your own data. A real model on real numbers tells you more than any sales deck.
Phase 2: Configuration and Model Build
With a tool chosen, you build. For a standard mid-market implementation, configuration usually runs a few weeks, followed by model building and testing.
First, configure the core structures. Chart of accounts, organizational hierarchy, entities, currencies, and your custom dimensions. Get this layer right, because everything sits on top of it.
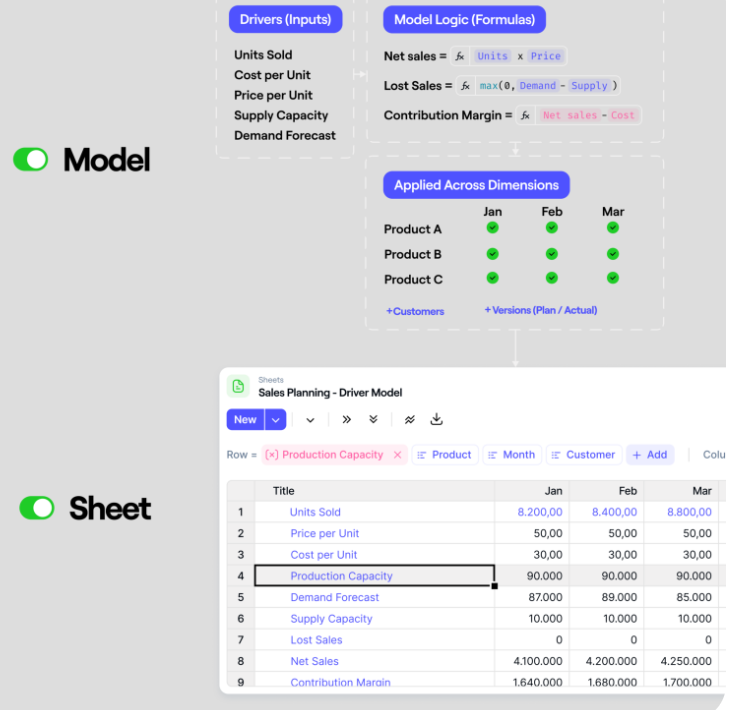
Then build your driver-based models for revenue, workforce, and OpEx. Treat the migration as a chance to upgrade your logic, not just copy it. Replace a hard-coded revenue line with volume times price. Replace a static headcount number with capacity-based staffing. This is the moment to fix the modelling shortcuts you have been living with for years.
Then build the reports and dashboards that mirror your key Excel outputs. This matters more than it sounds. When stakeholders open the new tool and recognize their familiar views, they relax. Familiarity plus a visible improvement is how you win early trust.
One design principle ties this whole phase together. Build for scale. Avoid hard-coding. Use consistent drivers and shared assumptions across models so the system stays maintainable as it grows.
Here is what that looks like in practice.
In Farseer, you build driver-based logic in plain business language, then changing any driver recalculates the connected P&L, balance sheet, and cash flow automatically. There are no broken formula chains to debug at midnight. Move an operational driver, and revenue, costs, and headcount flow through on their own. That is the difference between a model you maintain and a model that maintains itself.
Phase 3: Data Migration and Integration
Now bring in the data. Load at least 12 to 24 months of historical actuals. You need that history for trend analysis, seasonality, and a credible baseline forecast. Then load your current-year budget and latest forecast so there is no gap when you switch over.
Plan your integration in two stages. In the early phase, scheduled file imports are perfectly fine. They get you live. The longer-term goal is direct integration with your ERP and other systems, so actuals load automatically and nobody is exporting CSVs by hand every month.
Do not rush past data quality. Map your fields carefully. Run reconciliations. Build validation checks. The fastest way to lose credibility with a new platform is to present a number that does not tie to the ledger in week one. Earn trust by tying out first, then turn on the fancy features.
Phase 4: Parallel Run and Validation
Resist the temptation to flip the switch immediately. Run the new platform alongside your existing Excel models for at least one full budgeting or reporting cycle.
The point of the parallel run is to compare outputs and explain every difference. When the numbers diverge, you have to ask why. Is it an intentional improvement, like a better driver you deliberately introduced? Or is it a genuine defect. You need to be able to say which, with confidence, for each gap.
Use this window to tune the experience too. Clean up form layouts. Simplify workflow steps. Set user permissions correctly. Refine the reporting views. The parallel run is your last calm moment before go-live. Spend it making the tool pleasant to use, not just correct.
Phase 5: Go-live, Hardening, and The Phase-Two roadmap
Pick your cutover moment with intent. A natural cycle boundary works best. The start of a new fiscal year, or the start of a new forecast cycle. That is when you declare the new platform the single source of truth.
Keep the old spreadsheets around as read-only reference for a short, defined period. But be firm about the rule. All new inputs and changes happen in the platform. If people can still edit the old files, some of them will, and your single source of truth quietly splits in two.
Then publish a phase-two roadmap. Migration is not the finish line. It is the foundation. The roadmap should sketch the next models you will add, such as sales planning, supply chain, or deeper workforce planning. It should cover deeper integrations. And it should point toward more advanced capabilities like rolling forecasts and AI-assisted scenarios.
A few war stories worth heeding, because I have watched them happen. Teams that scope Phase 1 too big stall out. Teams that underestimate data prep blow their timeline. And teams that build wildly complex models in Phase 1 end up with something nobody but the builder can maintain. Keep it lean. You can always add later.
People and Change Management: Driving Adoption
Here is the uncomfortable truth about these projects. Technology is rarely what kills them. People are.
The most common pitfall is believing the tool will fix everything on its own. It will not. A new platform makes a broken process more visible, which can feel worse before it feels better. The second pitfall is underinvesting in training and communication. When that happens, people quietly revert. They export to Excel, build a side model, and now you have shadow spreadsheets undermining the whole effort.
So, get ahead of it. Engage your stakeholders early. Pull your finance business partners, your key budget owners, and your power users into the design and testing. People defend what they helped build. Resistance drops when the tool feels like theirs.
Aim Phase 1 at a visible, undeniable win. Cut the budget cycle time in half. Simplify a painful template. Deliver a headcount plan that managers actually trust. One clear success buys you the goodwill to push further.
And layer your enablement. Give role-based training, because contributors, approvers, and admins need different things. Provide cheat sheets and short videos for the moments people forget a step. And run office hours during the first full cycle on the new platform, when questions peak and frustration is highest.
There is a bigger shift underneath all of this. As connected planning matures, the FP&A role itself changes. Less time on spreadsheet mechanics. More time on scenario design, on telling the story behind the numbers, and on partnering with the business. That is the upgrade you are really selling to your team. Not new software. A better job.
Read: FP&A Software for Modern Finance Teams: Compare the Best Tools in 2026
Mapping the Technology Landscape
You do not need to memorize every vendor. You need to recognize the patterns, because the patterns are what map to your situation.
There are cloud FP&A platforms built specifically for planning, forecasting, and analysis, with driver-based models, rolling forecasts, collaboration, and integrations. These suit mid-market companies that want to standardize FP&A and connect to their ERP and CRM without taking on a heavyweight enterprise suite.
There are enterprise connected-planning suites built for large-scale, cross-functional, multi-entity planning, often with consolidation and deep governance baked in. These fit complex global organizations that have the appetite and the admin capacity for a serious implementation.
And there are Excel-first platforms that keep the spreadsheet, or Google Sheets, as the front end while centralizing data and workflow underneath. These are a smart bridge for teams that are deeply invested in spreadsheet skills and want connected planning benefits without abandoning their muscle memory overnight.
The honest advice is to match the archetype to your size, your complexity, and your internal capacity to run it. A tool that is too heavy for your team is just as much a failure as one that is too light. The right fit is the one your finance team can own and grow into, not the one with the longest feature list.
Measuring success after go-live
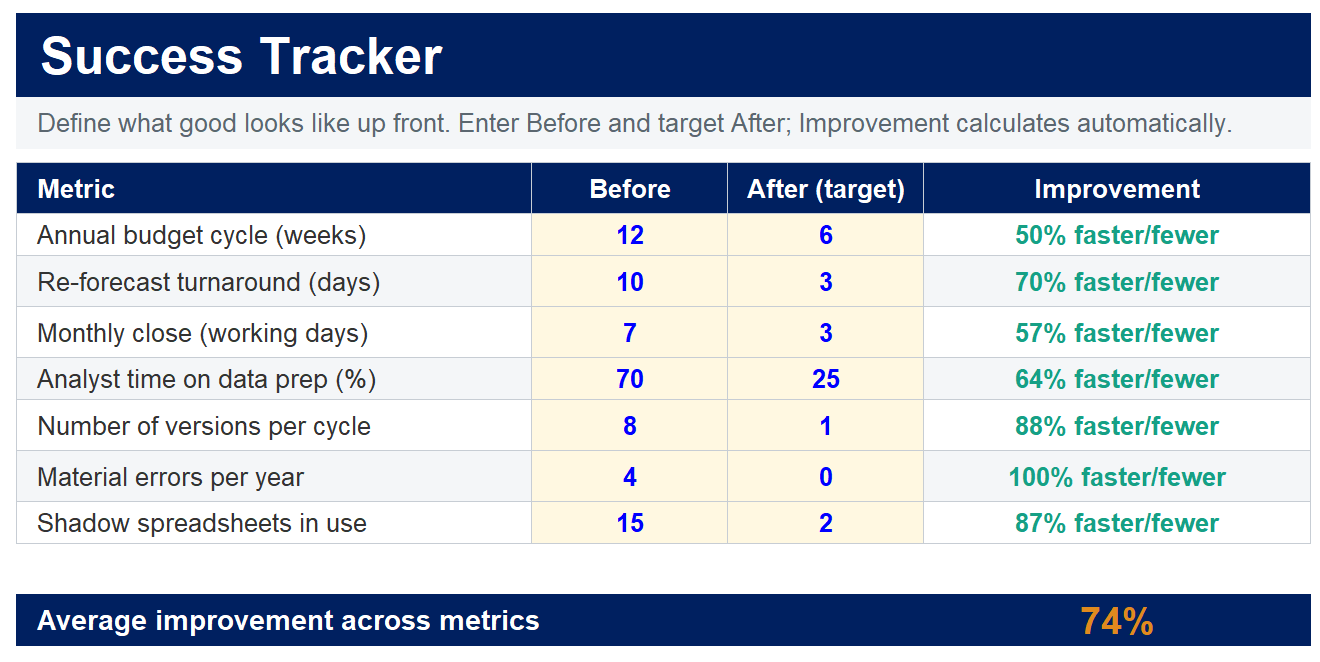
How do you know it worked? Define that before you start, not after, and measure it in three buckets.
Start with operational and efficiency metrics. The clearest signal is cycle time. An annual budget that drops from twelve weeks to six. A re-forecast that goes from ten days to three. Alongside that, watch where your analysts’ hours go. The win is more time on analysis and partnering, less time on manual data prep. If your team is still drowning in data cleaning, the migration has not landed yet.
Read: Budgeting vs Forecasting: Key Differences, When to Use Each, and How to Integrate Both
Then look at quality and governance metrics. Fewer material errors and restatements tied to planning process issues. Better data consistency between finance and operational systems. These are less glamorous than cycle time, but they are what let you sleep at night before a board meeting.
Finally, measure business impact, which is the whole point. Can you re-forecast quickly when the market moves, whether that is a demand shock, a pricing change, or a hiring freeze. And do leaders actually trust the numbers now. The clearest evidence of trust is the disappearance of shadow spreadsheets. When people stop building their own offline versions, you have won.
This is where a connected model proves its worth.
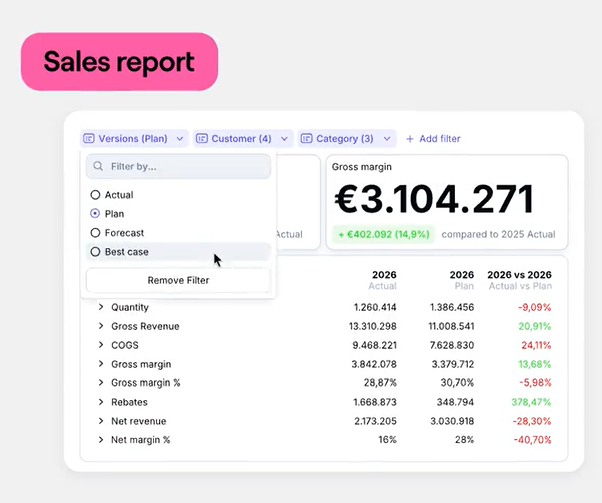
In Farseer, scenario planning means changing any assumption and seeing the full financial impact instantly, with scenarios sitting side by side in the same model. Rolling forecasts update key drivers and roll the forecast forward without rebuilding anything. So, when leadership asks “what if we delay forty hires by a quarter,” you do not promise an answer by Thursday. You show it on the screen. That capability is exactly what converts sceptical executives into believers.
One last piece of advice. Treat the first year as an optimization period, not a finished project. You will keep tuning models, adding scope, and refining workflow. The teams that get the most value are the ones that keep iterating instead of declaring victory and walking away.
The New role of FP&A in a Connected world
Step back and the real story comes into focus. Moving from Excel to connected planning was never really about the tool. It is about repositioning finance.
You are not just swapping a spreadsheet for software. You are turning FP&A into the orchestrator of planning across the entire business. The team that used to assemble the numbers now owns the conversation about what they mean.
With the right platform and real governance underneath, your people get to spend their energy on the work that actually matters. Designing scenarios. Challenging assumptions. Guiding decisions while there is still time to influence them, instead of explaining them after the fact.
And the bar keeps rising. AI-enabled, connected planning will only get more capable, more predictive, and more deeply woven into how businesses run. A platform like Farseer points at where this is heading, where finance builds and controls sophisticated models without code, and the system does the heavy computation in the background.
The teams that build this foundation now will be the ones ready for whatever comes next. So, map your spreadsheets. Run your readiness check. Pick your phase-one win. And take the first real step out of the file called “Budget_v5_Round2_FINAL_FINAL.xlsx”.
Your future self, the one who is not reconciling tabs at 9pm on a Friday, will thank you.

FAQ
What is connected planning in FP&A?
Connected planning is an approach that links financial plans, operational plans, and business data within a single planning platform. Instead of managing separate spreadsheets for revenue, headcount, and expenses, connected planning keeps all models connected so changes flow automatically across forecasts, budgets, and reports.
What is the difference between connected planning and Excel?
Excel is a powerful modelling tool, but it often relies on separate files, manual updates, and spreadsheet links. Connected planning platforms centralize data, automate calculations, support collaboration, and provide a single source of truth for budgeting, forecasting, and reporting.
When should a finance team move from Excel to connected planning?
A finance team should consider moving from Excel when budgeting cycles become lengthy, multiple stakeholders contribute to forecasts, manual consolidations consume significant time, or reporting complexity increases due to multiple entities, products, currencies, or regions.
What are the benefits of connected planning?
The key benefits of connected planning include faster budgeting and forecasting cycles, improved collaboration, better data governance, reduced spreadsheet errors, real-time reporting, and stronger alignment between finance and operational teams.
How does connected planning improve financial forecasting?
Connected planning improves financial forecasting by linking business drivers directly to financial outcomes. When assumptions change, forecasts automatically update across revenue, expenses, cash flow, and financial statements, reducing manual effort and improving forecast accuracy.
What are the signs that your FP&A team has outgrown Excel?
Common signs include version-control issues, broken formulas, lengthy budget cycles, manual consolidations, multiple disconnected models, increasing reporting requirements, and limited visibility across departments. These challenges often indicate the need for a connected planning platform.
How long does it take to migrate from Excel to a connected planning platform?
Most finance teams can complete an initial connected planning implementation within two to six months, depending on business complexity, data quality, integration requirements, and the scope of the first deployment phase.
What should be included in a connected planning implementation roadmap?
A connected planning implementation roadmap typically includes process assessment, model design, vendor selection, data migration, model configuration, integrations, user testing, parallel runs, go-live planning, and post-implementation optimization.
What software is used for connected planning?
Organizations use connected planning software such as Farseer, Anaplan, Jedox, Pigment, Adaptive Planning, and other FP&A platforms. These tools help finance teams manage budgeting, forecasting, scenario planning, reporting, and collaboration from a centralized model.
How do connected planning platforms support scenario planning?
Connected planning platforms allow finance teams to create multiple scenarios using the same underlying model. By changing assumptions such as pricing, hiring, sales growth, or operating costs, users can instantly compare scenarios and understand the financial impact before making decisions.