The 5 Why Technique: How FP&A Teams Find the Root Cause of a Variance

Picture the monthly review. The deck is up on the screen. Revenue came in below plan, and the room goes quiet. Someone says, “Revenue missed by 8 percent.” Someone else nods. A third person adds, “Yeah, the XYZ department was soft.” And then everyone moves to the next slide.
That is the moment most variance analysis dies. Not because the finance team is lazy. Because nobody asked the one question that actually matters. Not “what happened,” but “why.”
Read more: What Great Financial Reporting and Analytics Actually Look Like
This is exactly where the 5 Why technique earns its place in an FP&A toolkit. It is simple. It is almost embarrassingly low-tech. And when you use it well, it turns a vague “revenue was soft” into a specific, fixable root cause that leadership can act on.
Let me walk you through how it works, why FP&A teams keep stopping one layer too early, and how the right tooling turns this from a whiteboard exercise into something you can run on live numbers.
What Is the 5 Why Technique?
The 5 Why technique is a root cause analysis method. You start with a problem. Then you ask “why” did it happen. You take the answer, and you ask “why” again. You repeat this around five times until you hit something fundamental.
The idea came out of Toyota. Sakichi Toyoda developed it, and Taiichi Ohno made it a core part of the Toyota Production System. Most people fix symptoms. They wanted to fix causes. So, they trained engineers to keep asking “why” until the surface explanation fell away and the real driver showed up.
The number five is not magic. Sometimes you need three whys. Sometimes you need seven. Five is just the rough number it usually takes to move from “the thing we noticed” to “the thing that actually caused it.”
Here is the key principle for finance people. The first answer to a variance is almost never the root cause. It is a restatement of the problem in slightly more detail. Real insight lives three or four layers down.
Read: The CFO’s Guide to Profitability Analysis Software (+Tool Recommendations)
Why FP&A Teams Stop Too Early
Variance analysis is bread and butter for FP&A. You compare actual to plan. You compute the gap. You write commentary. You ship the board pack.
The problem is that most variance commentary stops at the first “why.” It tells you what moved, not why it moved.
Think about how a typical variance note reads. “Revenue was 8 percent below budget due to lower volumes in the XYZ category.” That sounds like analysis. It is not. It is a description. It tells leadership the same fact they already saw in the number, just with a category name attached.
A CFO does not need you to confirm that revenue was soft. They can read the variance column. What they need is the answer to “so what do we change.” And you cannot answer that until you have peeled back the layers.
Read: Real-Time Reporting: Why Excel Isn’t Enough
There are a few reasons teams stop early. Time pressure is the big one. Month end close time is brutal, and getting to the root cause work feels like a luxury. There is also a comfort factor. The first explanation is usually the easiest to defend, so people grab it and move on. And honestly, a lot of finance data lives in a tangle of spreadsheets, which makes digging into the next layer genuinely painful.
The 5 Why technique fixes the discipline problem. It forces you past the comfortable first answer. The tooling, which we will get to, fixes the pain problem.
A Practical Example Every FP&A Person Will Recognize
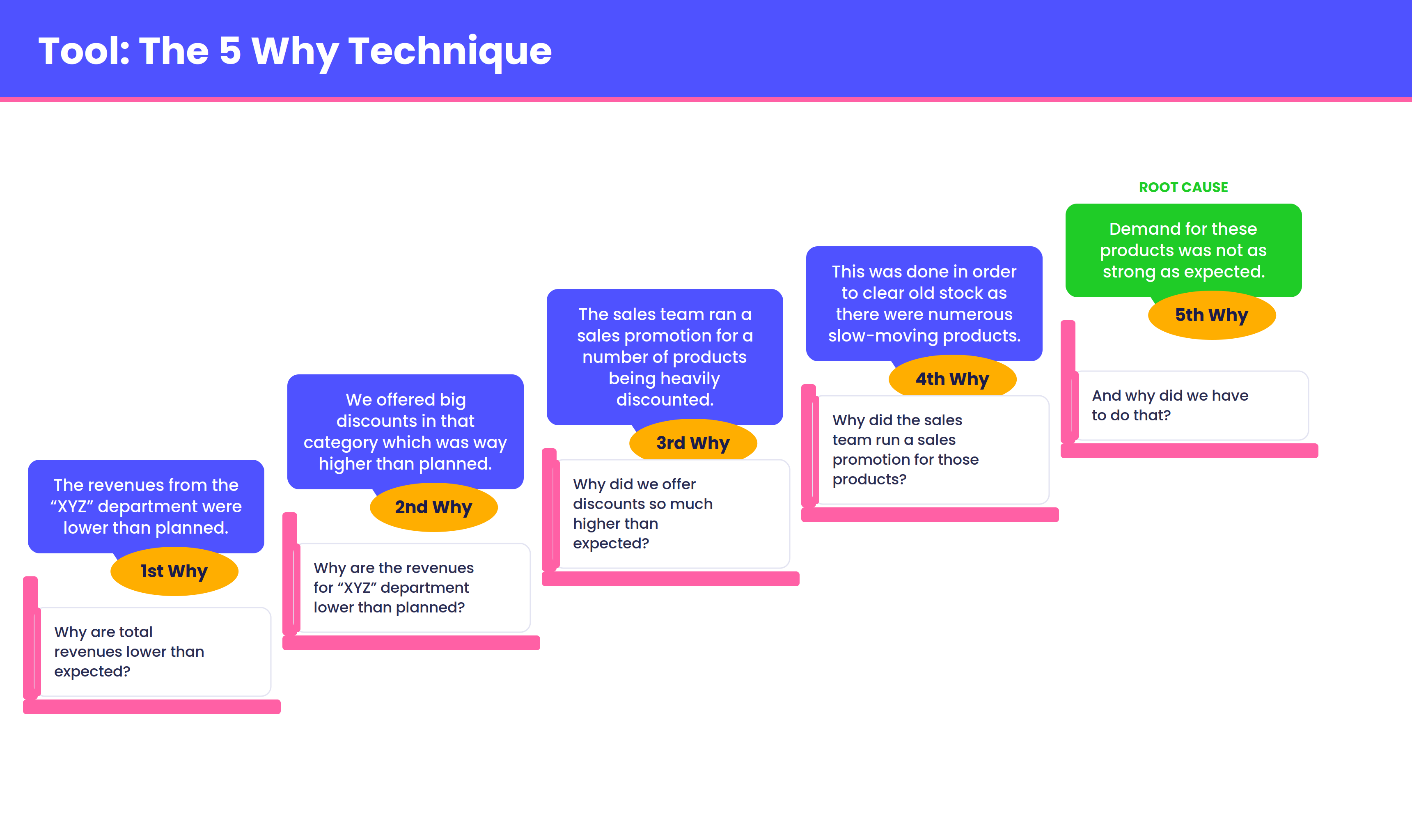
Let me use the classic case. Total revenue came in below plan. Here is how the conversation should go.
First Why. Why are total revenues lower than expected?
Because revenues from the XYZ department were lower than planned. Notice that this is just localizing the problem. We have gone from “total revenue” to “XYZ department.” Useful, but nowhere near a root cause.
Second Why. Why are revenues for the XYZ department lower than planned?
Because we offered big discounts in that category, and the discounting was way higher than planned. Now we are getting somewhere. The volume might have been fine. The issue was price realization.
Third Why. Why did we discount so much more than expected?
Because the sales team ran a promotion on a number of products, and those products were heavily discounted. We have moved from “discounts happened” to “a deliberate promotion drove the discounts.”
Fourth Why. Why did the sales team run that promotion?
Because they needed to clear old stock. There were a lot of slow-moving products sitting in inventory. Interesting. The revenue miss is now connected to an inventory problem. That is not where anyone expected to land when they saw the revenue number.
Fifth Why. And why did we have to clear that stock?
Because demand for those products was not as strong as expected. There it is. The root cause is not “discounting.” It is not even “the promotion.” It is a demand forecasting miss. We bought or built inventory for demand that never showed up, and everything downstream was a reaction to that.
If you had stopped at the first why, your action item would have been “watch revenue in XYZ.” Pointless. If you had stopped at the second why, your action would have been “reduce discounting,” which would have left you stuck with dead stock and an even bigger write-down. The real fix lives at the fifth why. Improve demand planning for that product group, tighten the link between forecasting and purchasing, and rethink the product mix.
One root cause analysis turned a vague revenue miss into three concrete actions for three different teams. That is the whole point.
Read: How to Perform Account Analysis: A Step-by-Step Guide for FP&A Teams
The Mindset Shift: From "What Changed" To "Why It Changed"
The biggest unlock here is not a technique. It is the mindset.
FP&A often gets framed as a measurement function. You measure the plan, you measure the actual, you measure the gap. Measurement is necessary. It is not sufficient.
The 5 Why technique pushes you toward a causal mindset. You stop treating variances as facts to report and start treating them as symptoms to diagnose. A good FP&A analyst behaves a bit like a doctor. The fever is not the disease. The variance is not the problem. It is the signal that something underneath needs attention.
This shift changes your relationship with the business too. When you walk into a meeting and say “revenue was soft,” your business stakeholders tune out, because you have told them nothing they did not know. When you walk in and say “revenue was soft because our demand plan for the XYZ line was 30 percent too high, which triggered clearance discounting,” now you are a partner. You are not scoring the business. You are helping it see itself.
How To Run A 5 Why Technique In FP&A
You need a clear problem statement and the discipline to keep asking. Here is a practical way to run it.
Start with a sharp, specific problem statement. “Revenue is down” is too vague. “Q3 net revenue was 8 percent below budget, driven by the XYZ category” is something you can actually interrogate.
Anchor every “why” in data, not opinion. This is the difference between root cause analysis and a guessing session. When you ask why XYZ revenue fell, do not accept “the market was tough.” Pull the bridge. Was it volume, price, or mix? Each answer should point to a number you can verify.
Follow one chain at a time. A single variance can have several causes. That is fine. Run the 5 Why on the biggest driver first, then come back and run it again on the next one. Do not try to chase five branches at once, or you will end up with a tangle and no conclusion.
Stop when you hit something actionable and within your control. The root cause should be something you can do something about. If your fifth why lands on “interest rates rose,” you have gone too far. Back up to the layer your business can actually influence, like “we did not hedge our floating rate exposure.”
Write the chain down. The chain itself is the deliverable. It shows your reasoning, it survives scrutiny, and it gives the next analyst a head-start when the same variance shows up again.
4 Common Mistakes When Using the 5 Why Technique
This technique is simple, which means it is easy to do badly. Watch for these traps.
The first is stopping at a person. If your chain ends with “because Dave in sales approved the discount,” you have not found a root cause. You have found a scapegoat. Push past it. Why was Dave able to approve a discount that large without a flag? Now you are looking at a control gap, which is fixable. People are rarely the root cause. Processes and incentives usually are.
The second trap is accepting answers without evidence. Each “why” is a hypothesis. It needs a number behind it. If you cannot point to the data, you are not analyzing. You are storytelling.
The third trap is single-cause tunnel vision. The 5 Why follows one chain, which is its strength and its weakness. Big variances often have several contributing causes. If your gut says there is more going on, pair the 5 Why with a fishbone diagram or a driver tree to map the full picture, then drill down each major branch.
The fourth trap is treating five as a rule. Stop when you reach a genuine root cause, whether that takes three whys or six. Counting to five and quitting defeats the purpose.
Where The Spreadsheet Starts Fighting You
The 5 Why technique is easy to describe and hard to do in a spreadsheet-heavy environment.
Think about what each “why” actually demands. To answer “was it volume, price, or mix,” you need to slice the same revenue figure several ways. To confirm “the promotion drove the discounting,” you need to tie discount data to specific SKUs and a specific time window. To reach “demand was weaker than expected,” you need to compare the original forecast against actuals at the product level, then connect that to inventory and purchasing data.
In a typical spreadsheet stack, that data lives in five different files owned by four different people. By the time you have gathered it, reconciled it, and built the bridge, the close is over and the meeting has come and gone. So, the analysis stops at the first why, not because the analyst lacks curiosity, but because the next layer is buried under hours of manual data wrangling.
Read: How Balance Sheet Software Automates Reporting (+ Top Tools)
This is the quiet tax on FP&A. The thinking is the easy part. The data plumbing is what kills it.
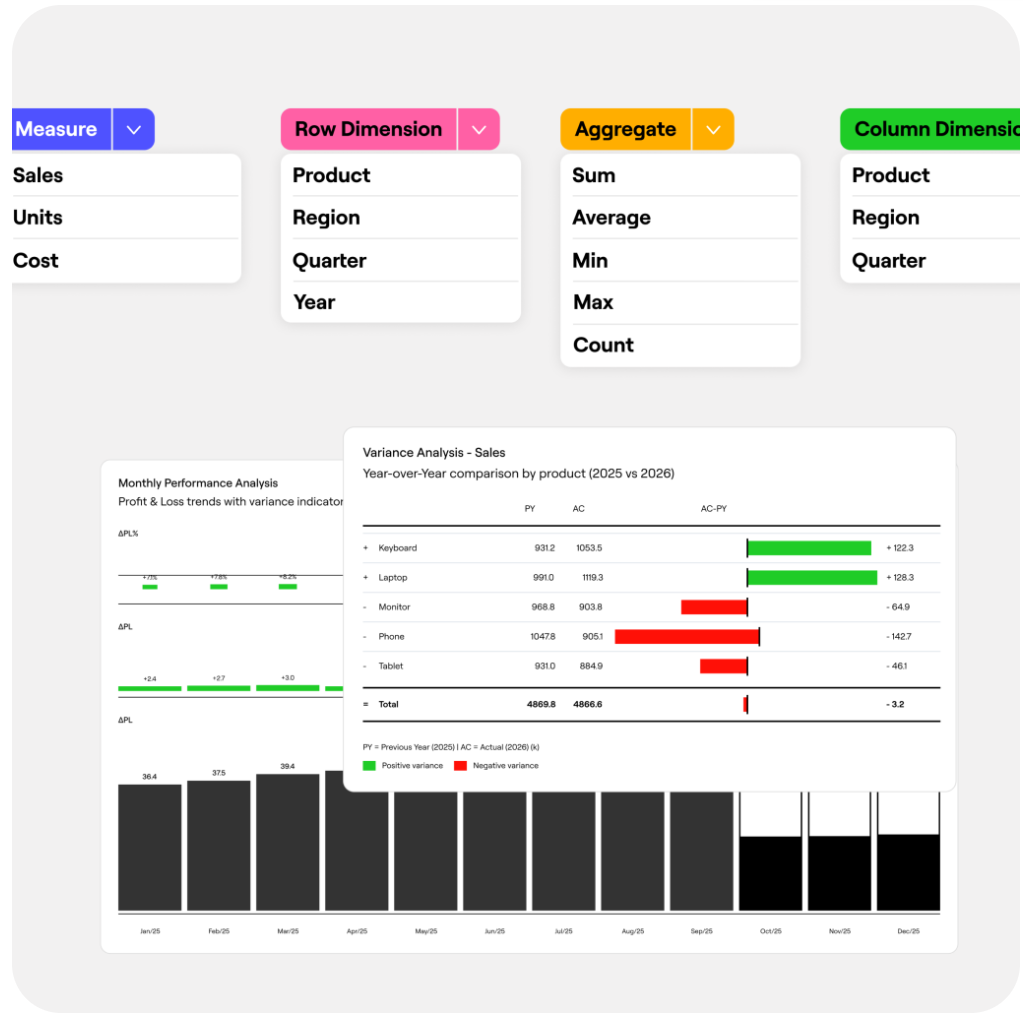
This is also where modern BI and reporting platforms change the equation. With Farseer’s BI & Reporting solution, finance teams can consolidate ERP data into a single reporting model, eliminating manual spreadsheet consolidation. Instead of spending hours gathering and reconciling data before analysis begins, analysts can focus on investigating variances and uncovering the business drivers behind them.
Running The 5 Why Inside An FP&A Tool
Let me show what each step of our XYZ example looks like when the data is connected, rather than scattered.
First why, in the tool. You see the consolidated revenue variance on a live dashboard. Instead of waiting for someone to email you the category breakdown, you drill straight into the revenue line. The XYZ department lights up as the biggest contributor in seconds.
Second why. You decompose the XYZ variance into volume, price, and mix without rebuilding a bridge by hand. The price effect dwarfs the volume effect. Discounting is the culprit, and you knew that without leaving the screen.
Third and fourth why. Because planning data and operational drivers sit in the same model, you can connect the discount spike to the specific products on promotion, and then connect those products to the inventory position that triggered the clearance. In a spreadsheet world, this is three separate file pulls. In a connected model, it is a drill-down.
Fifth why. You compare the original demand forecast for those products against what actually sold. The gap is obvious. Demand was overestimated, and every downstream action was a reaction to that single planning error.
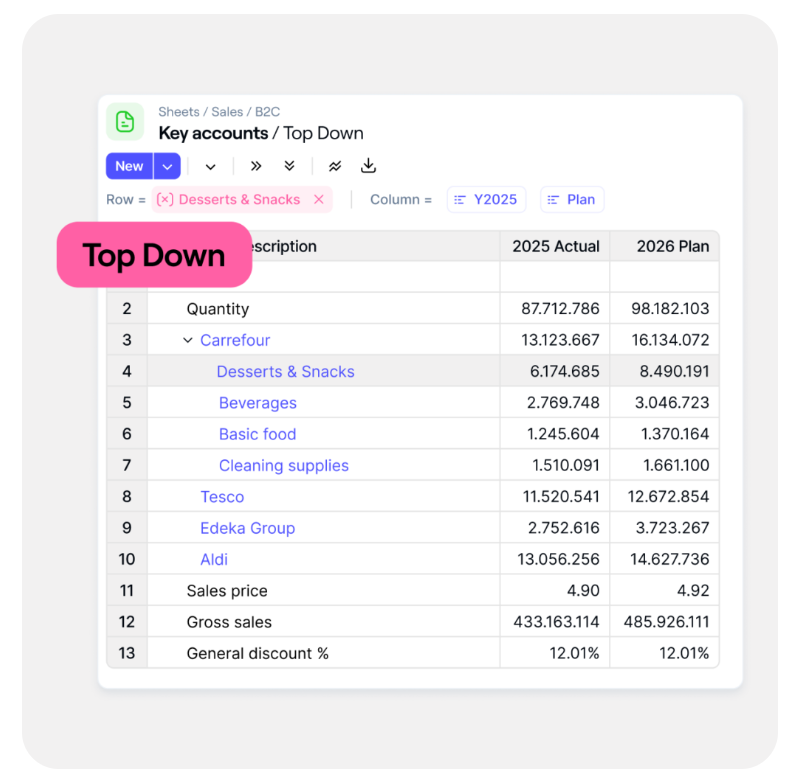
This is where Farseer’s BI & Reporting solution adds value. Interactive dashboards and drill-down reporting let finance teams move seamlessly from a top-line variance to the underlying account, product, customer, or operational driver. Instead of rebuilding reports in spreadsheets, analysts can investigate each “why” using live, connected data.
There is a forward-looking angle too. Tools in this category increasingly flag anomalies and driver changes automatically. Rather than waiting for the monthly review to notice that discounting spiked, an anomaly alert can surface as it happens. That means you start your 5 Why earlier, sometimes before the variance even fully lands in the results. Root cause analysis stops being a post-mortem and becomes something closer to real-time diagnosis.
Read: How to Create a Monthly Financial Report in 7 Easy Steps
Combining The 5 Why Technique With Other Tools
The 5 Why is not meant to work alone. It plays well with the rest of the FP&A toolkit.
Use a driver tree to map the full structure of a variance first. The tree shows you every branch that feeds the number. Then point your 5 Why at the branch carrying the most weight. The tree gives you breadth. The 5 Why gives you depth.
Use a fishbone diagram when you suspect multiple causes from different categories, like people, process, systems, and external factors. Sketch the categories, then run a 5 Why down each major bone. This stops you from tunnelling on one explanation when reality is messier.
Pair it with a variance bridge. The bridge quantifies each piece of the gap. The 5 Why explains the biggest piece. Numbers plus narrative is what makes board commentary land.
Once you’ve identified the root cause, use the DERP (Define-Explain-Recommend-Project) Framework to structure your variance commentary. The 5 Why uncovers why the variance happened; DERP helps communicate the finding, recommend actions, and project the expected business impact.
The thread through all of these is the same. You need your data connected so you can move between the breadth view and the depth view without rebuilding everything by hand each time. A platform that holds your plans, actuals, and drivers in one place is what makes that fluid movement possible. It is the difference between an analyst who spends the day reconciling and one who spends the day reasoning.
Read: Financial Data Quality Management: A Practical Framework for FP&A Teams
A Simple 5 Why Template You Can Steal
Keep this in your back pocket for the next variance review.
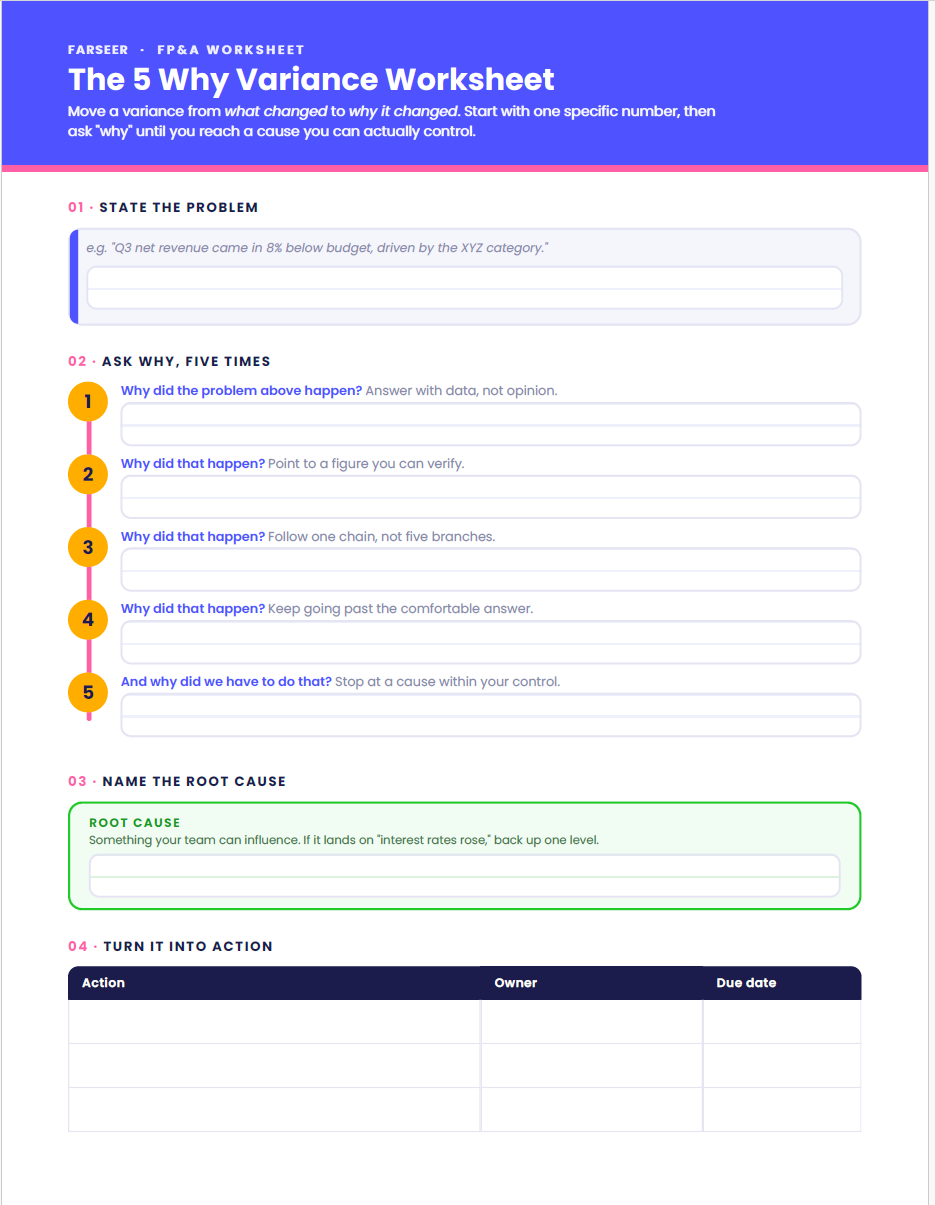
Download the 5 Why Variance Worksheet here and give every analyst a consistent framework for uncovering root causes and turning insights into action:
- State the problem in one specific sentence, with a number attached.
- Ask why it happened. Answer with data, not opinion.
- Ask why that happened. Verify it against a figure.
- Keep going until you reach a cause you can actually control.
- Write the full chain, from symptom to root cause.
- Turn the root cause into a specific action with an owner and a date.
- Track whether the action closes the gap next period. If it does not, your root cause was wrong, so run the chain again.
That last step is the one people skip, and it is the one that builds credibility. When you can show that your root cause analysis actually moved the number next quarter, the business starts trusting your diagnosis instead of debating it.
The Bottom Line
The 5 Why technique is one of the cheapest, highest-leverage habits an FP&A team can build. It costs nothing but discipline. It turns descriptive commentary into real diagnosis. And it moves you from the person who reports the miss to the person who explains how to fix it.
The technique itself has not changed since Toyota’s factory floor. What has changed is the cost of doing it. When your numbers live in disconnected files, the curiosity is there but the friction wins, and analysis stalls at the first why. When your plans, actuals, and drivers live in one connected model, you can follow the chain all the way down to the root cause while the meeting is still on the calendar.
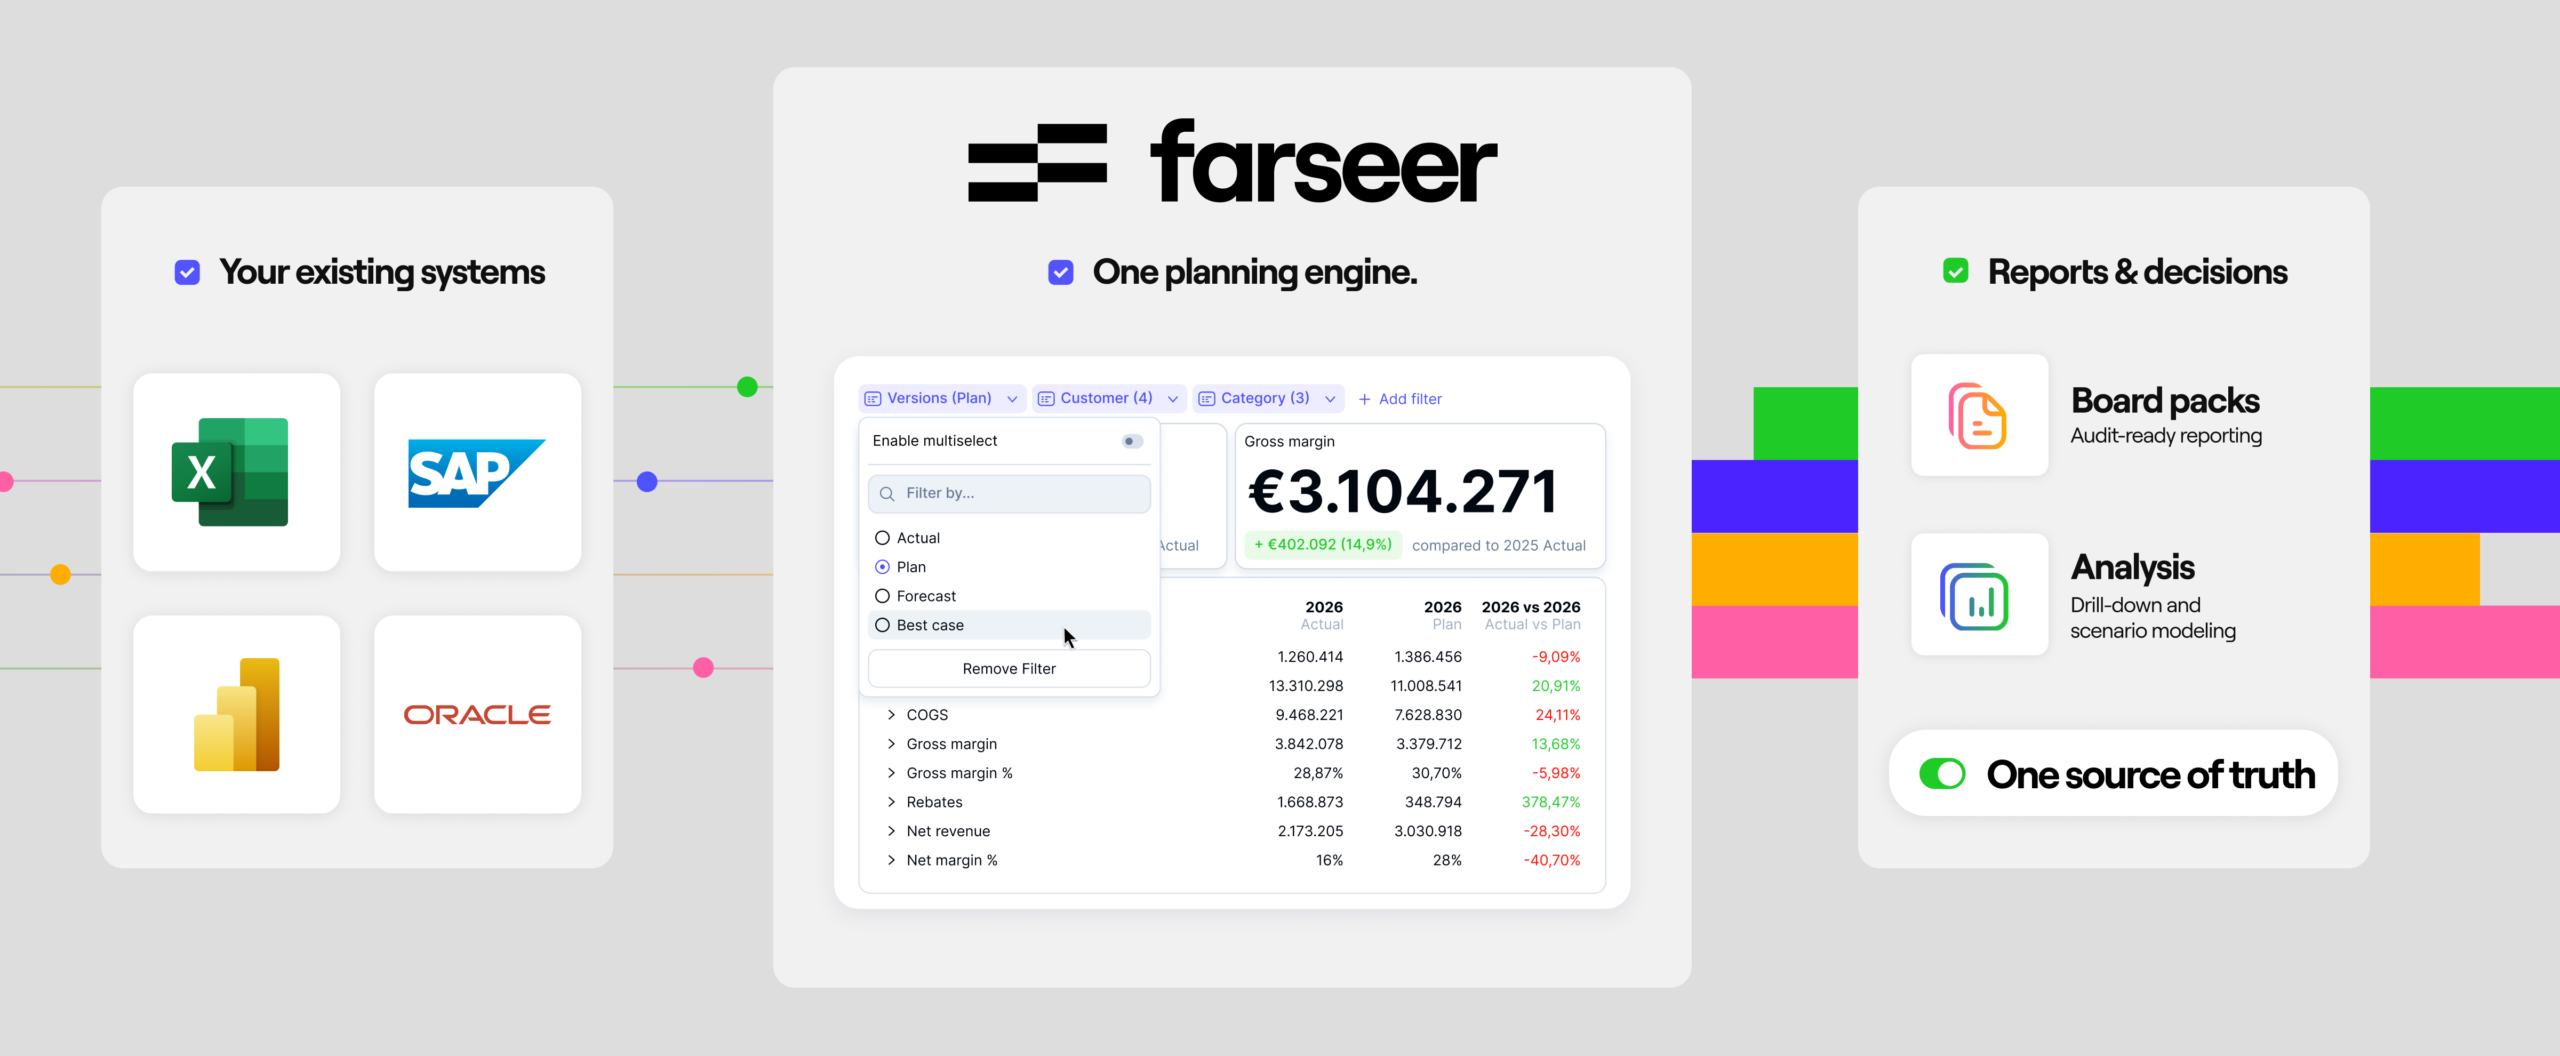
The 5 Why technique is only as effective as the data behind it. Farseer provides a single source of truth for financial reporting, interactive analysis, and variance investigation, enabling finance teams to move from identifying issues to understanding their root causes faster. Instead of spending time reconciling spreadsheets, teams can focus on delivering insights that improve business decisions.
So next time revenue misses and the room goes quiet, do not just name the category and move on. Ask why. Then ask again. Keep going until the real answer shows up. It usually will.

FAQ
What is the 5 Why technique in finance?
It is a root cause analysis method where you ask “why” a financial result happened, then keep asking “why” of each answer, usually about five times, until you reach the underlying driver. In FP&A it is used to turn a surface-level variance, like “revenue missed plan,” into a specific, fixable root cause, like “our demand forecast for a product line was too high.”
How is the 5 Why different from normal variance analysis?
Standard variance analysis tells you what changed and by how much. It quantifies the gap between actual and plan. The 5 Why goes further and explains why the gap happened. One measures the symptom. The other diagnoses the cause. The best FP&A teams use both together.
Do I always need exactly five whys?
No. Five is a guideline, not a rule. Some variances reveal their root cause in three whys. Others need six or seven. Stop when you reach a cause that is fundamental and within your control to fix, not when you hit a specific count.
What if a variance has more than one cause?
That is common with large variances. Run the 5 Why on the single biggest driver first, then repeat it for the next driver. If you suspect several unrelated causes, map them with a fishbone diagram or a driver tree first, then drill down each major branch with its own 5 Why chain.
Why do FP&A teams struggle to do this well?
Two reasons. First, time pressure during the month-end close pushes people to grab the first easy explanation. Second, the data needed to answer each successive “why” is often scattered across many spreadsheets and owners, so digging deeper is slow and painful. Connected FP&A platforms reduce the second problem by keeping actuals, forecasts, and drivers in one place.
Can software run the 5 Why for me?
Not exactly, because the judgment is still yours. But the right tool removes the friction. With a connected model, you can drill from a top-line variance down to the underlying detail in one motion, and anomaly alerts can flag issues early so you start your analysis sooner. The technique stays human. The data gathering gets automated.
How do I make a root cause stick with leadership?
Show the chain, attach numbers to each link, and end with a specific action that has an owner and a date. Then track whether that action closes the gap in the next period. Evidence that your diagnosis actually fixed the number is what earns the business’s trust.
When should FP&A teams use the 5 Why technique?
The 5 Why technique works best when investigating material variances in revenue, margin, operating expenses, working capital, or cash flow. It is particularly useful when the initial explanation is too broad to support decision-making. By repeatedly asking “why,” FP&A teams can move beyond symptoms and identify the underlying business driver that requires action.
What is the difference between the 5 Why technique and a fishbone diagram?
The 5 Why technique follows a single chain of questioning to identify one root cause, making it ideal for investigating a specific variance. A fishbone diagram (Ishikawa diagram) maps multiple potential causes across categories such as people, processes, systems, and external factors. Many FP&A teams use a fishbone diagram to identify possible causes first, then apply the 5 Why technique to investigate each major branch in more detail.
Can AI help with root cause analysis in FP&A?
AI can help identify unusual trends, detect anomalies, and highlight potential drivers behind financial variances. However, determining the true root cause still requires business judgment and collaboration between finance and operational teams. The 5 Why technique provides structured thinking, while AI and connected FP&A platforms help surface the data needed to answer each question faster.

What Great Financial Reporting and Analytics Actually Look Like
Read more
Ad Hoc Reporting for Finance Teams Who Can’t Wait on IT
Read more