Variance Analysis Using the DERP Framework: A Structured Approach for FP&A Teams

Every FP&A professional knows the moment. The month closes. Actuals land. And somewhere in the spreadsheet, one number doesn’t look right. The gross margin slipped. Maybe operating costs ran over or revenue came in behind plan and nobody can say exactly why.
Then leadership asks the question. “What happened, and what are we doing about it?”
This is the heart of variance analysis. It is also where most FP&A work either earns trust or quietly loses it. A good variance story turns a confusing table of numbers into a decision. A weak one buries the insight under jargon and leaves the executive more confused than before.
Read more: Strategic Financial Planning That Actually Drives Results
The problem is rarely the math. Most finance teams can calculate a variance in their sleep. The problem is structure. We know what moved. We struggle to communicate why it moved, what to do next, and what it means for the future. That gap is exactly what the DERP framework was built to close.
In this article we will break down the DERP framework step by step. We will walk through a real example. And we will show how the whole process looks when it runs inside a modern FP&A tool rather than a traditional spreadsheet.
Why Traditional Variance Analysis Falls Short
The month ends. You export actuals from the ERP. You drop them next to budget figures in a spreadsheet. You build a variance column. You eyeball the biggest red numbers. Then you start typing commentary into a deck at nine the night before the review meeting.
The output of this process tends to look the same everywhere. “COGS was 15% over budget.” That is a fact. It is not an insight. It tells the reader what happened but nothing they can act on.
Worse, the commentary often stops there. It describes the variance and goes no further. No cause. No recommendation. No forward view. The CFO is left to ask the obvious follow-up questions, and the analyst scrambles to answer in real time.
There is also a consistency problem. When five analysts write commentary, you get five different styles. One writes a paragraph. One writes a bullet. One blames “market conditions” and moves on. The board sees that inconsistency, and inconsistency reads as a lack of control.
Variance analysis should do four things every single time.
- It should define what changed.
- It should explain why.
- It should recommend a response.
- It should project the impact of that response.
Most commentary does the first thing well and the other three poorly. The DERP framework fixes that.
What Is the DERP Framework?
DERP is a simple mental model for writing variance commentary that actually drives decisions. The letters stand for four steps that you walk through in order.
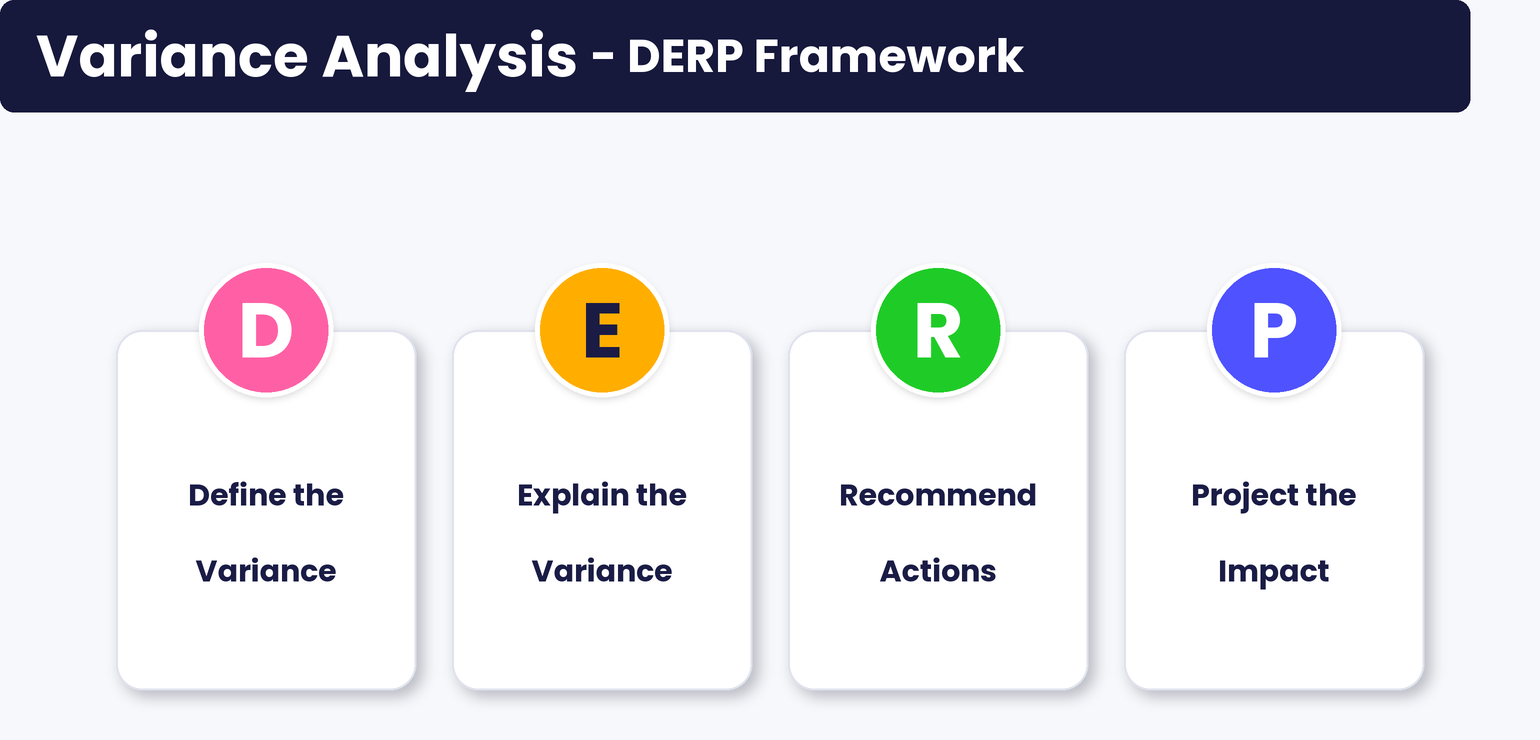
Define the Variance (D). — State clearly what moved, by how much, and against which baseline.
Explain the Variance (E). — Identify the root cause. Not the symptom. The actual driver.
Recommend Actions (R). — Propose a concrete action the business can take. Something the business can do.
Project the Impact (P). — Quantify what happens if the recommendation is followed.
That is the whole framework. Four steps. Define, Explain, Recommend, Project. It is easy to remember, which is the point. A framework you forget is a framework you never use.
The power of DERP is that it forces completeness.
You cannot stop at “COGS was up 15%” because the structure asks you three more questions. Why was it up? What should we do? What will that achieve? Each step builds on the last and pulls you toward a recommendation rather than a description.
Read: The CFO’s Guide to Profitability Analysis Software (+Tool Recommendations)
Think of DERP as the difference between a weather report and a flight plan. A weather report tells you it is raining. A flight plan tells you it is raining, what is causing it, which route avoids it, and what time you will land. FP&A teams should be writing flight plans and not weather reports.
Let us go through each step in detail.
Step One: Define the Variance (D)
The first step sounds obvious, but precision matters here. Defining a variance means stating three things without ambiguity. The metric. The size of the gap. The baseline you are comparing against.
A vague definition sounds like this. “Costs were higher this month.” A sharp definition sounds like this. “COGS came in at a 15% unfavorable variance compared to budget.”
Notice the difference. The sharp version names the line item. It quantifies the gap as a percentage. And it specifies the baseline, which is budget rather than prior month or forecast. That last point trips up a lot of teams. A variance against budget tells a very different story than a variance against last quarter. Always name your baseline.
Two more details make a definition strong. First, label the direction clearly. Use “favorable” and “unfavorable” rather than just plus or minus signs, because a positive cost variance is bad news while a positive revenue variance is good news. The labels remove confusion. Second, give the reader a sense of materiality. A 15% miss on a small line is noise. A 15% miss on your largest cost category is a fire.
The Define step is short by design. It should be one clean sentence. Resist the urge to explain the cause here. That comes next.
Step Two: Explain the Variance (E)
The Explain step asks a single hard question. Why did this happen?
The trap most teams fall into is explaining a symptom and calling it a cause. “COGS rose because spending was higher” is circular. Of course spending was higher. That is what the variance measured. The reader wants the driver underneath.
In our COGS example, a real explanation reads like this. “The variance was driven by increased raw material costs due to supplier price hikes.” Now we have something. A specific, external, identifiable cause. Supplier prices went up, and that flowed straight into the cost of goods sold.
Good explanations usually trace a variance back to a driver. A driver is the operational lever that sits behind a financial number. Volume. Price. Mix. Rate. Efficiency. Foreign exchange. When you can attribute a variance to one or two clean drivers, you have explained it properly.
This is also where the spreadsheet workflow starts to crack. To explain a variance honestly, you often need to decompose it. How much of the COGS miss was price versus volume? Did we buy more material, pay more per unit, or both? Slicing a single variance into its component drivers by hand is slow and error prone. It is also the kind of work that gets skipped under time pressure, which is exactly when a clean explanation matters most.
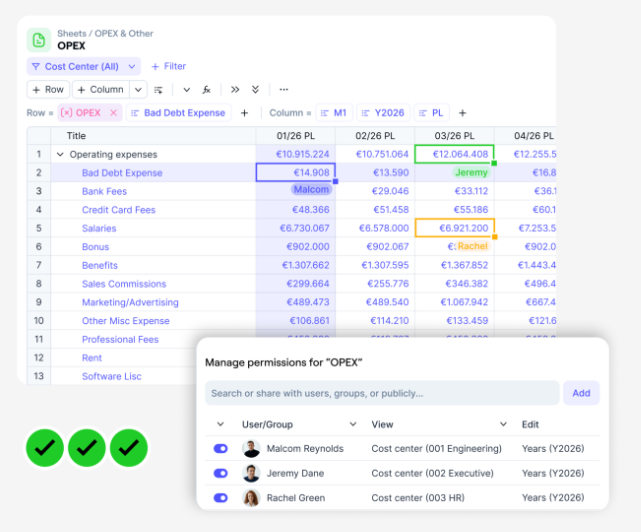
This is one place where a purpose built FP&A platform changes the game. In Farseer, financial outcomes are linked directly to operational drivers inside one connected model. So when COGS moves, you are not guessing whether it was price or volume. The model already separates the two, and you can trace the variance back to the supplier price change in seconds rather than rebuilding a decomposition by hand. The explanation stops being a story you assemble after the fact and becomes something the data shows you.
A strong Explain step has one more quality. It is honest about what it does not know. If part of the variance is still unexplained, say so. “12 of the 15 points trace to supplier pricing, with the remaining 3 points under investigation” is far more credible than a tidy explanation that papers over a gap.
Step Three: Recommend Actions (R)
Here is where FP&A stops being a scorekeeper and starts being a partner. The Recommend step turns analysis into action. Once you know what moved and why, the obvious next question is what the business should do.
In the COGS case, the recommendation is clear. “Explore alternative suppliers or negotiate better terms with current suppliers.” That is concrete. It names a specific lever the business can pull. It gives leadership a decision to make rather than a problem to stew on.
The best recommendations share a few traits.
- They are specific. “Reduce costs” is not a recommendation. “Renegotiate the top three supplier contracts before the next quarter” is.
- They are actionable by someone. A recommendation that no one owns goes nowhere, so it helps to imply who would carry it out.
- And they are realistic. Recommending that you simply stop buying raw materials is not useful. Recommending a supplier review is.
A subtle point here. The Recommend step is where FP&A adds the most strategic value, yet it is the step most commentary skips entirely. Analysts often feel it is not their place to suggest operational moves. That instinct is understandable but it sells the function short. You do not have to mandate the action. You can frame it as an option for the business to consider. “We recommend exploring alternative suppliers” is collaborative, not bossy. It opens a conversation.
Strong recommendations also tend to come in pairs. Offer a primary path and an alternative. In the example, the recommendation includes both finding new suppliers and renegotiating with existing ones. That gives leadership a choice rather than an ultimatum, and choices get implemented far more often than ultimatums do.
Read: Financial Data Quality Management: A Practical Framework for FP&A Teams
Step Four: Project the Impact (P)
The final step is what separates a memorable variance story from a forgettable one. Projecting the impact means quantifying the outcome of your recommendation. If the business does what you suggest, what changes?
In our example, the projection is precise. “A potential 5% cost reduction in COGS is projected for the next quarter with successful implementation.” That single sentence transforms the entire analysis. We have gone from a problem, the 15% overrun, to a quantified path forward, a 5% recovery. The reader now sees not just the wound but the treatment and the expected recovery time.
A good projection does three things.
- It attaches a number to the recommendation, because a vague promise of “improvement” is not decision-grade.
- It sets a timeframe, in this case next quarter, so the impact can be tracked. And it acknowledges conditionality. The phrase “with successful implementation” is doing quiet but important work.
- It signals that the 5% is contingent on the action being taken and executed well. That honesty protects your credibility if the outcome falls short.
Projection is also where forecasting and variance analysis meet. A projection is, in effect, a small forecast. You are predicting how a future period will change based on an action taken today. This is the natural moment to run a scenario. What if we secure the full 5% reduction? What if we only achieve half? What if supplier prices keep climbing and the action merely holds the line?
Read: Projection vs. Forecast: Why Rolling Forecasts Take the Win
Modeling those scenarios by hand is painful in a spreadsheet, because every assumption changes ripples through dozens of linked cells. This is the second place an FP&A tool is effective.
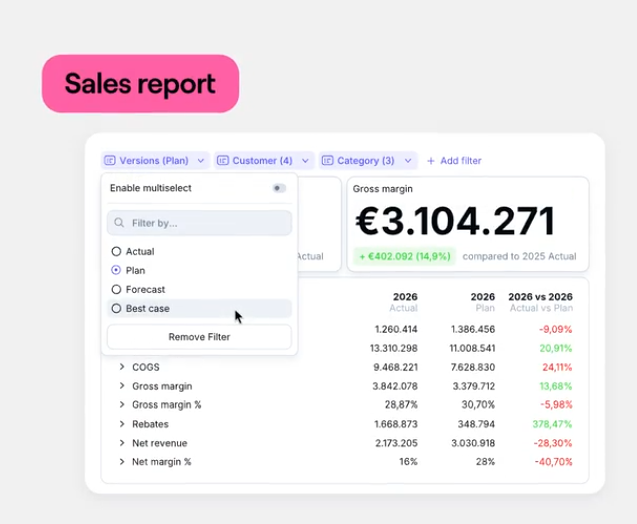
With Farseer, you adjust a driver such as supplier price or sourcing mix, and every downstream statement updates instantly. You can model the 5% reduction, then the 2.5% partial case, then a downside, and present all three as a clean range rather than a single fragile point estimate. The projection becomes a live scenario the board can interrogate rather than a guess buried in a footnote.
Putting It All Together: A COGS Walkthrough
Let us assemble the four steps into a single piece of commentary, using the COGS example from start to finish. This is what a complete DERP narrative looks like.
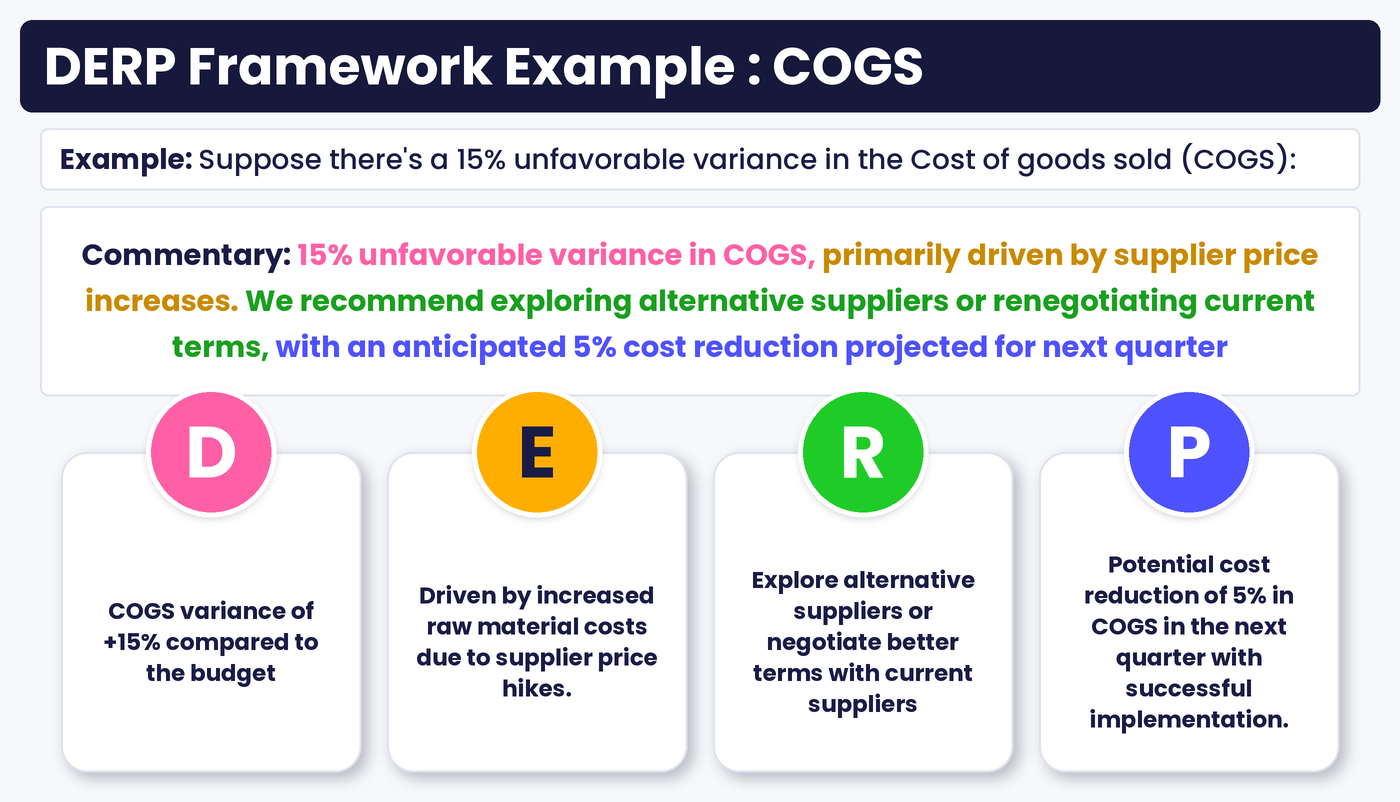
“COGS came in at a 15% unfavorable variance against budget this period. The variance was primarily driven by supplier price increases on key raw materials. We recommend exploring alternative suppliers or renegotiating current contract terms. With successful implementation, we project a 5% reduction in COGS for next quarter.”
Read that again and notice how much it accomplishes in four sentences. The reader knows what happened. They know why. They know what to do. And they know what to expect. There are no dangling questions. The CFO can walk into a board meeting and defend this without a single follow-up to the analyst.
Compare that to the typical alternative. “COGS was over budget by 15% due to higher costs.” Same opening fact. None of the values. One of these makes FP&A look like a control function. The other makes it look like a strategic partner.
The DERP structure also makes commentary consistent across a team. When every analyst writes Define, Explain, Recommend, Project in that order, the board sees a uniform standard. Uniformity reads as control, and control is exactly the impression a finance function wants to project.
From DERP Framework to FP&A Tool
A framework is only as good as the system that supports it. You can write beautiful DERP commentary in a spreadsheet, but you will fight the tool every step of the way. The Explain step needs driver decomposition. The Project step needs scenario modeling. Both are slow and fragile in Excel.
This is where a modern FP&A platform turns DERP from a writing exercise into an operating rhythm. Picture the same four steps running inside a connected system.
For Define, actuals flow automatically from the ERP into the model, and variances against budget calculate themselves the moment data lands. No exporting. No manual variance columns. The “what moved” step is done before you sit down.
For Explain, the model already links each financial line to its operational drivers. So the price versus volume breakdown is built in. You see immediately that supplier pricing, not volume, drove the COGS miss. Some platforms even flag anomalies automatically, surfacing the variance before anyone goes looking for it.
For Recommend, you have the context to make a sharp suggestion because the driver analysis is right there in front of you.
For Project, you adjust the relevant driver and watch the impact cascade across the P&L, balance sheet, and cash flow in real time. Your 5% projection is not guesswork in the air. It is a modeled scenario you can stress test.
Farseer is built exactly for this kind of workflow. It unifies planning, forecasting, and reporting in one connected model where actuals sync from your ERP, CRM, and HR systems, variances surface in real time, and every assumption carries a full audit trail. Instead of rebuilding the analysis each month, finance teams run DERP as a repeatable process. The framework gives you discipline. The platform gives you speed.
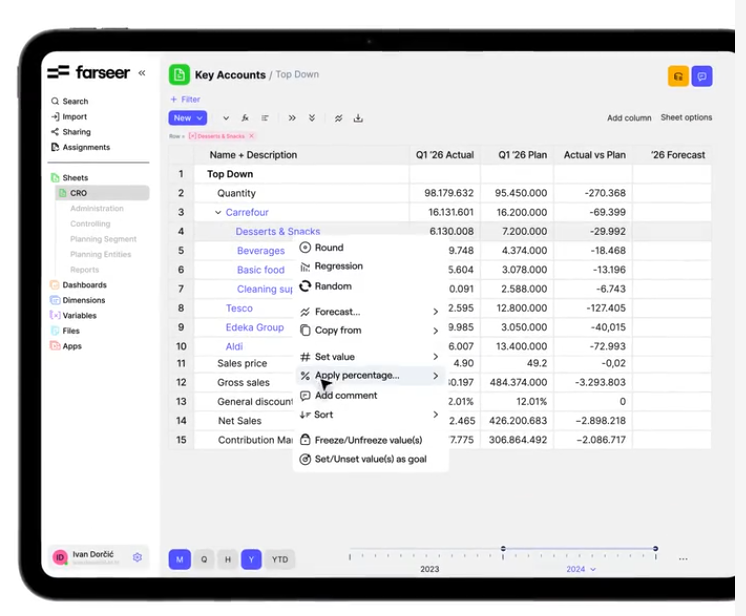
One more point on traceability. When a projection lands in a board deck, someone always asks how you got the number. In a spreadsheet, that means digging through linked tabs and hoping the logic holds up. In Farseer every number traces back to its driver and its version. That is what lets FP&A defend its work when leadership pushes back.
5 Common Mistakes to Avoid in Variance Analysis
Even with a clean framework, teams stumble in predictable ways. A few worth flagging.
- Stopping at Define. This is the most common failure by far. The analyst states the variance and considers the job done. If your commentary ends with a number, you have written a report, not an analysis.
- Explaining Symptoms instead of Causes. “Costs rose because we spent more” adds nothing. Push past the surface to the driver underneath. If you cannot name a driver, you have not finished the Explain step.
- Cowardly Recommendation. “Continue to monitor the situation” is what teams write when they are afraid to commit. Monitoring is not an action. Have a point of view. Even a tentative recommendation beats a non-recommendation.
- Unquantified Projection. “This should improve next quarter” is a hope, not a forecast. Attach a number and a timeframe, or the projection carries no weight.
- Inconsistency across the team. If one analyst writes full DERP and another writes a vague paragraph, the board notices. Agree on the structure as a team and hold to it. A shared template inside your planning tool makes this almost automatic.
Making DERP a Habit
The framework works best when it stops being something you remember to do and becomes simply how your team writes commentary. A few practices help cement it.
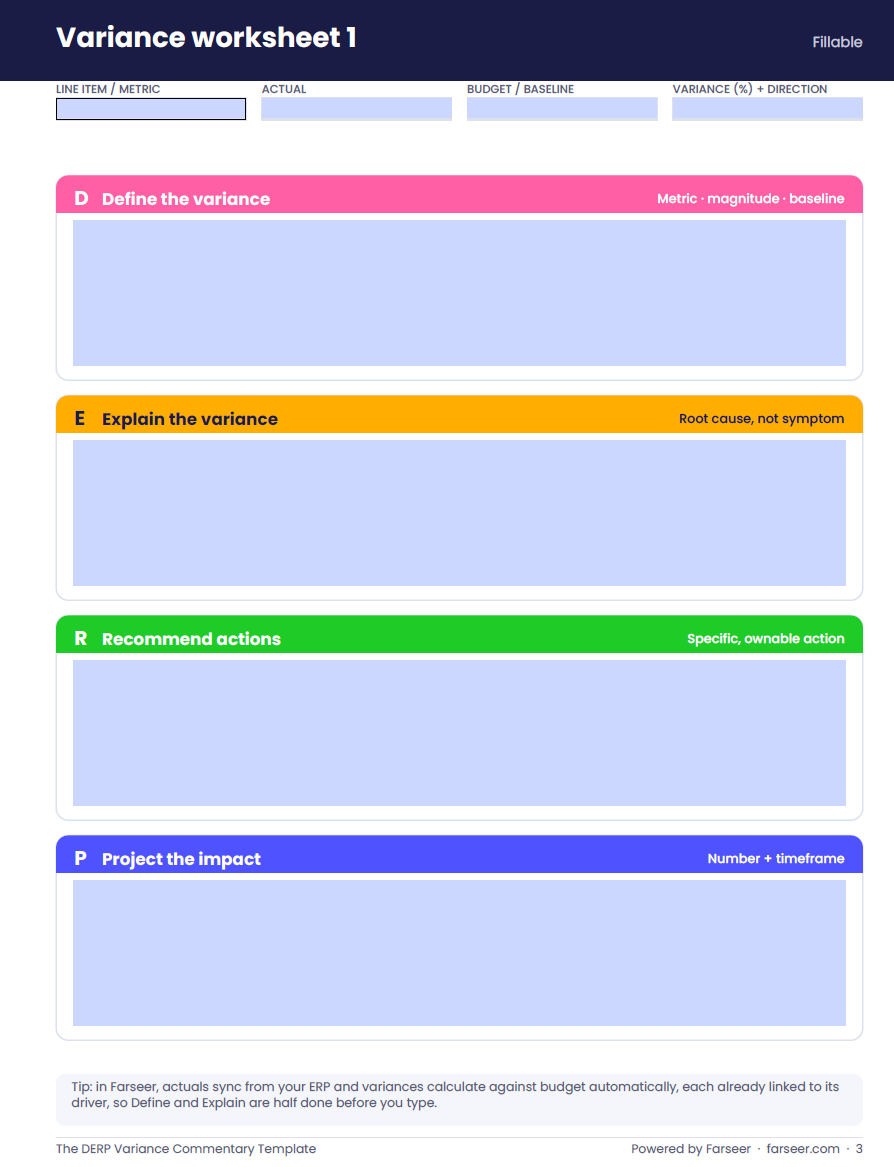
Build a DERP template into your monthly reporting pack. Four labeled prompts. Define, Explain, Recommend, Project. When the structure is on the page, analysts fill it in rather than reinventing the format each month.
Review commentary against the framework before it goes out. A quick check. Does every variance note have all four parts? If a step is missing, send it back. The discipline holds only if someone enforces it.
Tie the projections to the next forecast. The whole point of the Project step is that it makes a claim about the future. Track that claim. When next quarter’s actuals land, did the 5% reduction materialize? Closing that loop builds credibility over time and sharpens future projections. This is far easier when projections live inside your planning platform rather than scattered across old decks, because the tool already holds both the projection and the actual that follows.
Train new analysts on DERP from day one. It takes ten minutes to teach and pays off in every review meeting thereafter. A junior analyst who writes clean DERP commentary looks more polished than a senior one who rambles.
We’ve created a ready-to-use DERP Variance Commentary Template to help standardize your team’s analysis.
Download it here:
Why Structure Beats Talent
The teams that communicate best are rarely the ones with the smartest analysts. They are the ones with the clearest structure. A brilliant analyst with no framework produces inconsistent commentary that varies with their mood and their workload. An average team with a strong framework produces reliable, decision-grade output every single month.
DERP is that structure. It is four questions asked in the right order. Define what moved. Explain why. Recommend what to do. Project what happens next. Walk those four steps every time and your commentary will always answer the questions leadership is about to ask.
The DERP framework gives the thinking. Farseer gives the speed and the proof. When the two come together, variance analysis stops being a monthly chore and becomes one of the most valuable things FP&A does. You move from explaining the past to shaping the next quarter. That is the shift from reporting to partnering, and it is exactly where the function should be heading.

FAQ
What does DERP stand for in variance analysis?
DERP stands for Define, Explain, Recommend, and Project. It is a four step framework for writing variance commentary. You define what changed, explain why it changed, recommend a response, and project the impact of that response. The structure ensures your commentary drives a decision rather than just reporting a number.
How is the DERP framework different from a standard variance report?
A standard variance report usually stops at defining the gap. It tells you a line item missed budget by some percentage and leaves it there. DERP carries the analysis three steps further. It forces you to identify the root cause, propose an action, and quantify the expected outcome. The result is commentary that leadership can act on directly.
Can I use the DERP framework in a spreadsheet?
Yes. DERP is a writing and thinking framework, so you can apply it anywhere, including Excel. The limitation is speed. The Explain step needs driver decomposition and the Project step needs scenario modeling, both of which are slow and error-prone in spreadsheets. A connected FP&A platform like Farseer automates the variance calculation and the driver analysis, so the framework runs as a repeatable monthly process rather than a manual scramble.
What is the most important step in the DERP framework?
All four matter, but the Recommend and Project steps are where FP&A adds the most strategic value, and they are the steps teams most often skip. Many analysts are comfortable defining and explaining a variance but stop short of suggesting an action or quantifying its impact. Pushing through those final two steps is what turns finance from a scorekeeper into a partner.
How do I avoid explaining a symptom instead of a root cause?
Trace every variance back to an operational driver such as price, volume, mix, rate, or foreign exchange. If your explanation could be answered with “because we spent more” or “because revenue was lower,” you have described a symptom, not a cause. Keep asking why until you reach a driver the business actually controls.
How does an FP&A tool support the DERP framework?
A modern platform automates the parts of DERP that are painful by hand. Actuals sync from source systems so variances calculate themselves. Account lines link to operational drivers so the explanation is built in. And scenario modeling lets you project impact instantly by adjusting a single assumption. In Farseer, these capabilities sit in one connected model with a full audit trail, so each step of DERP is faster and every number is traceable.
Should every variance get the full DERP treatment?
No. Reserve full DERP commentary for material variances that matter to the business. A 15% miss on your largest cost line deserves all four steps. A small variance on a minor line can be noted briefly or left out entirely. Materiality should guide where you spend the effort, so the important stories get the attention they deserve.
What is variance commentary in FP&A?
Variance commentary is the written explanation that accompanies financial variances in management reports. Effective variance commentary goes beyond describing what happened by explaining the root cause, recommending corrective actions, and outlining the expected impact on future performance. Frameworks like DERP help finance teams produce consistent, decision-focused commentary.
How often should FP&A teams perform variance analysis?
Most FP&A teams perform formal variance analysis monthly as part of the financial close. However, leading organizations also review key variances weekly or even daily for critical business drivers such as revenue, gross margin, operating expenses, and cash flow. More frequent analysis enables faster decision-making and earlier corrective action.
What is the difference between variance analysis and financial reporting?
Financial reporting focuses on presenting historical financial results accurately, while variance analysis explains why actual performance differed from budgets, forecasts, or prior periods. Financial reporting tells stakeholders what happened; variance analysis helps them understand why it happened, what actions to take, and how future performance may change.

What Great Financial Reporting and Analytics Actually Look Like
Read more
Ad Hoc Reporting for Finance Teams Who Can’t Wait on IT
Read more