How to Build the Business Case for an FP&A Platform (With an ROI Model)

You already know your team needs a better tool than Excel. The hard part is that your CFO has heard the pitch before. Every software vendor promises faster planning, better insights, and a finance team freed from spreadsheet drudgery.
Your CFO has also seen finance systems that took 18 months to implement and never quite delivered. So, when you walk in asking for budget, you are not just selling a platform. You are selling against every failed IT project your leadership team remembers.
Read: FP&A Software – A Practical Guide for Finance Teams
This is why preparing a solid business case matters more than the demo. A good software demo gets people excited. A good business case gets a signature.
The uncomfortable truth is that FP&A teams, the people who evaluate everyone else’s investment proposals for a living, are often surprisingly bad at making their own. We hold sales to a standard of evidence we skip when the spend is ours. That ends today.
This guide walks through the full process: understanding what you are actually buying, quantifying your current pain, structuring the case, building an ROI model with real numbers, and handling the objections that will come. By the end of this article, you will have a template you can start filling in tomorrow.
First, Be Clear About What an FP&A Platform Actually Is
Before you can justify the investment, you need to define it in your own language.
Keep this section of your business case short. Two slides at most. Your executives do not need a market overview. They need to know what problem this solves for your company.
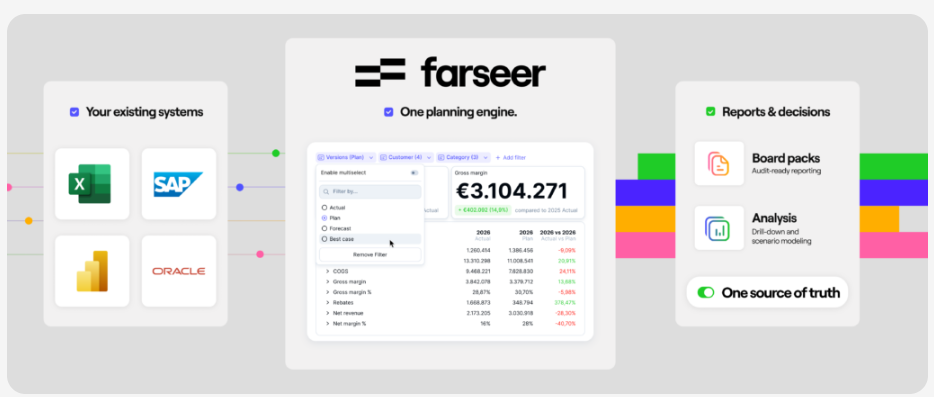
An FP&A platform is a dedicated system for planning, budgeting, forecasting, reporting, and analysis. It connects to your source systems, usually the ERP, HRIS, and CRM, and gives finance one controlled place to build models, run scenarios, and publish numbers.
The core capabilities worth caring about:
- Driver-based planning, where models run on business logic instead of hardcoded cells.
- Scenario modelling, so you can test decisions before making them.
- Workflow, so budget collection stops being an email chase.
- Live dashboards and reports that update when the data updates.
- Direct integration with source systems, so actuals can be loaded automatically.
Notice what is not on that list: “replacing Excel.” A platform does not eliminate spreadsheets. What it replaces is Excel as a database, a consolidation engine, and a workflow tool. Those are jobs Excel was never built for, and everyone who has merged 40 budget templates at midnight knows it.
The key differences from a spreadsheet-driven process come down to four things.
- Scalability, because a model with 200 cost centres behaves the same as one with 10.
- Auditability, because every change has an owner and a timestamp.
- Collaboration, because 30 people can work in one model without version chaos.
- A single source of truth, because “which file is the latest?” stops being a question anyone asks.
Take scenario modelling as an example. In a spreadsheet, testing a 10% volume drop means saving a copy of the file, rewiring assumptions, and hoping you caught every dependency.
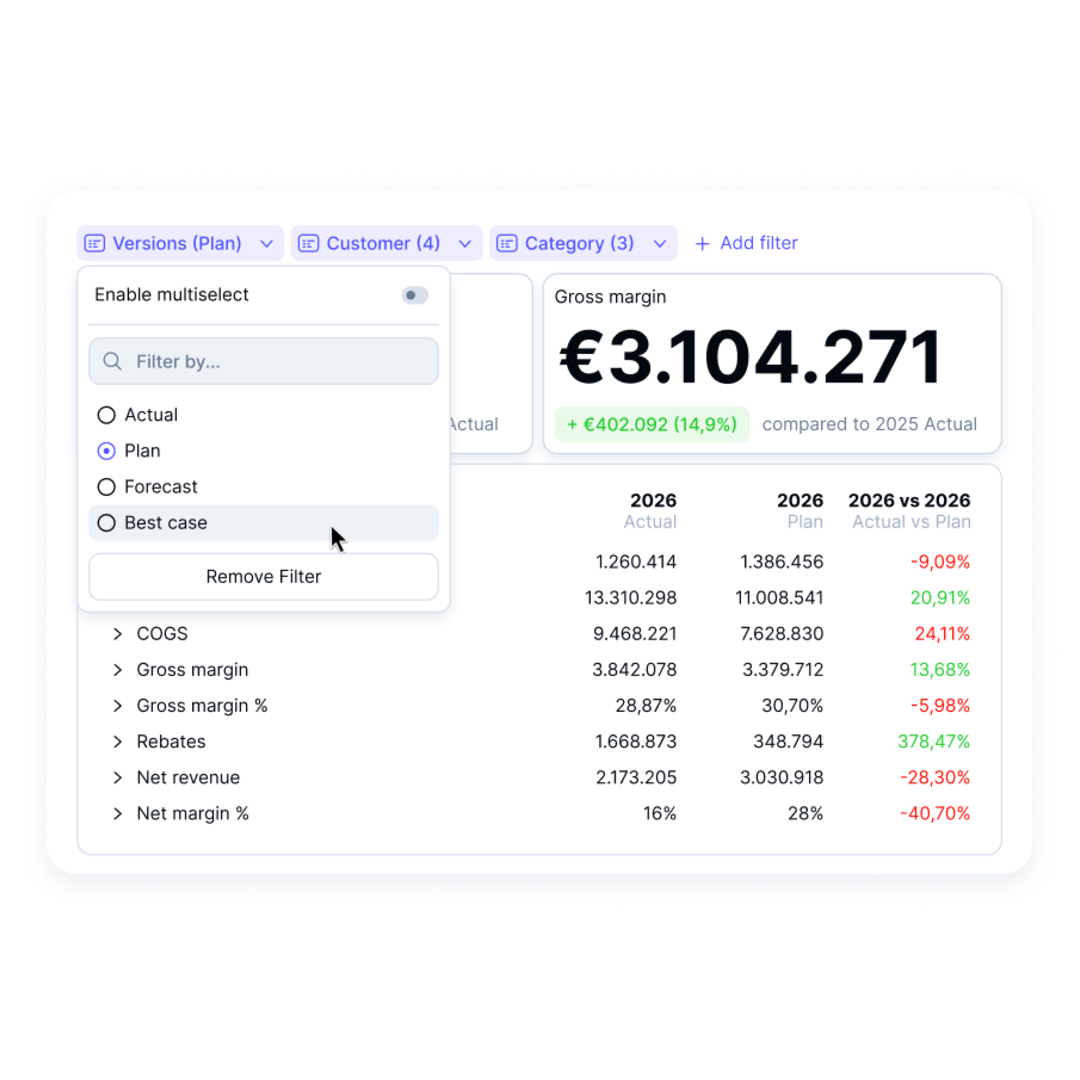
In an FP&A platform like Farseer, scenarios live side by side in one model. You flex the assumption, and the P&L, cash flow, and headcount plan all recalculate instantly. That is the difference between a capability you have on paper and one you actually use in a Tuesday meeting.
Step 1: Diagnose Before You Prescribe
The weakest business cases start with the solution. The strongest start with a diagnosis.
So, before you talk about any platform, document your current state honestly. Sit with your team and map how planning actually works today. Not the official process. The real one, with the workarounds.
In a spreadsheet-driven process, the picture can look something like this.
- The annual budget runs on dozens of Excel templates emailed to budget holders, chased for weeks, and consolidated by hand.
- Month-end reporting means exporting from the ERP, pasting into a master file, fixing what the paste broke, and rebuilding pivot tables.
- Forecasts get updated quarterly at best, because the mechanics take so long that nobody wants to do it more often. And when the CEO asks “what happens if we delay the new plant by six months?”, the honest answer arrives three days later.
Now quantify it. This is the step most people skip, and it is the step that makes the entire business case work. Put numbers on four things:
- Time. How many hours does the budget cycle consume, across finance and budget holders? How many hours per month go into reporting? Track it for one cycle if you have to. The number will be bigger than you think.
- Errors and rework. How often do broken links, stale versions, or copy-paste mistakes force rework or, worse, reach the board deck? How often do broken links, stale versions, or copy-paste mistakes force rework—or worse, reach the board deck? Your files are not the exception.
- Delay. How many days pass between month-end close and the moment leadership sees results? How long does a reforecast take from request to answer? Every one of those days is a day of decisions made on old numbers.
- Missed analysis. What questions does the business ask that you cannot answer in time? Write down three real examples from the last quarter. These become your best slides.
Then connect the diagnosis to strategy. This is what separates a finance tools request from a business investment. If the company plans to grow through acquisition, your consolidation problem is about to get worse. If leadership wants rolling forecasts and faster pivots, your quarterly cycle cannot deliver that. If the plan is expansion into new markets, someone needs to model those scenarios quickly. An FP&A platform aligned with a stated company priority is an enabler. One without that link is a nice-to-have, and nice-to-haves lose to other budget requests every time.
Step 2: Structure the Business Case
With the diagnosis done, the case almost writes itself. Structure it in five parts.
- Executive summary. One page. The problem, the proposal, the cost, the return, the ask. Write it last, put it first, and assume it is the only page some approvers will read.
- Problem statement. Your quantified current state. Hours, errors, delays, missed analysis. Use your own numbers, not industry benchmarks. “Our budget cycle consumes 2,400 hours” beats any statistic from a vendor whitepaper, because nobody can argue with your own timesheet.
- Solution overview. What you propose, scoped tightly. Which use cases come first: budgeting, forecasting, reporting, workforce planning. Who the users are. What the platform connects to. Resist the urge to promise everything in phase one. A scoped proposal reads as credible. An everything proposal reads as risk.
- Financial impact. The ROI model. We will build this in the next section. A word on evidence before we move on. Your own numbers carry the case, but supporting data strengthens it. Collect three kinds. First, internal artifacts: a screenshot of the version-numbered file chaos, the email chain chasing template 37, the timeline of last year’s budget. These make the pain visceral for executives who have never lived it. Second, input from the business: two or three quotes from budget holders about what the current process costs them. When a sales VP says budgeting steals a week of selling time, that is a voice finance cannot supply alone. Third, external reference points: what comparable companies achieve on planning cycle length and forecast frequency. Use these sparingly and as context, never as the backbone. The backbone is your own diagnosis.
- Implementation roadmap. Phases, timeline, owners, and what “done” looks like for each phase. Include the internal effort required, not just the vendor’s work. Hiding the internal cost is the fastest way to lose trust when it shows up later.
One practical note on scope. The pattern that works is to start with the process that hurts most, usually budgeting and forecasting, prove value there, then expand. This is also worth checking when you evaluate vendors: how fast can you get a working model live? Some enterprise planning implementations can take quarters or longer, depending on scope and complexity. Some platforms can be implemented more quickly.
Farseer, for example, typically gets customers live in weeks rather than months, partly because its modelling environment works the way spreadsheet-trained finance people already think. Implementation speed is not a footnote in your business case. It moves the entire payback calculation, because benefits that start in month two are worth more than benefits that start in month fourteen.
Step 3: Build the ROI Model
Here is where FP&A professionals have an unfair advantage. Build the ROI model with the same rigor you would demand from a sales director pitching a new territory.
The model has two sides. Total costs and total benefits, over a three-year horizon. Three years is long enough to show the full return and short enough to stay believable.
The cost side
Count everything. An ROI model that lowballs costs gets torn apart in review, and it deserves to be.
- Software subscription or license fees, per year
- Implementation: vendor services for setup, integrations, and model building
- Training and change management, including internal time
- Your team’s hours during implementation, priced at loaded cost
- Ongoing support and administration
Let us understand this with an example.
A mid-market company, around $200M in revenue, with a six-person FP&A team and roughly 40 budget holders.
- Year 1 costs: $60,000 in subscription fees, $45,000 in implementation services, $10,000 for training and change management, and $15,000 of internal team time. Total: $130,000.
- Years 2 and 3: $65,000 per year for subscription and support.
- Three-year total cost: $260,000.
The benefit side
Benefits come in three tiers. Keep them separate, because they carry different levels of certainty.
- Tier 1: Efficiency gains. The most defensible tier, because it comes from your own time data. Suppose your diagnosis found 4,000 hours per year spent on manual planning mechanics: template management, consolidation, reconciliation, report assembly. A platform automating the mechanical layer can realistically cut that by 40%. That is 1,600 hours. At a loaded cost of $60 per hour, the capacity released is worth $96,000 per year. Be precise about what this number means. It is rarely a headcount reduction. It is capacity redirected from data assembly to analysis, which is what you were hired for in the first place. Say that explicitly. It is more honest, and it lands better with a CFO who does not want to promise layoffs to fund software.
- Tier 2: Direct cost savings. Money that stops leaving the building. External consultants who help with the budget or board reporting: say $30,000 per year. The cost of errors and rework, conservatively estimated from your diagnosis: $20,000 per year. Any legacy tools the platform replaces go here too.
- Tier 3: Decision value. Faster reforecasts, earlier warnings, better scenario analysis before big commitments. This is real value, often the biggest of the three, and also the hardest to defend with a number. My advice: describe it, give one concrete example from your own company, and leave it out of the ROI math. A model that works without the soft benefits is a model nobody can knock over. The decision value then becomes upside, and finance leaders love approved investments that outperform the case.
The math
Full-year benefits in our example: $96,000 in efficiency plus $50,000 in direct savings. That is $146,000 per year. Assume year one delivers half of that, $73,000, because the platform goes live mid-year and adoption ramps.
Three-year benefits: $73,000 + $146,000 + $146,000 = $365,000.
Now the formula you already know:
ROI = (Total Benefits − Total Costs) / Total Costs
ROI = ($365,000 − $260,000) / $260,000 = 40% over three years.
Then calculate the payback period, the time until cumulative benefits cover cumulative costs. In this example, this pays for itself during Year 2. For many CFOs, payback is the number that matters most. A 40% ROI is nice. “This pays for itself before the second renewal” is a decision.
Run scenarios on your own model
You would never accept a single-point forecast from a business unit. Do not present one yourself.
Build three cases. Conservative: benefits at 60% of estimate, costs at 120%. Expected: the base case above. Best case: full benefits realized faster, plus some quantified decision value. If the conservative case still shows positive returns within three years, say so loudly. An investment that survives its own downside scenario is an easy yes.
Present it like you would want it presented to you
How you show the model matters almost as much as what is in it.
Keep every assumption visible and sourced. If the hourly rate is $60, say where it came from. If the efficiency gain is 40%, say why not 60%, and why not 20%. A CFO who can trace every number relaxes. A CFO who finds one unexplained figure starts hunting for more.
Link each benefit line back to a specific pain point from your diagnosis. The 1,600 saved hours should connect visibly to the 4,000 hours you documented in step one. When the benefits map onto pains the audience already accepted, the model stops feeling like a projection and starts feeling like a plan.
Then keep the visuals brutal and simple. One chart showing cumulative costs against cumulative benefits, with the payback crossover marked. One sensitivity table showing the three scenarios. That is it. One honest chart beats ten slides of text, and you of all people know an over-designed deck is where credibility goes to die.
Step 4: Handle the Objections Before They Are Raised
Every business case meets four objections. Answer them in the document, before anyone asks. Pre-empted objections read as thoroughness. Surprised answers read as spin.
- It costs too much. Reframe against the current state. You are already paying for planning today. You pay in hours, in errors, in consultants, and in decisions delayed. Your diagnosis priced that. The question is not whether to spend, it is whether to keep spending on a manual process or shift that spend to a better one. Then point at the payback period, not the sticker price.
- Implementations fail. This fear is earned, so meet it with structure, not reassurance. Propose a phased rollout: budgeting and forecasting first, a working model in production within the first quarter, expansion only after value is proven. Name an internal owner. Define what success looks like in 90 days. Ask shortlisted vendors for reference customers of your size and industry, and actually call them. Ask the references what went wrong, not what went right. You learn more.
- The team won’t adopt it. The graveyard of finance software is full of tools that fought how finance people think. So, make adoption a selection criterion, not an afterthought. Involve the skeptics on your own team in the evaluation. Watch how budget holders, not just analysts, react in the demo. This is where the modelling logic matters:
Farseer deliberately keeps a formula-and-cell logic familiar to anyone fluent in Excel, which shrinks the retraining cliff that kills adoption on more rigid enterprise tools. Whatever platform you choose, the test is the same. If your best Excel modeler cannot build something real in the trial, keep looking.
- What about IT, integration, and security? Bring your IT team in early and let them ask their questions directly: how the platform connects to the ERP, where data is hosted, how access is controlled, what certifications the vendor holds. In your business case, show that this review already happened. An FP&A platform request that has already addressed IT’s key questions is much easier to move through the approval process.
One more thing on stakeholders. Tailor the message to the reader. The CFO cares about ROI, control, and audit trail. The CIO cares about integration, security, and vendor stability. Business unit leaders care about whether budgeting will stop eating two weeks of their year. Same case, three different cover conversations.
What This Looks Like When It Works
Pull it together and the sequence is short. Diagnose the current state and price the pain. Tie the fix to a company priority. Scope phase one tightly. Build a three-tier benefit model, keep the soft benefits out of the math, and run scenarios on your own numbers. Show the payback crossover. Answer the four objections before they are asked.
None of this is exotic. It is the same discipline FP&A applies to everyone else’s investments, finally pointed at our own.
And the stakes are bigger than convenience. A finance team that spends most of its time collecting and checking data is a reporting function. A team that spends that time on scenarios, drivers, and decisions is a strategic one. The platform does not make that shift happen by itself. But without it, the shift rarely happens at all, because the mechanics eat the hours the strategy needed.
So here is your homework, and it costs nothing. This week, start the current-state assessment. Track where your team’s hours actually go for one planning cycle. Draft the one-page problem statement. Then rough out the ROI model with your own numbers, conservative case first.
If your numbers support the case, you will have a business case worth making. And when you get to vendor evaluation, put implementation speed, Excel-familiar modelling, and integration depth on your scorecard, and test platforms like Farseer against your own use cases rather than a canned demo. The business case for better planning should be the easiest model you build all year. After all, you are the one person in the room who can prove it.
FAQ
How do you build a business case for an FP&A platform?
Start by documenting the current planning and reporting process, quantifying the time, errors, delays and missed analysis it creates, then define the proposed solution, implementation plan, costs and expected benefits. Build an ROI model using your own internal data rather than relying primarily on vendor benchmarks.
What is an FP&A platform?
An FP&A platform is software designed to support financial planning, budgeting, forecasting, reporting and analysis. It typically connects with systems such as ERP, HRIS and CRM platforms and provides a controlled environment for financial models, scenarios, workflows and reporting.
What should be included in an FP&A software business case?
A strong business case should include an executive summary, quantified problem statement, solution overview, financial impact or ROI model, implementation roadmap and responses to likely stakeholder objections.
How do you calculate the ROI of FP&A software?
A common formula is:
ROI = (Total Benefits − Total Costs) / Total Costs
Include software fees, implementation, training, change management, internal implementation time and ongoing administration on the cost side. Benefits can include efficiency gains, direct cost savings and, where appropriate, quantified decision value.
What costs should be included when evaluating FP&A software?
Consider more than the subscription price. Costs can include software licenses, implementation services, integrations, training, change management, internal employee time, ongoing support and administration.
What are the benefits of an FP&A platform?
Benefits can include reduced manual planning work, faster reporting and forecasting cycles, fewer reconciliation and version-control issues, better scenario analysis, improved collaboration and more finance capacity for analysis and decision support.
How do you measure the benefits of FP&A software?
Start with your current-state data. Measure hours spent on budgeting, reporting, consolidation and reconciliation; quantify direct costs such as consultants or legacy tools; and track metrics such as planning-cycle time, forecast turnaround time and reporting delays.
What is the payback period for FP&A software?
The payback period is the time required for cumulative financial benefits to recover the investment costs. It depends on implementation costs, the timing of benefits, adoption and the level of efficiency or direct savings achieved.
How should companies evaluate FP&A software vendors?
Evaluate vendors against your actual use cases rather than relying solely on a generic demo. Key criteria can include modelling capabilities, implementation approach, integration, security, user adoption, workflow, scalability, reporting and total cost of ownership.
How can finance teams get CFO approval for FP&A software?
Frame the proposal as a business investment rather than a technology purchase. Quantify the current cost of the manual process, connect the proposed solution to company priorities, show total costs and benefits, calculate ROI and payback, and address implementation, adoption, IT and security risks before they become objections.