Capital Expenditure (CapEx) Planning Made Simple in Farseer

Ask any finance professional what CapEx season feels like, and you’ll hear some version of the same story. Requests scattered across a dozen spreadsheets. A depreciation schedule that quietly drifts out of sync with the fixed asset registry. A three-statement model that doesn’t reflect half the approved projects. And a CFO asking why EBITDA looks fine while cash is down 2 million.
The concept behind CapEx isn’t the hard part. Buying an asset and depreciating it over time is first-year accounting. What’s hard is keeping it connected. Most finance teams plan CapEx in one place, track depreciation in another, and update the cash flow forecast somewhere else entirely. Three separate stories about the same asset, and they rarely agree.
That’s the exact problem Farseer’s CAPEX module was built to solve. Rather than treating CapEx as a spending list bolted onto a budget, the module ties every planned asset directly into the P&L, the balance sheet, and the cash flow statement. This article walks through that model step by step. Along the way, you’ll pick up the core CapEx planning concepts that apply no matter what tool you’re using to model them.
Why CapEx Planning Shouldn't Live on Its Own
Capital expenditure is money spent on assets that serve the business for more than a year. Machinery, vehicles, buildings, IT infrastructure, major software builds.
The accounting treatment is what sets CapEx apart from a normal expense. Rent and salaries hit the P&L the month you spend them. CapEx doesn’t. The cash leaves immediately, but the cost only reaches the P&L gradually, through depreciation, spread across the asset’s useful life. A $600K machine depreciated over ten years costs the P&L $5K a month. The bank account felt the full $600K on day one.
That gap between when cash moves and when profit moves is the whole reason CapEx planning deserves its own discipline. When I plan a new asset, I need to know three things at once: what it costs, when the cash actually leaves, and when depreciation starts changing the P&L. Miss any one of those and your forecast is wrong in a way that doesn’t show up until the numbers land somewhere nobody expected.
This is exactly the idea behind the CAPEX module in Farseer. It brings together existing fixed assets, planned capital expenditures, depreciation, net book value, and the three financial statements into one connected model, instead of scattering them across separate files.
Two Connected Parts of the CAPEX Module
The module is built from two closely related submodels.
The fixed asset registry holds the assets the business already owns. The capital expenditures plan holds the assets the business expects to buy in the future. Structurally they’re nearly identical. What differs is purpose and ownership.
The fixed asset registry is generally maintained by accountants, because it records the current asset base and its accounting attributes. The CapEx plan is generally maintained by planners, because its where future investment decisions get modelled and stress-tested. Together, the two areas give you a complete picture: assets already in service, and assets that are planned to enter service later.
This split matters more than it sounds. If you plan future CapEx without a clean view of the existing base, you’re forecasting depreciation on half the story. Existing assets carry committed depreciation into every future period whether you plan a single new purchase or not. Get that baseline wrong, and your P&L forecast is broken before the CapEx conversation even starts.
Managing Existing Assets in the Fixed Asset Registry
The registry gives a detailed view of current assets by asset class. For each one, you retain key attributes: useful life in months, original purchase value, and current asset class.
In practice, this data usually comes from your ERP or another source system, imported straight in. That gives you a real starting point instead of forcing the finance team to rebuild the fixed asset base by hand from a PDF export or a stale spreadsheet.
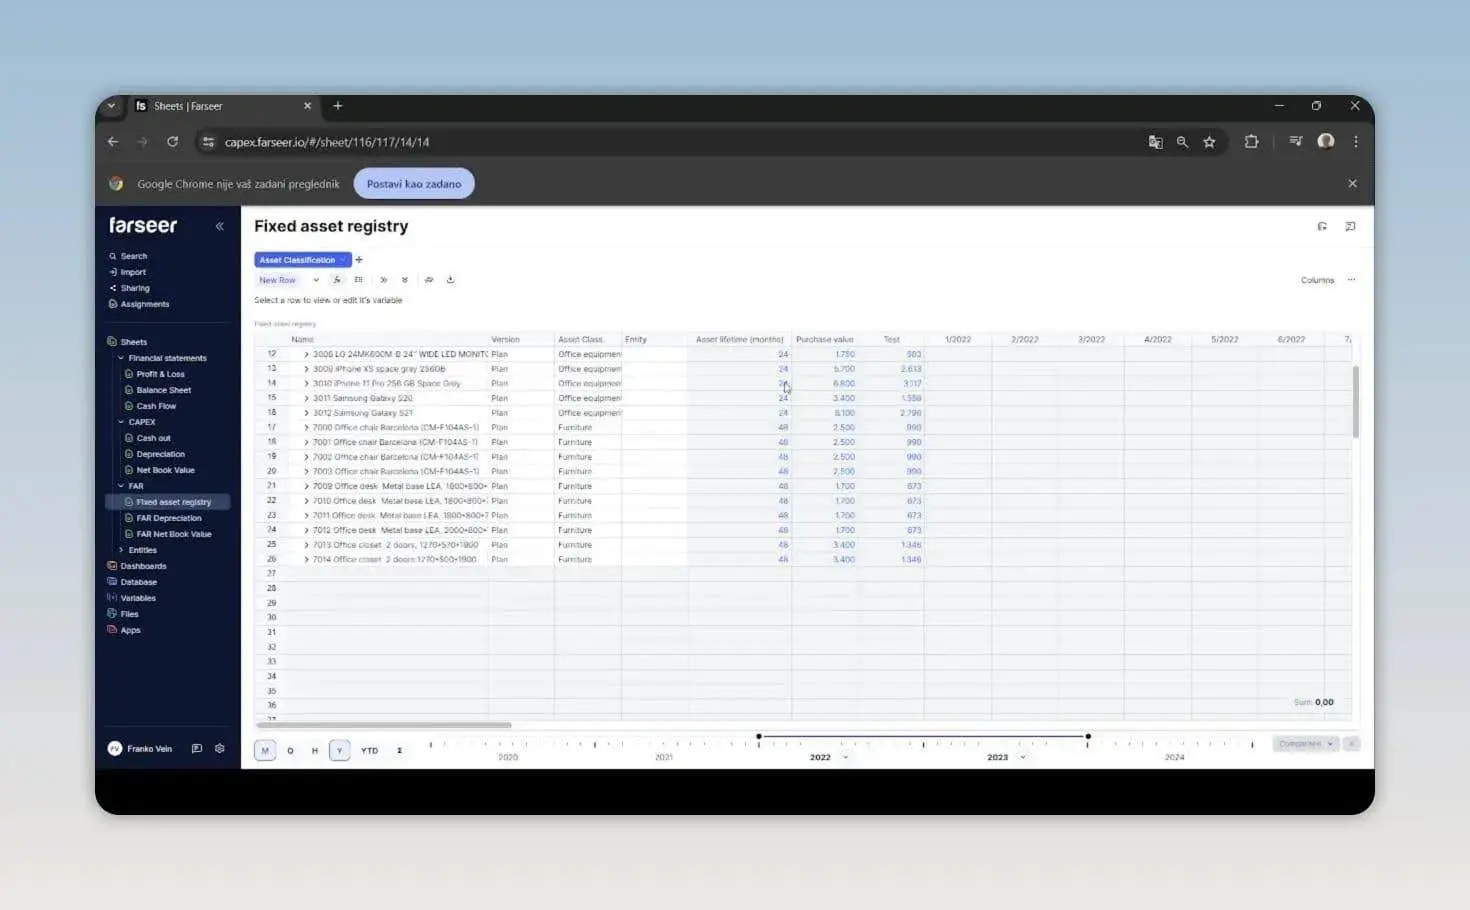
Expand any asset in the registry and three rows follow it through time:
- Depreciation. The periodic expense recognized over the asset’s useful life.
- Purchase value. The original cost, unchanged.
- Net book value. The remaining carrying value after accumulated depreciation.
Watch those three rows move across the timeline and the whole asset lifecycle becomes visible. Purchase value stays flat. Depreciation gets charged period by period. Net book value steps down accordingly. Dedicated depreciation and net book value sheets give the granular version of the same logic, while the main registry view keeps things compact enough to scan asset by asset.
Planning Future Capital Expenditures
The CapEx planning area runs on the same core logic, applied to assets that haven’t joined the existing base yet.
For each planned item, you define:
- The asset class
- The depreciation rate or assumptions
- The purchasing entity, since in a group structure the buyer is often a subsidiary, not the parent
- The timing and value of the purchase
- The activation date
That last field is where most spreadsheet models quietly go wrong, and it’s worth slowing down on.
Why purchase date and activation date are not the same thing
An asset doesn’t necessarily start depreciating the moment cash leaves the business. You can plan the purchase date completely separately from the date the asset actually gets activated and put into use.
Here’s an example. Say you’re planning a computer purchase. You buy 10,000 units worth in February and add another 50,000 in March. Total planned value: 60,000.
But the computers aren’t activated until May 1. With a monthly depreciation rate of 2,500, depreciation only begins in May, not February or March. In the activation month, net book value drops from 60,000 to 57,500, and it keeps declining from there as further depreciation is charged.
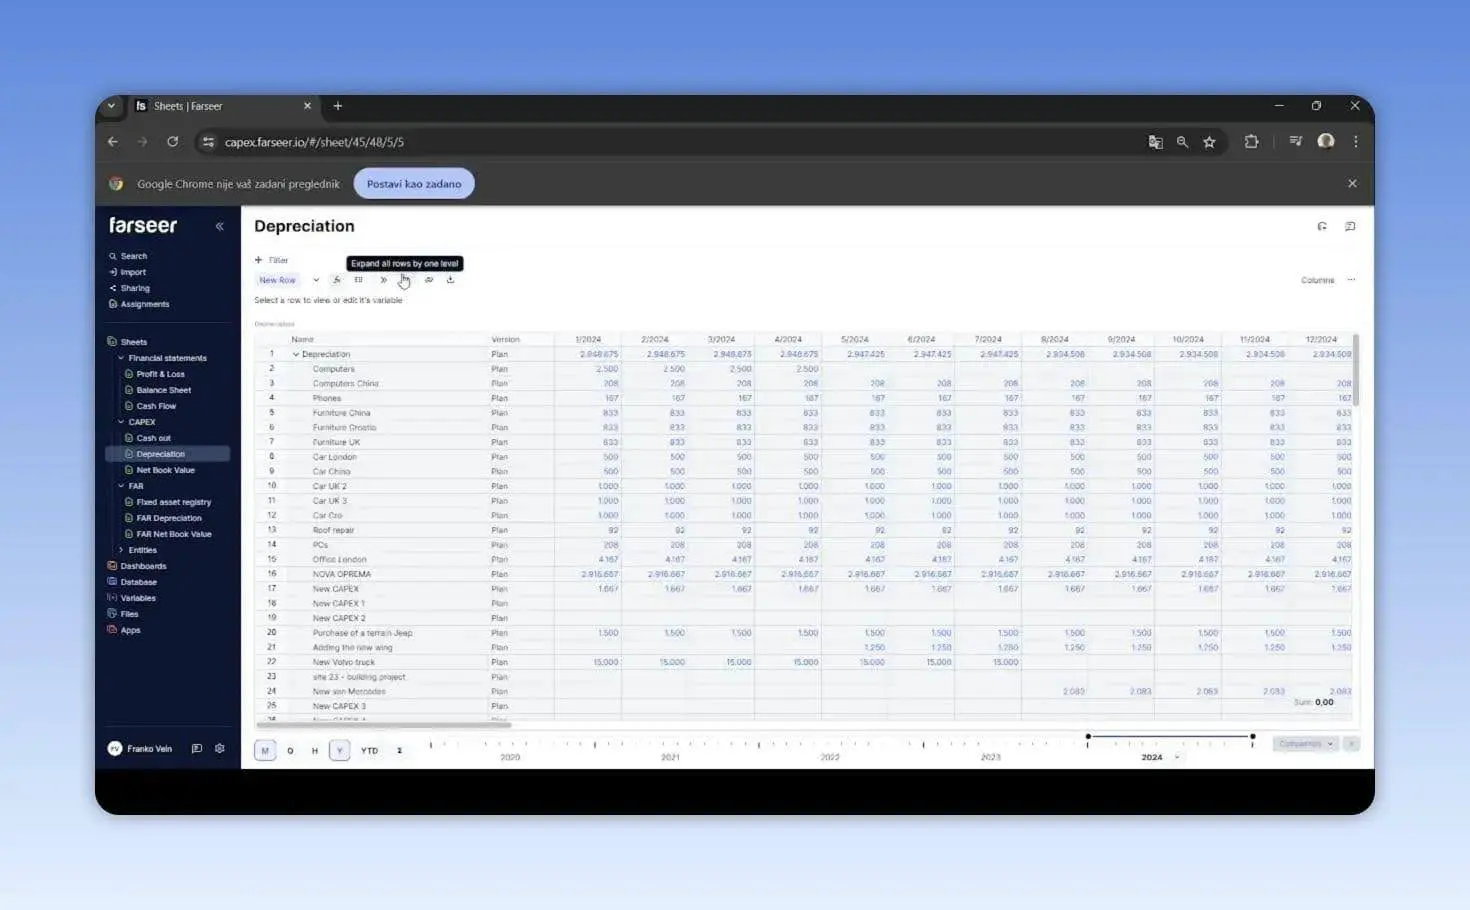
This distinction keeps the model honest about how the investment actually behaves. Cash goes out when you pay. The asset appears on the books at full value once it’s purchased. But depreciation, and the P&L impact that comes with it, only starts once the asset is genuinely in use. Collapse those three dates into one, which is what most Excel models do by default, and your CapEx forecast will misstate cash timing, P&L timing, or both.
What decides whether a planned purchase belongs in the model at all
Not every request that lands on a planner’s desk deserves a spot in the CapEx plan. Before an item gets its activation date and depreciation rate assigned, it usually needs to clear some version of an investment case.
For smaller, routine purchases, like the computer example, that case might just be a budget check and a manager’s sign-off. For larger investments, finance typically runs the numbers properly: payback period for a quick read on how fast the cash comes back, net present value to see if the investment creates value once you account for the cost of capital, and internal rate of return when leadership wants a single percentage to compare against a hurdle rate.
This evaluation step happens before the asset enters the CapEx plan, but it shapes everything downstream. The purchase value you enter, the timing you commit to, the entity that buys it, all of that comes out of the business case. A connected model doesn’t replace that judgment call. It just makes sure that once the decision is made, every financial consequence of it is tracked automatically instead of manually.
It also helps to separate requests by purpose before they compete for the same budget. Maintenance CapEx keeps the existing business running: replacing worn equipment, mandatory safety upgrades, end-of-life IT refreshes. It tends to get funded first because the alternative is an operational problem, not a missed opportunity. Growth CapEx competes on expected returns instead, new capacity, new markets, new automation. Tag every planned item as one or the other early, and prioritization conversations get a lot more honest.
How CapEx Flows into the Three-Statement Model
This is where Farseer’s CAPEX module becomes extremely useful. Every part of an asset’s lifecycle maps to the financial statement where it belongs.
Depreciation flows to the P&L. The profit and loss statement reflects cumulative depreciation across every asset item, existing and new. When the planned computers activate in May, depreciation expense increases in that specific month, because that’s when the new asset entered service. Nothing moves in the P&L before then. This is exactly why activation timing matters so much: a purchase can affect cash well before it ever touches profitability.
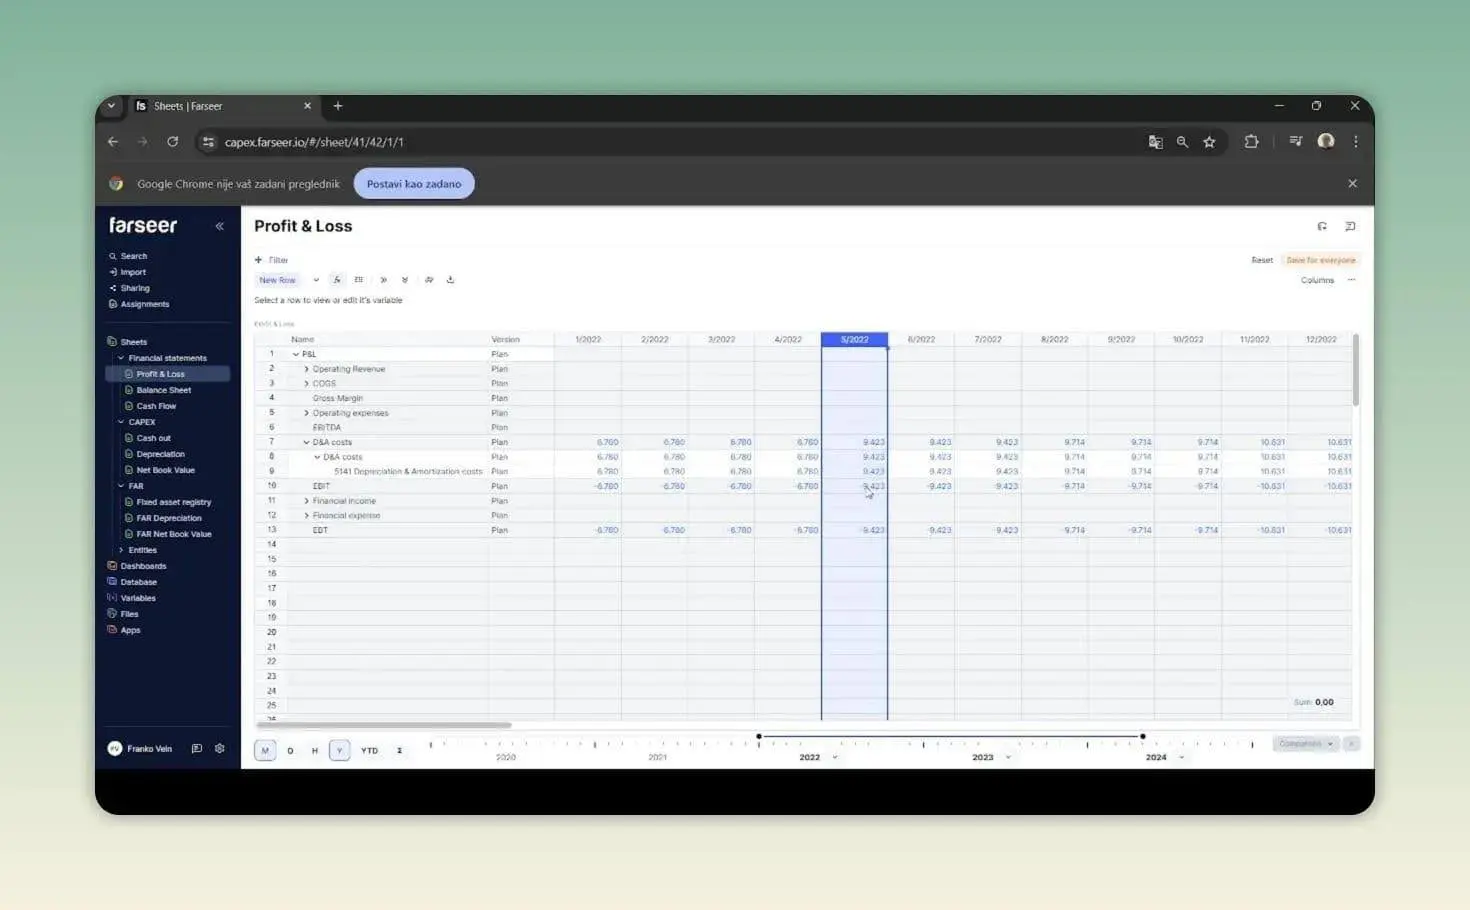
Net book value flows to the balance sheet. The model maps net book value into the right property, plant, and equipment category. The planned computers, for example, show up under office equipment at their current carrying value. As time passes and depreciation accumulates, that value declines. When new assets activate later, the balance sheet reflects the cumulative net book value for the asset class, while still letting you trace each individual asset’s movement underneath.
Planned expenditures flow to the cash flow statement. Investing activities capture the actual timing of the outflow. In the computer example, that’s a 10,000 outflow in February and a 50,000 outflow in March, exactly matching the planned cash-out schedule. These amounts are not delayed until activation. For CapEx purchases, investing cash flows reflect the timing of cash payments.
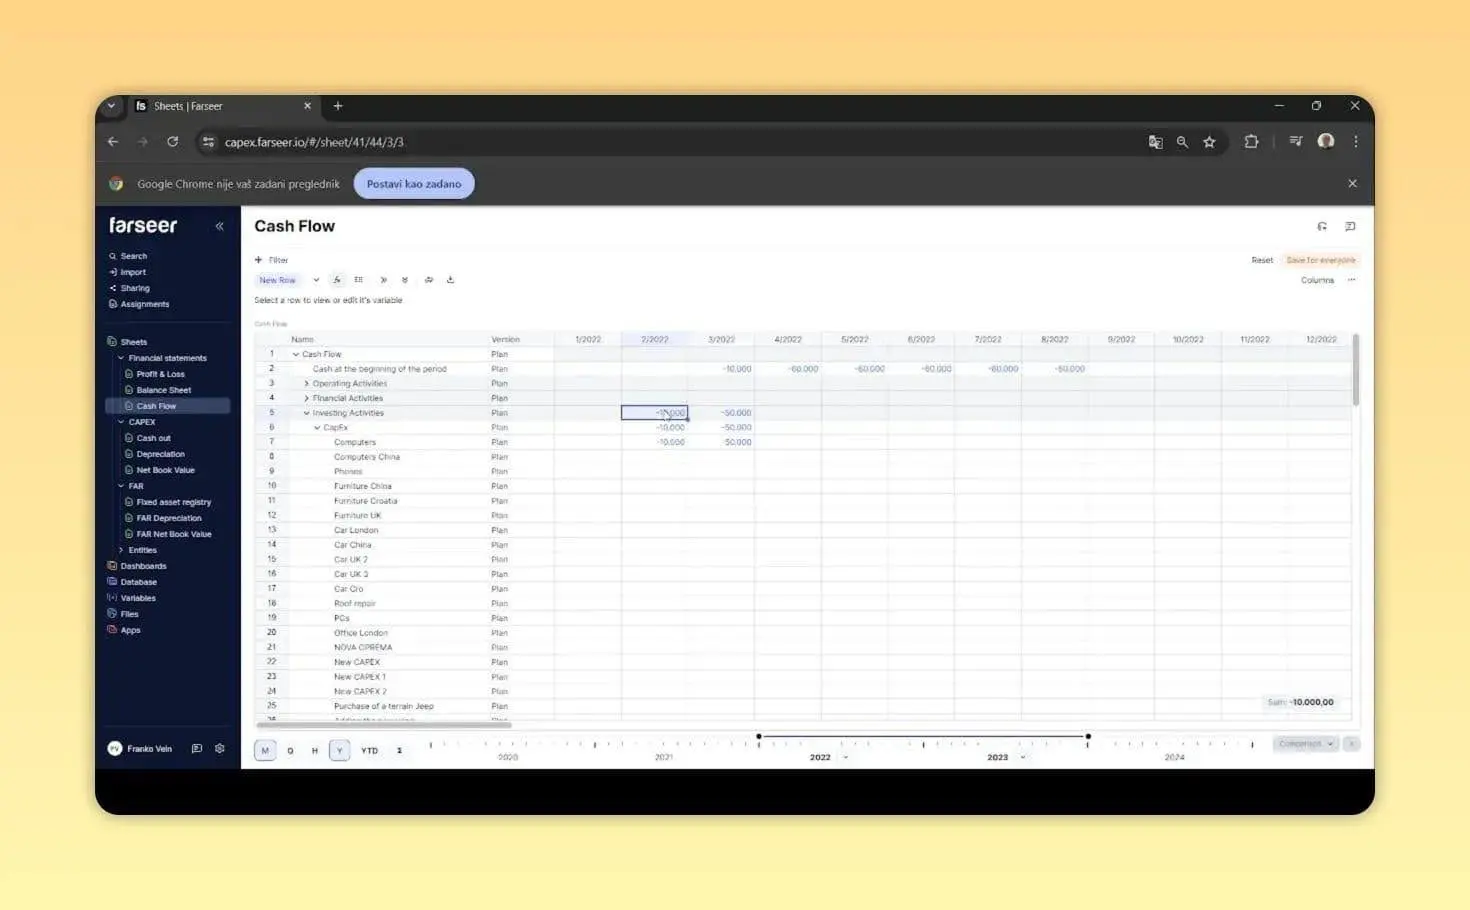
Three effects, three statements, three different clocks. Depreciation on the activation clock. Net book value on the depreciation clock. Cash on the payment clock. If you take one framework away from this article, make it that one. It’s the answer the next time someone in the business asks why a newly approved machine “isn’t in the numbers yet.”
A Simple CapEx Modelling Flow
This logic holds regardless of what tool sits underneath it, a platform, a spreadsheet, or something in between.
- Load or maintain the existing asset base in the fixed asset registry.
- Capture planned investments in the CapEx plan, including class, entity, value, timing, and activation date.
- Calculate depreciation and net book value over time for every asset, existing and planned.
- Map depreciation to the P&L.
- Map net book value to the balance sheet.
- Map planned spending to investing cash flows.
Run through these six steps and you get one connected process instead of a pile of disconnected spreadsheets. Start from the current asset position, layer in future investments, and you immediately see the impact on profitability, financial position, and liquidity, all at once, instead of reconciling three separate files a week before the board meeting.
Why Keeping Existing Assets and Planned CapEx Separate Actually Helps
It might seem simpler to just dump everything into one big asset list. In practice, the separation is what makes the model usable.
Accountants maintain the fixed asset registry because that’s their job: recording what the business actually owns, accurately, for audit and tax purposes. Planners focus on the CapEx plan because that’s their job: modelling future investment decisions and running scenarios against them. Different owners, different cadences, different pressures. Forcing both into one undifferentiated list creates friction for everyone and accountability for no one.
What keeps the two areas compatible is that they share the same depreciation and net book value mechanics underneath. An asset is an asset, whether it’s already on the books or still a proposal. That consistency is what lets historical reality and forward-looking planning sit inside the same three-statement model without translation errors between them.
The payoff shows up everywhere at once. New assets import cleanly from source systems. Future expenditures get modelled quickly, without waiting on IT or a spreadsheet rebuild. And every material financial effect, cash, profit, and balance sheet position, stays visible across the statements where it belongs.
Where This Changes How FP&A Actually Works
Once CapEx planning lives inside a connected model instead of a spreadsheet chain, a few things that used to be painful become routine.
Trade-off decisions get faster. New machine versus upgrading the existing line? Build both as scenarios, each with its own value, useful life, and activation timeline. Compare the P&L, cash, and balance sheet impact side by side, and the investment committee meeting starts with numbers instead of gut feel.
Reforecasting stops being a fire drill. Projects slip. Costs come in over budget. Update the purchase timing or value on the specific asset affected, and the three statements adjust automatically. What used to eat a weekend now takes an afternoon.
Collaboration doesn’t fall apart under version control. Department heads enter requests using the same standardized drivers: asset cost, useful life, start date. Finance reviews inside the same model. There’s one current version of the plan, and it’s the one everyone is actually looking at.
Three Mistakes Worth Checking Your Own Process For
Even with the right structure, a few habits quietly undermine CapEx plans more than anything else.
- Collapsing payment and activation into one date. This is a common technical error in spreadsheet CapEx models, and it corrupts all three statements simultaneously. If your model can’t show a purchase date and an activation date as two separate fields, it can’t produce an accurate P&L or cash forecast.
- Forecasting new investments while ignoring the existing base. New requests get all the attention in planning meetings, but committed depreciation from assets you already own is often the bigger number. Forecast both together, or the P&L forecast is only half real.
- Treating the annual CapEx budget as fixed once it’s approved. A CapEx plan signed off in November is already stale by March. Prices shift, projects slip, priorities change. Build a reforecast cadence into the process, monthly or at least quarterly, and revisit assumptions at the individual asset level rather than the total budget line. This is only realistic if updating one asset doesn’t require rebuilding three separate schedules by hand, which is precisely why the purchase-timing and activation-timing fields need to live on the same asset record in the first place.
A Quick Gut Check for Your Own CapEx Process
Before moving on, it’s worth running your own current process through a short test. Pull up your most recent significant CapEx model and ask four questions.
Can you see the current net book value of your existing assets without opening a separate file? Can you tell, for any planned purchase, the exact month cash leaves the business versus the month depreciation starts? If you delayed a project by two months, could you see the updated P&L, balance sheet, and cash flow impact in minutes, or would that take an afternoon of formula surgery? And if an auditor asked why your balance sheet PP&E balance doesn’t match your depreciation schedule for a given month, could you answer immediately?
If any of those questions gave you pause, that’s not a personal failing. It’s a sign the model is doing accounting and planning as two disconnected jobs instead of one continuous one. That’s the gap a connected CapEx model, like the one built into Farseer, is designed to close.
The Takeaway
CapEx planning has a reputation for complexity it doesn’t fully deserve. The underlying model is three clean rules: depreciation to the P&L once the asset is available for use, net book value to the balance sheet, cash to the cash flow statement when you pay. Keep an accurate existing asset base, keep purchase and activation dates separate, and the rest is mechanical.
None of that requires exotic finance theory. It requires discipline about dates, and a system that won’t let purchase timing and activation timing collapse into the same field just because that’s the path of least resistance under a deadline.
What makes it feel hard in practice is tooling that forces you to enforce those rules by hand, asset by asset, month by month, forever. A connected model like Farseer’s CAPEX module builds the rules in, so a planned purchase carries its own financial consequences with it, from the moment it’s entered to the moment it shows up in the board pack.
Pick your most recent major asset purchase and trace it through your own three statements. If the purchase date, activation date, and cash timing don’t line up cleanly, you’ve found your next process fix. And if you’d rather see the connected version working against your own asset registry, a Farseer demo is a fast way to find out.
FAQ
What is CapEx in FP&A?
Capital expenditure (CapEx) is spending on assets that provide benefits over multiple periods, such as machinery, buildings, vehicles, technology infrastructure and certain long-term software investments. In FP&A, CapEx planning connects investment decisions with cash flow, depreciation, the balance sheet and long-term financial forecasts.
What is the difference between CapEx and OpEx?
CapEx is spending that creates or improves a long-term asset and is generally capitalised on the balance sheet, with the cost recognised over time through depreciation or amortisation. OpEx is generally recognised as an expense in the period the underlying goods or services are consumed.
When does depreciation start for CapEx?
Depreciation generally begins when an asset is available for use, which may be later than the purchase or payment date. This distinction is important in CapEx planning because the cash outflow and P&L impact can occur in different periods.
How does CapEx affect the three financial statements?
CapEx affects all three financial statements differently. The cash payment generally appears as an investing cash outflow, the capitalised asset increases PP&E on the balance sheet, and depreciation subsequently reduces the asset’s carrying value while creating an expense on the P&L.
What is a CapEx budget?
A CapEx budget is a plan for expected capital investments over a defined period. It typically includes the investment amount, timing, asset or project category, purchasing entity, expected useful life and other assumptions needed to forecast the investment’s financial impact.
What is the difference between a fixed asset registry and a CapEx plan?
A fixed asset registry records assets the business already owns, while a CapEx plan models future investments. The two should ultimately connect so that existing depreciation and planned investments are reflected together in the financial forecast.
Why are purchase date and activation date different in CapEx planning?
The purchase date determines when the company expects to pay for an asset, while the activation or available-for-use date determines when the asset begins contributing to operations and, generally, when depreciation begins. Keeping the dates separate improves the accuracy of cash-flow and P&L forecasts.
How does CapEx affect cash flow?
CapEx purchases generally create investing cash outflows. Because the cash payment can occur before the asset begins generating depreciation expense, CapEx can reduce cash significantly before creating an equivalent P&L expense.
What is maintenance CapEx vs growth CapEx?
Maintenance CapEx generally relates to replacing or maintaining assets needed to sustain existing operations, while growth CapEx is intended to increase capacity, enter new markets or support expansion. Separating the two helps FP&A teams evaluate investment priorities and expected returns.
How should FP&A forecast CapEx?
FP&A should forecast CapEx at the asset or project level where material, including expected cost, purchase timing, purchasing entity, available-for-use or activation date, useful life and depreciation assumptions. The resulting investment, depreciation and balance-sheet effects should flow into the three-statement forecast.


Digital Transformation in Finance: How Finance Teams Break Out Of Digital Planning Purgatory With AI
Read more
Farseer raises $7.2M Series A to build the Enterprise Operating System for Finance
Read more