What is EBITDA And Why It Still Matters

Earnings Before Interest, Taxes, Depreciation, and Amortization (EBITDA) is a way to measure how profitable a company is from its core operations, leaving out the effects of how the business is financed, taxed, or structured in the books.
It’s one of the most talked-about metrics for a business, but also one of the most misunderstood.
The formula for EBITDA is well known, but what’s not is understanding what the formula tells to people of how well the business is running. This is especially a challenge in industries with high fixed costs or complex operations where EBITDA can give a clearer picture of day-to-day performance than bottom-line profit ever could.
Read more: A Complete Guide to Financial Statement Analysis for Strategy Makers
For larger companies with €100M+ in revenue, with multiple teams, multiple cost centers, EBITDA becomes a tool to track operational performance and compare business units, cleanly and consistently. That’s why it shows up everywhere: in M&A deals, lender reporting, and internal dashboards.
In this blog, we’ll break down what EBITDA really measures, where it’s most useful, where it falls short, and how companies with complex operations can use it as part of a more accurate performance and planning framework.
Why Companies Use EBITDA
Without distractions from financing, taxes, or accounting methods EBITDA gives a clear view of how the business is performing operationally. It’s fast to calculate, easy to compare, and widely used across any industry.
Here’s why it’s still one of the most used metrics in finance:
Focus on the business, not the structure
EBITDA helps to see is the business generating profit from its core operations. It removes the effects of financing, taxes, and non-cash accounting items, so the focus stays on what’s directly within operational control. This is especially important in large, multi-entity setups where tax policies and capital structures can vary widely.
Read Revenue vs EBITDA: Which Metric Should Drive Your Strategic Planning
Clean comparisons across units and regions
By removing interest and taxes, EBITDA allows a clear comparison between business units, countries, or product lines. This brings consistency to internal benchmarking, performance reviews, and acquisition screening, especially when financial structures differ across entities.
A fast way to estimate cash generation
Because EBITDA adds back non-cash expenses like depreciation and amortization, it provides a rough view of operating performance without getting into the details of the cash flow statement. While it doesn’t capture CAPEX or working capital, it’s often the first metric used in early-stage analysis or internal reporting.
A standard benchmark in valuation discussions
EBITDA offers a neutral base for assessing business performance to investors, lenders, and buyers. It’s the foundation for common valuation multiples and a key part of discussions around deal terms, covenants, and growth planning.
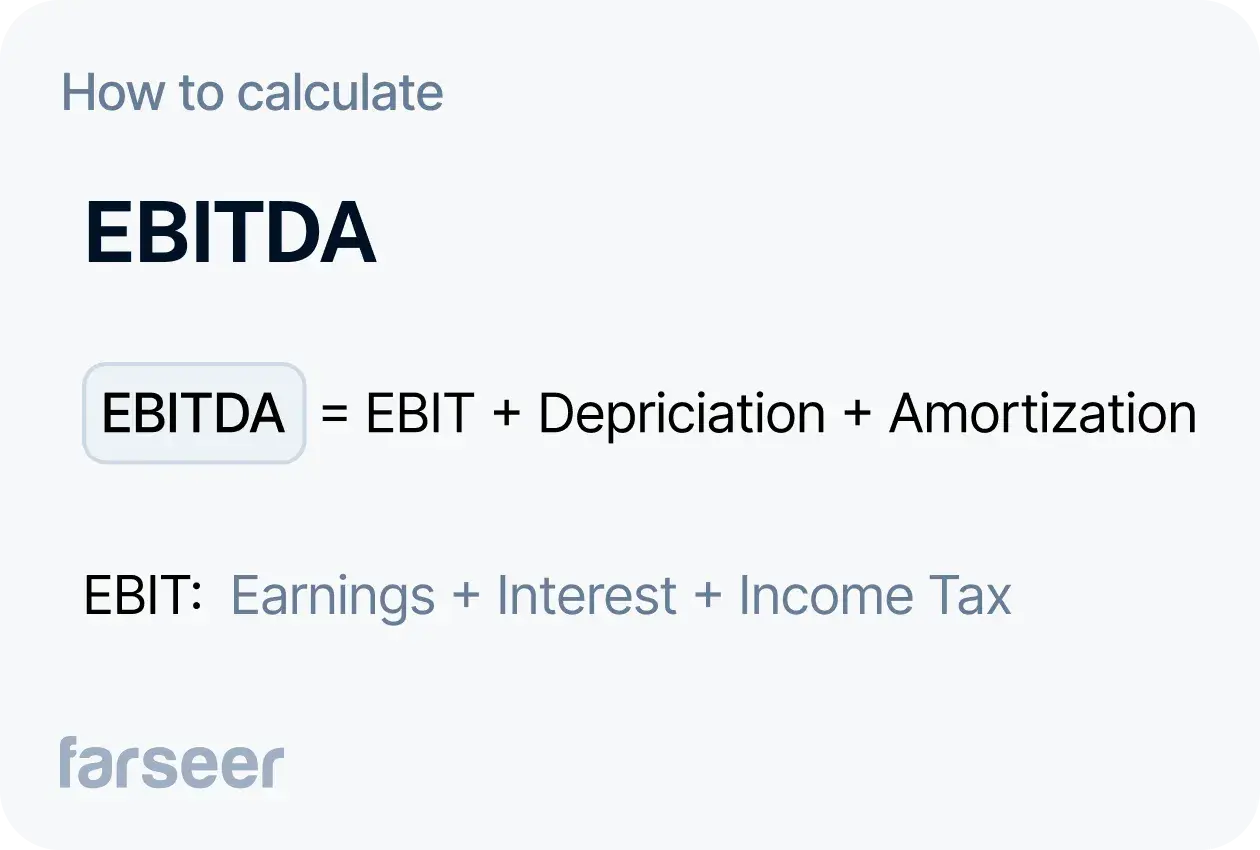
How to Calculate EBITDA
Although EBITDA isn’t a standardized accounting metric, it’s simple to calculate, and usually pulled directly from the income statement using one of two common methods.
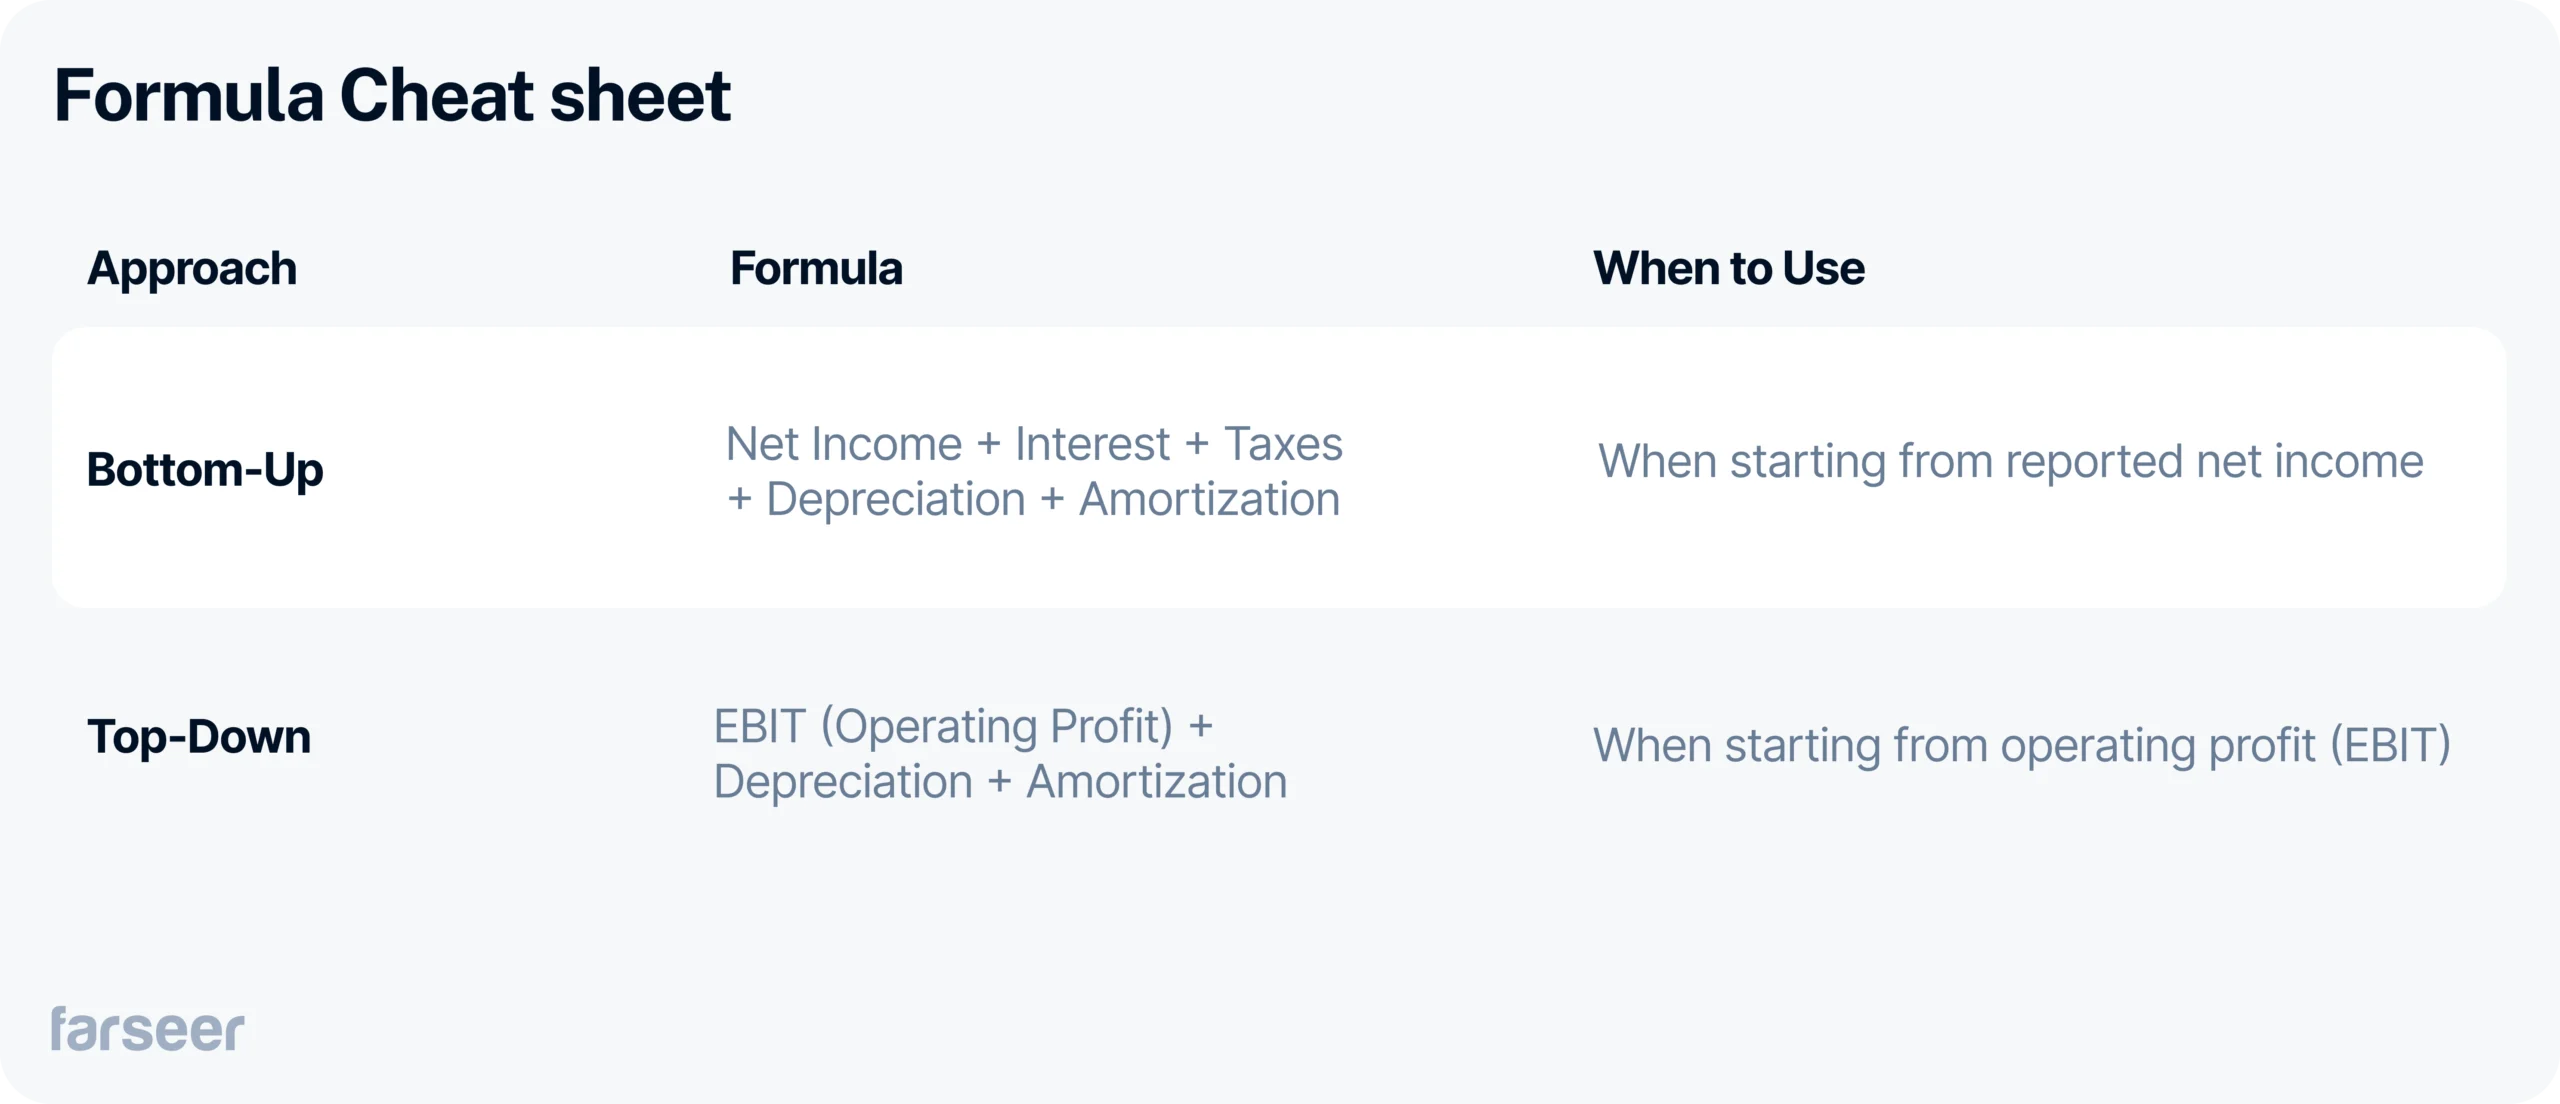
Method 1: Bottom-up approach
This approach starts from net income and adds back costs that don’t reflect day-to-day operational performance.
Formula:
Net Income + Interest + Taxes + Depreciation + Amortization
This is especially useful when you want to reconcile EBITDA from reported financials or filings.
Read more: EBITDA Calculator
Method 2: Top-down approach
Start from operating profit (EBIT), then add back non-cash items.
Formula:
Operating Profit (EBIT) + Depreciation + Amortization
This method is faster when you have clear OPEX breakdowns available.
Example calculation:
A mid-sized packaging company reports:
- Net income: €12M
- Interest expense: €4M
- Taxes: €3M
- Depreciation: €6M
- Amortization: €2M
Using the bottom-up method:
EBITDA = 12 + 4 + 3 + 6 + 2 = €27M
Or if the company reported EBIT of €19M:
EBITDA = 19 + 6 + 2 = €27M (top-down method)
EBITDA Formula Cheat Sheet
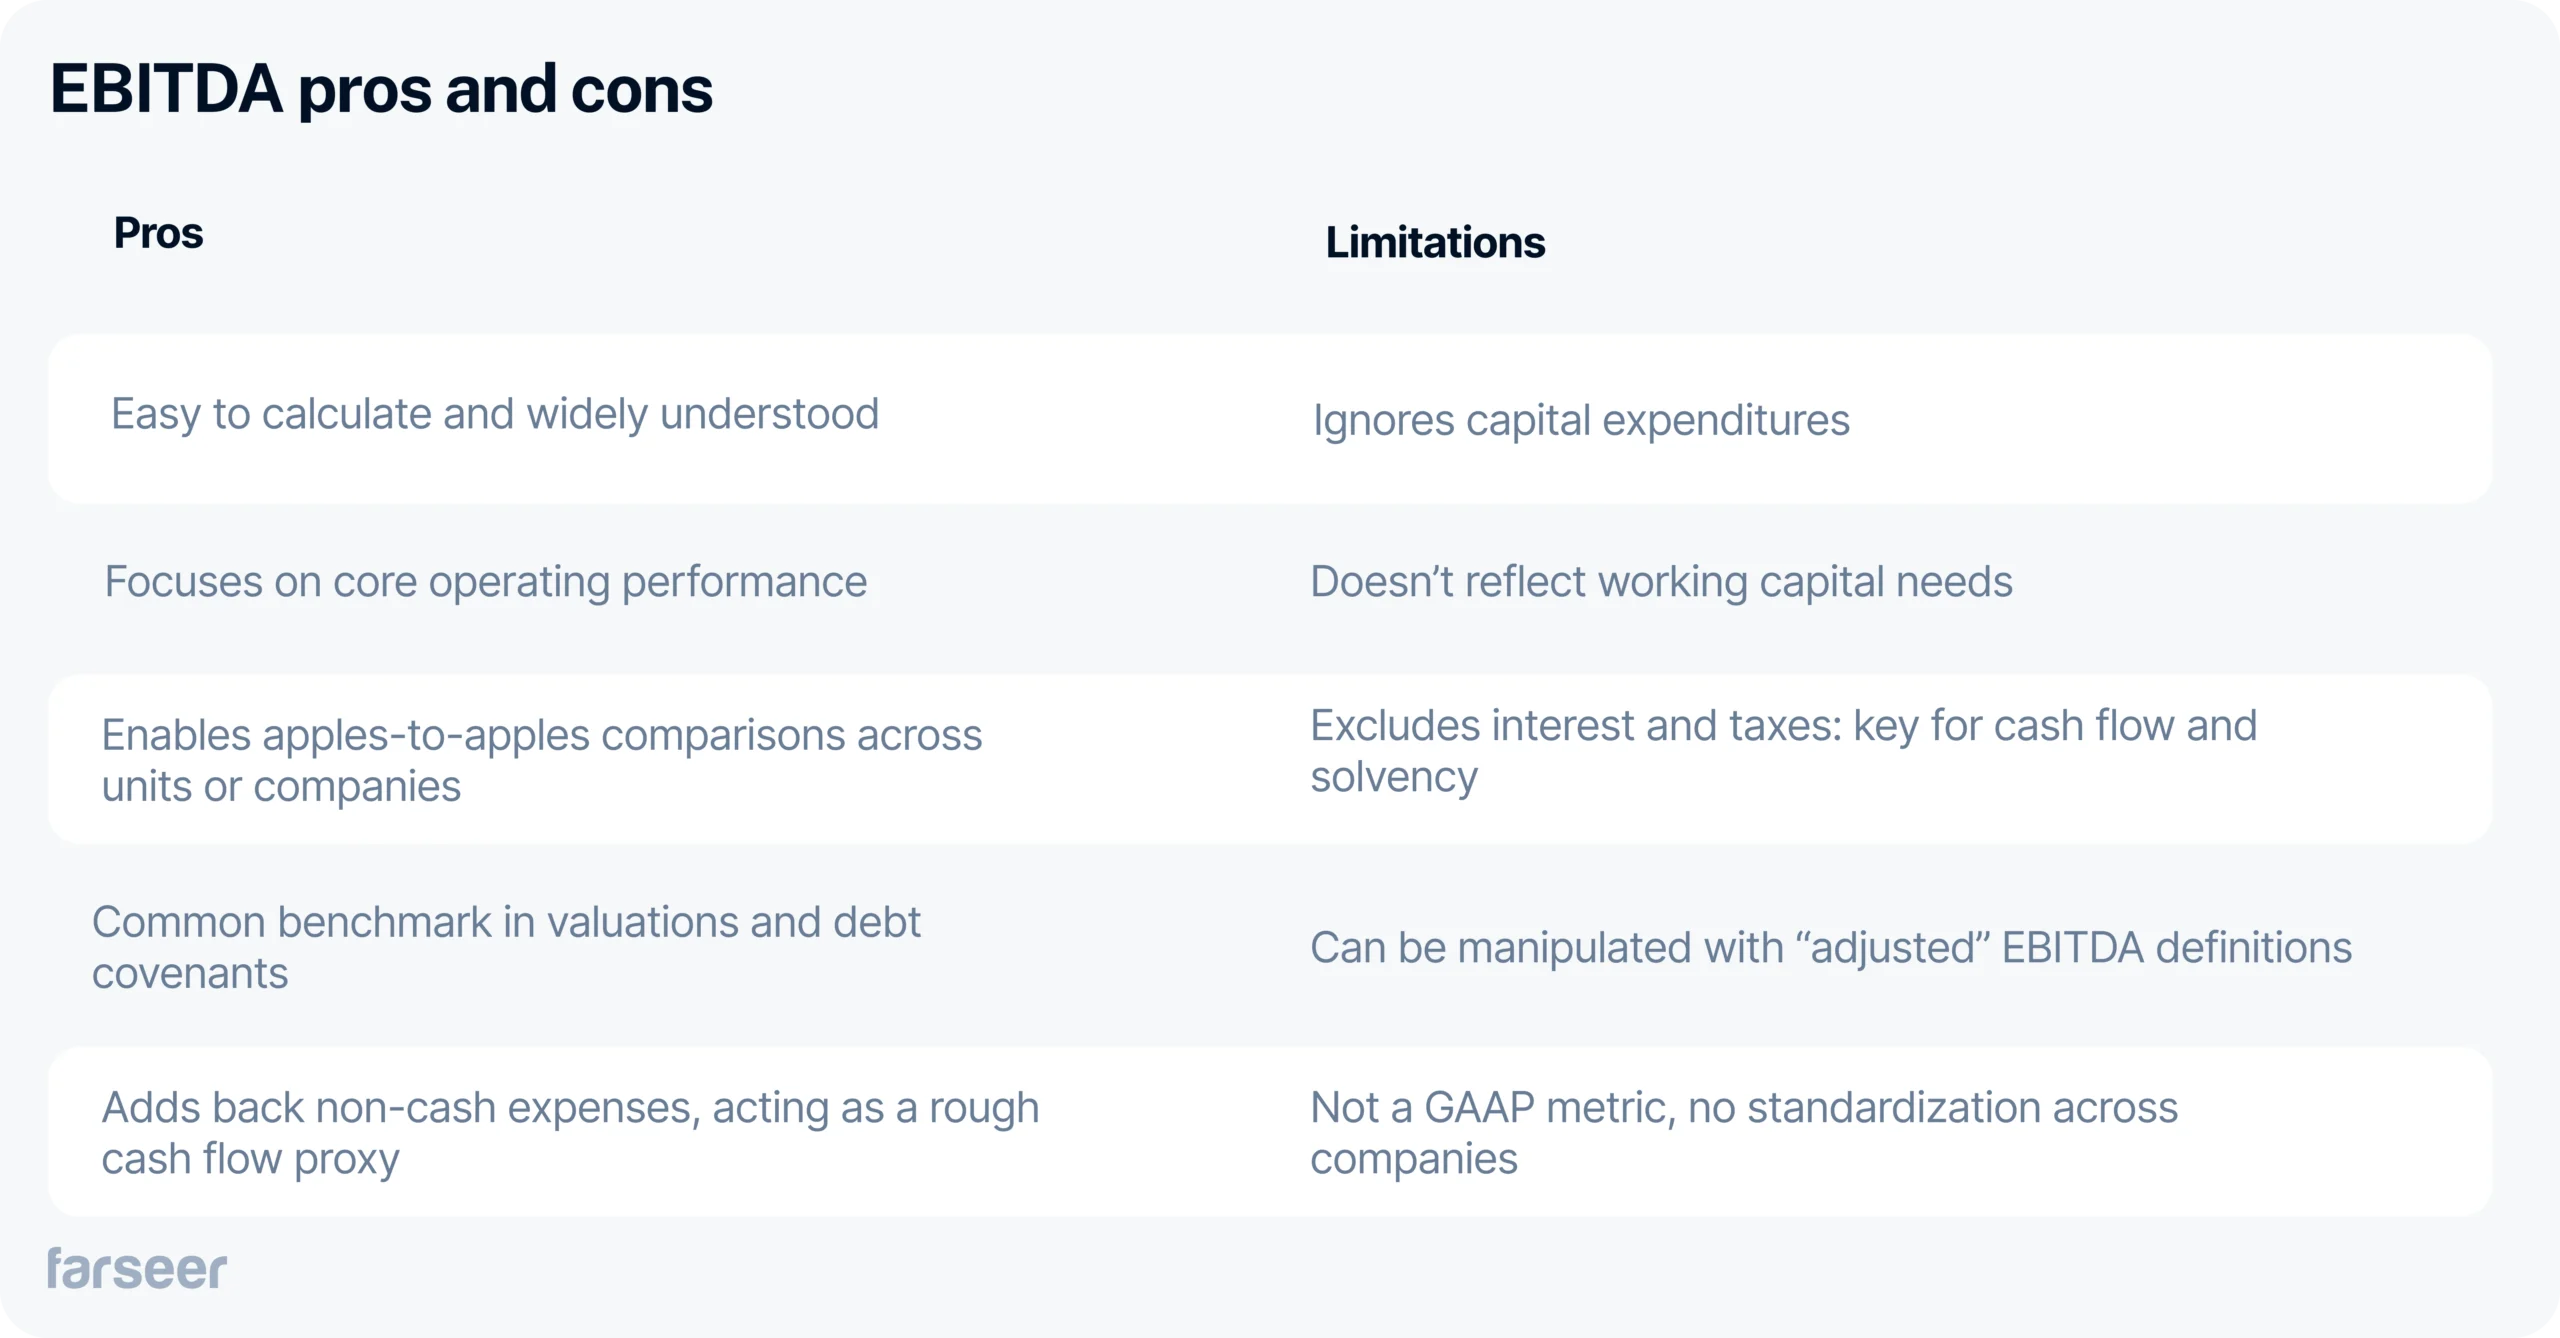
What EBITDA Shows (And What It Doesn’t)
EBITDA can tell a lot about the business, but not everything. When it’s used well, combined with other important features, it gives a focused view of operational performance. Used alone, it can paint an incomplete or even misleading picture.
What EBITDA shows:
- Operating profitability showing how much the company earns from its main business activities. For example, in 2025 Tata Motors’ EV division reported a positive EBITDA margin even though it wasn’t yet profitable on the bottom line—signaling that core operations were already generating value despite heavy upfront investment.
- Efficiency across business units comparing subsidiaries or product lines with different financing structures or tax regimes. Large diversified groups rely on this to see which parts of the business are actually performing. Adani Group’s record EBITDA in Q2 2025, driven mainly by cement and infrastructure, made it clear which segments were operationally strong even as net income fluctuated due to external factors.
- Scalability of the model when it grows faster than revenue, it’s often a sign that operational leverage is improving. This pattern tends to emerge once fixed costs remain relatively stable while gross profit rises, letting additional sales flow more directly into EBITDA rather than being absorbed by expenses.
Read Revenue vs Gross Profit: Understanding the Difference to Avoid Planning Errors
What EBITDA doesn’t show:
- Cash flow reality by ignoring working capital changes and capital expenditures, which are essential for understanding liquidity. For example, a consumer goods company might show consistent EBITDA growth while inventory levels and receivables are climbing, tying up cash and putting pressure on short-term operations.
- Debt servicing ability by excluding interest EBITDA doesn’t reflect whether a company can meet its financial obligations. A logistics firm with high EBITDA but significant debt repayments may appear financially healthy, while in reality, most of its operating profit is going toward servicing loans.
- Total cost of growth by showing strong EBITDA while aggressively reinvesting, which could lead to a cash crunch. A manufacturing company might report a healthy 22% EBITDA margin while spending €40M annually on equipment just to maintain output. On paper, performance looks solid, but in reality, cash is tight, and EBITDA alone doesn’t reveal that pressure.
Use EBITDA, but Know Its Limits
EBITDA is a great metric to use in complex organizations where there is a need for a consistent way to compare performance across countries, cost centers, or product lines. It removes the noise of taxes, interest, and non-cash charges so you can focus on what the business is generating at its core.
That’s why it’s standard in M&A, group reporting, and internal dashboards. And for companies with multiple entities or decentralized operations, it’s one of the cleanest ways to measure contribution and efficiency.


Financial Statement Analysis: The Complete Guide (With Step-by-Step Process)
Read more
Best Financial Analysis Tools in 2026: Compare Features & Pricing
Read more