Revenue Run Rate: What It Is, How to Calculate It, and How to Use It

Revenue run rate provides a rapid method of estimating annual revenue on the basis of recent results and can be used to determine whether your business is ahead of or behind plan, to compare actual results with forecasts, or to get a quick idea of revenue trends.
This number is most helpful when you also think about what affects revenue. Factors like seasonality, pricing, sales volume, product mix, acquisitions, and changes in demand can all make a difference.
Read more: What Great Financial Reporting and Analytics Actually Look Like
This guide explains how to calculate revenue run rate, what it means, and how to use it with your revenue forecast to improve planning and reporting.
What Is Revenue Run Rate and How Do You Calculate It?
Revenue run rate estimates annual revenue by taking the revenue from a recent month, quarter, or other period and projecting it over a full year.
The formula is simple:
Revenue Run Rate = Revenue for the Period × Number of Those Periods in a Year
For example, if a company generates €12 million in one month, its monthly revenue run rate is:
€12 million × 12 = €144 million
If the same company generates €36 million in one quarter, the calculation is:
€36 million × 4 = €144 million
This method helps you quickly turn recent results into an annual number. You can then compare it with your budget, latest forecast, or last year’s results.
The period you choose is important. One month might show a price increase, a big customer order, or a change in product mix. Looking at a quarter usually gives a broader view and smooths out short-term changes.
Because of this, finance teams often calculate revenue run rate at different levels. They might start with total company revenue, then break it down by business unit, market, product group, or sales channel.
Breaking it down helps you see where changes are coming from and whether they show a bigger trend or just affect one part of the business.

Revenue Run Rate vs. Revenue Forecast
Revenue run rate and revenue forecast both look ahead, but they answer different questions.
Revenue run rate asks: What would annual revenue look like if recent performance continued?
A revenue forecast asks: What do we expect revenue to be based on what we know about the business?
This difference is important.
Revenue run rate uses recent actual revenue and projects it over a year. This quick calculation gives you a clear view of recent performance as if it continued for a full year.
A revenue forecast takes things further. It includes factors that could change future revenue, like sales volume, pricing, customer demand, product mix, seasonality, new contracts, or production capacity.
For example, a manufacturer may calculate a €200 million revenue run rate based on its latest quarter. However, the latest forecast may show €190 million because the company expects lower demand in one market and a planned production shutdown later in the year.
These two metrics work well together. Revenue run rate shows what recent results would look like over a year, while the forecast shows what the company expects to happen next.
| Revenue run rate | Revenue forecast | |
| 1 | Based mainly on recent actual revenue | Based on actuals and future assumptions |
| 2 | Annualizes recent revenue performance | Estimates expected future revenue |
| 3 | Quick to calculate | Requires more detailed planning |
| 4 | Useful for performance checks | Useful for planning and decision-making |
| 5 | Changes when recent actuals change | Changes when actuals or assumptions change |
In practice, comparing these two numbers can show helpful differences.
If the revenue run rate is higher than the forecast, you can check if recent growth will last. If it is lower, you can look at the assumptions behind the expected increase.
Comparing these numbers turns a simple revenue metric into a useful tool for forecasting, variance analysis, and management reporting.
Where Revenue Run Rate Adds Context
Revenue run rate is helpful when you want to see recent revenue performance in a bigger context.
A month or a quarter gives you a snapshot. Revenue run rate turns that into an annual number, making it easier to compare recent performance with your budget, forecast, or last year.
When Revenue Run Rate Helps
This extra context can help in several situations:
- Monthly and quarterly reviews: You can see whether recent revenue is moving in line with the annual plan.
- After a price change: You can estimate how the new pricing level may affect annual revenue.
- When sales volumes shift: You can see how stronger or weaker demand changes the overall result.
- After adding capacity: You can measure how new production capacity may affect revenue.
- When entering a new market: You can compare early results with the assumptions behind the plan.
- After an acquisition: You can get a faster view of the combined revenue base.
When Revenue Run Rate Needs More Context
Revenue run rate assumes the period you pick can stand for the rest of the year. This means your choice of period can strongly affect the result.
Seasonality is one of the clearest factors. A strong quarter in retail, FMCG, or hospitality may reflect peak demand rather than normal trading conditions.
One-off contracts or large customer orders can have a similar effect.
Price changes can also shift the result. Revenue may increase because of higher prices even when sales volume stays flat.
Similarly, temporary production limits, supply problems, currency changes, or shifts in product mix can change revenue without showing a lasting change in demand.
Look at What Is Driving the Change
Once you calculate the run rate, review the main factors behind it.
Look at price, volume, sales mix, seasonality, demand, customer concentration, and market performance.
This helps you see more clearly why revenue has changed and whether the annualized result matches the bigger business picture.

Revenue Run Rate vs. ARR, MRR, and TTM Revenue
Revenue run rate often appears alongside ARR, MRR, and trailing twelve-month revenue. These metrics all describe revenue, but they measure different things.
Revenue Run Rate vs. ARR
Revenue run rate annualizes recent revenue performance.
ARR, or annual recurring revenue, measures the value of recurring revenue expected over a year.
The main difference is the type of revenue each one measures.
Revenue run rate can include any revenue generated during the selected period. ARR focuses on recurring revenue, which makes it more relevant for subscription-based business models.
For instance, a company may report a €120 million revenue run rate based on its latest quarter. That figure can include recurring sales, one-off orders, and other revenue.
ARR would include only the recurring part.
Revenue Run Rate vs. MRR
MRR stands for monthly recurring revenue. It shows how much recurring revenue a company generates each month.
Companies can use MRR to calculate ARR:
ARR = MRR × 12
Revenue run rate uses a similar calculation, but the revenue does not have to be recurring.
Because of this, MRR is mainly useful for companies with subscription or contract-based revenue.
Revenue run rate works for more types of businesses, including manufacturing, distribution, retail, and services.
Revenue Run Rate vs. TTM Revenue
TTM revenue, or trailing twelve-month revenue, looks backward. It adds up the actual revenue generated during the previous 12 months.
Revenue run rate takes a recent short period and projects it over a full year.
For example, if a business has grown quickly during the latest quarter, its revenue run rate may sit above its TTM revenue. That gap can show how much recent performance has changed compared with the previous year.
In short:
- Revenue run rate annualizes recent revenue performance.
- ARR measures annual recurring revenue.
- MRR measures monthly recurring revenue.
- TTM revenue shows actual revenue from the previous 12 monts
Knowing these differences helps you pick the right metric for your needs.
How to Get More Value from Revenue Run Rate
Revenue run rate is more useful when you link it to how your business actually makes money.
Start by comparing the result with your budget, latest forecast, and last year’s performance. This quickly shows if recent results are moving as you expected.
Next, dig a little deeper.
Look at Revenue by Business Driver
One revenue number can hide important changes.
So, look at what makes up that number:
- Volume: Are you selling more units?
- Price: Have average selling prices changed?
- Sales mix: Are higher-value products making up a larger share of sales?
- Region: Is growth coming from one market or several?
- Customer mix: Are a few large accounts driving the increase?
- Channel: Are direct sales, distributors, or retail channels performing differently?
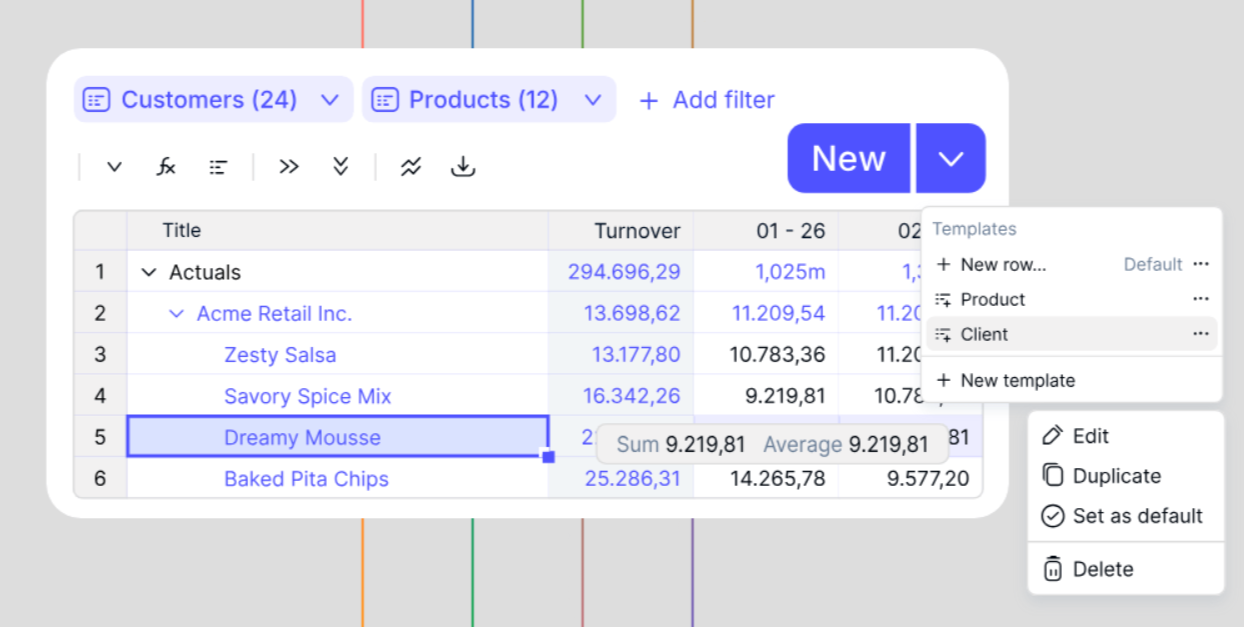
This helps you understand why revenue has moved. If you manage this analysis across several business units, markets, or products, tools such as Farseer can help bring actuals, plans, and forecasts into one place. That makes it easier to compare revenue run rate with the numbers you already use in planning and reporting.
Compare More Than One Period
One month’s results can change because of timing, big orders, or short-term shifts.
So, it often helps to compare several periods.
For instance, review the latest month, latest quarter, and year-to-date average side by side.
If all three move the same way, the trend is easier to understand. If they don’t, you know the latest result needs a closer look.
Adjust for Known Changes
Finally, include the business information you already know.
If prices will change next quarter, a new plant will start production, or a large contract will end, include that information when you review the run rate.
This links the calculation to real business activity and gives you a better base for revenue analysis.
What the Revenue Run Rate Tells You About Performance
The calculation is simple. What matters next is how the result compares with your budget, forecast, and any changes happening in the business.
Assume a manufacturer reports the following revenue in Q1:
- January: €9.2 million
- February: €9.8 million
- March: €10.5 million
That gives the company €29.5 million in Q1 revenue.
To annualize the result, multiply quarterly revenue by four:
€29.5 million × 4 = €118 million
So, the revenue run rate is €118 million.
Now you can compare this number with your annual budget, latest forecast, and last year’s revenue.
Focus on What the Gap Tells You
Suppose the company has:
| Metric | Revenue | |
| 1 | Annual budget | €115M |
| 2 | Revenue run rate | €118M |
| 3 | Latest forecast | €121M |
The run rate sits above budget, so recent performance is tracking ahead of plan.
At the same time, the forecast sits above the run rate. That means the business expects revenue to increase further during the year. That gap is where useful analysis begins.
You can now ask:
- Is higher volume driving the change?
- Has pricing improved?
- Is one product group growing faster than the rest?
- Will a new customer add revenue later in the year?
- Will seasonality push revenue higher in Q4?
When you’re comparing actuals, run rate, and forecast across a large data set, Farseer AI can help surface the changes behind the numbers and make it easier to see what is driving performance.
Add What You Know About the Rest of the Year
The manufacturer may expect a price increase, stronger Q4 demand, or a new customer contract.
Those factors explain why the forecast sits above the annualized Q1 result.
This is why the comparison matters. The run rate shows what recent performance would look like over a year, while the forecast adds what you expect to change.
Together, these two metrics give you a much clearer view of revenue performance than either one alone.
Use Revenue Run Rate to Read Performance Faster
Revenue run rate is a simple way to turn recent revenue into an annual number.
Use it to compare actual performance with budget, forecast, and prior-year results. Then, review the factors behind the difference.
This combination gives you a quicker and more useful view of where revenue stands and what might be affecting it.
FAQ
What is revenue run rate?
Revenue run rate is an estimate of annual revenue based on current performance over a shorter period, such as a month or quarter.
How do you calculate revenue run rate?
Use this formula:
Revenue Run Rate = Revenue for the Period × Number of Those Periods in a Year
For example, if quarterly revenue is €25 million, the annual revenue run rate is €100 million.
Is revenue run rate the same as annual revenue?
No. Annual revenue is the actual revenue generated over a full year. Revenue run rate is an annualized estimate based on a shorter period.
Is revenue run rate the same as ARR?
No. ARR measures annual recurring revenue. Revenue run rate can include recurring and non-recurring revenue.
What is the difference between revenue run rate and TTM revenue?
Revenue run rate annualizes recent performance. TTM revenue shows the actual revenue generated during the previous 12 months.
Can you use revenue run rate for forecasting?
Yes, but it works best as a reference point. A forecast adds business drivers such as price, volume, seasonality, sales mix, capacity, and demand.
When is revenue run rate most useful?
It is useful when you want a quick read on current performance, especially after changes in pricing, sales volume, capacity, market demand, or company structure.
What can affect revenue run rate accuracy?
Seasonality, one-off orders, price changes, acquisitions, supply limits, currency movements, and unusual sales activity can all affect the result.
Should you calculate revenue run rate monthly or quarterly?
Both can be useful. Monthly run rate gives a faster signal, while quarterly run rate can smooth out short-term changes.
What is a good revenue run rate?
There is no universal benchmark. A useful revenue run rate is one that you compare with your budget, forecast, prior-year results, and the business drivers behind current performance.


What Great Financial Reporting and Analytics Actually Look Like
Read more
Ad Hoc Reporting for Finance Teams Who Can’t Wait on IT
Read more