Record Revenue. Record Load Factors. But Negative Returns

The airline industry is facing a stark dichotomy. Topline growth could not be better.
- Total industry revenue is expected to climb from $1.065 trillion in 2025 to $1.165 trillion in 2026. A solid 9.4% increase.
- Efficiency is setting a record as airlines fill an average of 84.0% of available seats in 2026, an increase from 2025’s 83.5% load factor.
- Air traveler traffic is anticipated to hit 5.1 billion in 2026, a 2.4% increase over 2025 levels.
- Air freight shipments are slated for marginal growth, with cargo volume ticking up 0.2% from 2025 to 71.7 million tonnes in 2026.
The bottom line could not be worse.
- 2026 net earnings are projected to be $23.0 billion, approximately half of earlier forecasts ($41 billion) and nearly 50% below the estimated $45 billion recorded in 2025.
- Net profit margins are expected to compress to 2.0% in 2026, marking a steep drop from the previously anticipated 3.9% and less than half of 2025’s 4.2% margin.
- Profit generated per traveler is set to fall to $4.50 in 2026, cutting 2025’s $9.10 figure in half.
- Operating income is forecast at $48.0 billion (down from $76.4 billion in 2025), reducing the operating margin to 4.1% compared to 7.2% the previous year.
The result: Return on invested capital (ROIC) is projected to slip to 4.3%, falling well short of the forecasted 8.5% weighted average cost of capital (WACC) and highlighting the industry’s structural vulnerability to profit shocks. The numbers are getting worse. In December 2025, the IATA forecasted an industry ROIC of 6.8% and WACC of 8.2%. A fuel spike driven by a regional conflict cut 250bps, over a third of the industry’s return on capital, in less than six months.
A fuel spike explains a bad year. It does not explain thirty of them. The gap between what airlines earn on capital (ROIC) and what that capital costs (WACC) is not just a 2026 problem; it is the norm. The current oil crisis will eventually pass, increasing operating margins, but the long-term economics remains dangerous. The two forces that have been able to keep the wheel turning have now moved in the wrong direction together. Capital has gotten more expensive and stayed there while, maintenance, repair and overhaul (MRO) costs have increased faster than revenue.
Industry Margin Asymmetry - Some Winners, Many Losers
To cover their cost of capital, airlines need to generate an operating margin (return on sales) of roughly 9 to 10%. With a 2026 forecast of 4.1%, the industry is operating at less than half the margin it requires. Within the industry there are clear winners and losers. The winners are taking all the profit and the losers all the losses. Looking at recent public financial data, airlines like United and Delta whose recent focus on premiumization has paid off handsomely reporting record earnings in contrast to low cost and ultra-low-cost carriers (ULCC). Southwest, JetBlue and Frontier reported losses or significant drop in profits. Most notable in the recent bankruptcy of ULCC Spirit airline possible representing the beginning of the end of for many airlines that exclusively focus on this industry subset.
Recent fuel spikes did not create the economic divide but widened one that already existed. Historically, the airline industry self-stratifies performance based on customer demand and external economic factors. This stratification has resulted in a few winners, but the total industry never outearning its cost of capital in any year of its history until 2015 and no year since. Looking across the airline industry sector (manufacturers, lessors, airports, airlines, freight forwarders, travel tech, etc.…) carriers carry the highest volatility of returns, while suppliers, protected by industrial concentration and long-term contracts, earn steadier and higher returns on the same demand.
None of this was fatal while money was cheap as structural shortfalls compound slowly over time when capital costs 3% or less, but things changed quickly. The Federal Reserve cut 175 basis points between September 2024 and December 2025, finishing at target range of 3.50% to 3.75%. The ten-year Treasury ended 2025 at roughly 4.16%. Then it reversed. Conflict in the Middle East disrupted energy and commodity markets, core inflation climbed from 3.0% in December 2025 to 3.3% by April 2026, and the Fed stopped cutting, holding its target range since. The risk of a rate hike continues to increase.
What matters most in the aviation industry is that is happening at the long end of the curve. As of July 31st, the 30-year was at 5.21%, its highest level since July 2007, and the 10-year had climbed to 4.68%. The short end of the curve came down 175 basis points and stayed down, but long rates went up.
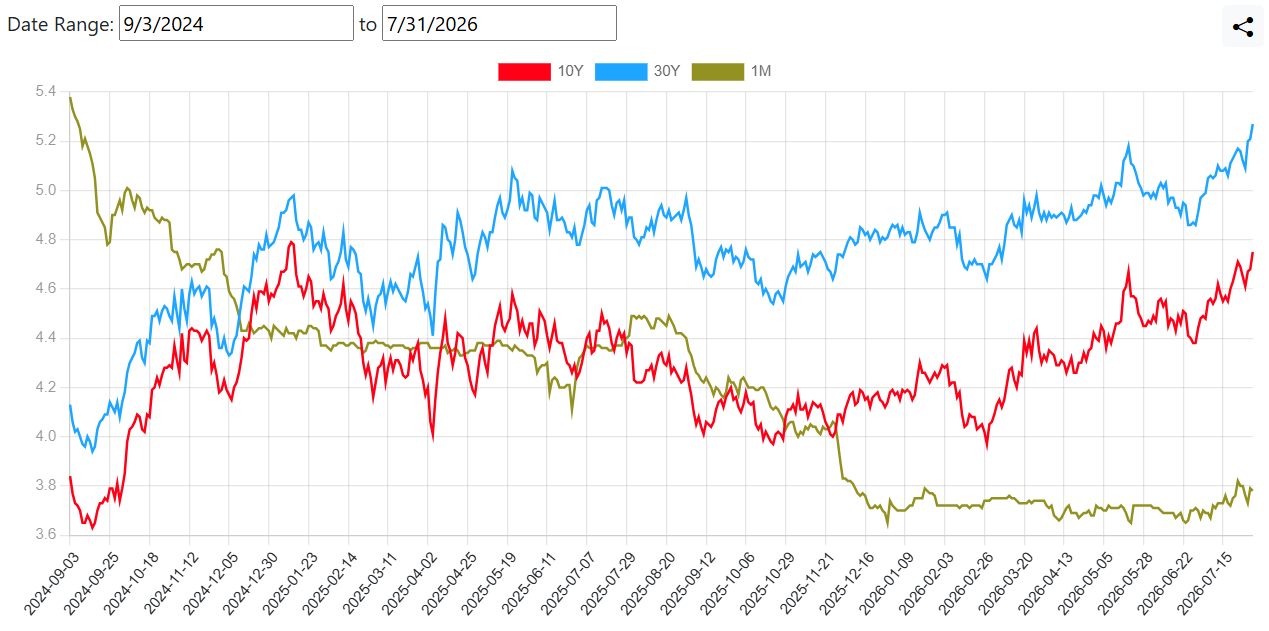
Aircraft are not financed at the short end. The easing that everyone felt in 2025 never reached the fleets that were being funded. An airline’s cost of debt is predicated off these numbers. Industry trade associations and participants vary greatly, but a reasonable assumption of 45%-50% debt to equity split, combined with a WACC of 8.5% to 9.5% means that a shift upwards in rates will have a significant negative impact on an enterprise’s profitability. Just like most companies, debt terms typically fall with 5–10-year maturities requiring consistent revolving. A 100 to 200bps swing upwards in rates over a 2-3 year term can easily result in hundreds of millions in unexpected interest expense costs.
Read: The Real Cost of Tariffs for CPG: What CFOs Need to Model Before Prices Hit the Shelf
Investing In An Uncertain Future
Current aircraft backlogs are running about 12 years. An airline signing today may not take delivery for more than a decade. It then flies the aircraft anywhere from 8-30 years. American depreciates its fleet over 30 years, Frontier uses 8 years and other airlines vary significantly between these two extremes. The variance reflects fundamentally different fleet strategies rather than different aircraft.
Assuming a mid-point of 19 years useful life, a decision made in 2026 delivers around 2036 and remains on the balance sheet into the 2055s. This is committed capital that will extend across 3-4 interest rate cycles.
The purchase price is fixed at the time of order, but almost nothing else is. The one number an airline can lock in is not the number that drives profitability.
Read: Scenario Planning for the $300B Patent Cliff: A Finance Leader’s Playbook for 2026-2030
Maintenance Cost Increase Faster Than Revenue
A recent assessment of the commercial fleet and the maintenance market forecasts global maintenance, repair and overhaul demand at $136 billion in 2025, an 8% increase over $126 billion the year before, reaching over $193 billion by 2030, roughly double the 2019 level. Three forces are driving higher MRO.
- The fleet is the oldest it has ever been. Average age reached about 13 years in 2025. Older aircraft need more frequent and more extensive work, and they need it from a supply chain that is already full.
- Parts and labor have both repriced. Continued labor shortages, material shortages, geopolitical instability and tariffs continue to put upward pressure on costs.
- New engine issues. Next-generation engine platforms are having unexpected durability issues. Fleet renewal is often underwritten on fuel efficiency, but some of that saving is being consumed by unplanned shop visits on the newer aircraft that were supposed to deliver it.
Most carriers forecast maintenance as a percentage of revenue, or per available seat mile. Revenue is growing 9.4% this year. Maintenance demand grew 8% in a single year and is on a path to double over a decade against a fleet growing 37%. Expand that over 25 years and you have an industry producing negative economic profits over generations.
The Only One Thing That Matters Is You
A study by the Montana Department of Revenue lists the Moody’s rating and corresponding yield to maturity for multiple major airlines and cost of debt dispersion is remarkable.
| Carrier | Moody’s rating | Yield to maturity | Spread over Delta |
|---|---|---|---|
| Delta Air Lines | Baa2 | 5.98% | baseline |
| United Airlines | Baa3 | 5.98% | 0 bps |
| Alaska Air Group | Ba1 | 7.39% | 141 bps |
| American Airlines | B1 | 8.47% | 249 bps |
| JetBlue Airways | Caa1 | 12.41% | 643 bps |
A 643-basis point spread separates the top borrower from the lowest. Assuming Delta and JetBlue buy the same aircraft on the identical day for a deliver cost of $55 million and finance it over 12 years, then JetBlue will have spent nearly $30 million more of which 97% of the aircraft’s price will be interest. In essence, JetBlue will pay for the plane and then will very nearly pays for a second one it will never fly.
| On a $55 million aircraft | Delta at 5.98% | JetBlue at 12.41% |
|---|---|---|
| Annual payment | $6.6 million | $9.0 million |
| Total paid over 12 years | $78.6 million | $108.6 million |
| Total interest | $23.6 million | $53.6 million |
Structured financing can narrow the above gap but not close it. For example, aircraft are typically funded with debt secured by the aircraft themselves rather than at the airline’s corporate rate. This type of financing would pull both the above table figures down and compress the distance between them, but it does not erase them. The weaker the carrier, the less of the gap the structure takes away.
Layer higher maintenance and overall operating costs that grow faster than revenue onto a model with materially less margin to absorb it and the squeeze becomes obvious.
See how Croatia Airlines transformed complex financial planning and cut planning time by 40%
Read the Croatia Airlines storyThe Runway Between the Decision and the Budget
Every number that determines whether an aircraft order creates value sits outside the 12–18-month planning cycle that approves it. The capital budgeting model assumes a set discount rate, a financing spread, a maintenance escalation curve, and a residual value assumption, each running ten to thirty years forward. That mismatch shows up as four specific failures.
- The cost of capital is modeled as a constant. It is not one. It moved at the long end while the policy rate fell, and it differs by 643 basis points between two carriers in the same industry buying the same aircraft. Most fleet models carry a single discount rate, set once, revisited annually, and frequently inherited from whoever built the model.
- Maintenance is modeled as a ratio. Percentage of revenue, or cost per available seat mile. That works while the numerator and denominator track each other. They have not tracked each other for the better part of a decade and the gap is widening.
- Capital is not allocated below the enterprise. ROIC is the metric the entire industry is judged on, but most carriers only analyze it at on a consolidated basis.
- The world changes constantly. Fuel costs change, delivery dates slip, a competitor goes bankrupt, yield curves shift. Each variable changes the economics of the original order.
The problem is not that airline finance teams don’t have enough mental horsepower. They have some of the most educated, sophisticated and complex analysts in the world. It is that most planning architecture was built to produce an annual budget, and it is being asked to underwrite a thirty-year capital commitment. Those are different jobs.
Read: When the Spreadsheet Becomes the Tax: A CPG CFO’s Guide to Choosing an FP&A Platform
What Moves To Make
Credit ratings move slowly and move on results, but the rate an airline pays on a specific aircraft is not the same number as the rate on its corporate debt, so there is room to move, and most airlines know the game and play it well.
- Finance the aircraft, not the airline. Enhanced equipment trust certificates are debt secured by specific aircraft and protected under Section 1110 of the Bankruptcy Code, which gives creditors a fixed timetable to repossess collateral in Chapter 11. That protection is why senior tranches routinely rate several notches above the airline issuing them, and why a speculative-grade carrier with modern aircraft can borrow at investment-grade spreads. These structures narrow the financing gap, bot close it because the rating still weighs default probability, liquidity and operating performance.
- Decide which risks you are actually paid to hold. A sale and leaseback converts an owned aircraft into cash plus an operating lease and moves residual value risk to the lessor. Right now, that trade is unusually favorable, because order books are full and aircraft are scarce, so a carrier holding delivery positions can often sell for more than it contracted to pay. Leasing is simply another form of financing, which means lease payments across the term generally exceed ownership, and the airline picks up renewal risk on lease rates.
- Turn maintenance volatility into a rate. Rate per flight hour agreements (also called power by the hour) can replace multimillion dollar shop visits with a fixed charge per hour flown. That converts the least forecastable line in the operating budget into known fixed amount, but it does not stop price escalation. The OEM prices the contract on its own margin assumptions, and these rates have historically climbed at low double-digit percentages annually.
- Shorten the distance between the decision and the next decision. If a delivery slips, fuel moves, or the long end backs up another 50 basis points, the case that justified an airplane order is no longer the case in front of you. A finance function that can rebuild it in days still has a decision but one that needs a quarter has a record of what it used to believe. Speed matters.
Every move above needs credit, collateral, or a counterparty willing to take the other side, and each one gets priced on how likely you look to survive. Fuel hedging is the clearest version: it is most available to the carriers that need it least, because hedges require something to post against. These instruments widen the distance between an airline and the edge. They do not carry one back from it.
The Bottom Line
Demand is not the problem. The industry will fly 5.1 billion people this year, fill 84% of its seats, and book its largest revenue in history. Almost every top line operational metric aviation has ever optimized for is at or near a record.
The problem is that this industry buys twenty-five-year assets, finances them at a cost of capital that reprices continuously and varies enormously between operators, and maintains them against a cost curve climbing faster than revenue. For most of the last two decades, capital was cheap enough that this was not a problem, but the good times ended and the long end of the yield curve does not like it is becoming cheaper anytime soon.
The carriers that emerge from this decade in good shape will not be the ones with the most accurate forecast. Nobody forecasts a regional conflict that halves industry profitability in six months. They will be the ones who can model for a 25-year, ever-changing future and effectively act on it.
That is a planning problem before it is a capital problem. Farseer builds planning software for capital-intensive organizations making long-horizon commitments, where the asset outlives the budget cycle by decades and the cost of being wrong compounds for the whole of its service life.

FAQ
Why are airline profits declining despite record passenger demand and revenue?
Airlines face rising fuel, financing, and maintenance costs that are compressing margins. Although revenue and passenger numbers are growing, the industry’s returns remain below its cost of capital.
How do rising interest rates affect airline profitability and aircraft financing?
Aircraft are long-term assets financed over many years. Higher borrowing costs increase interest expenses, while differences in airline credit ratings can create significant financing cost gaps between carriers purchasing similar aircraft.
Why are airline maintenance costs increasing faster than revenue?
Maintenance costs are rising because fleets are ageing, labour and materials are more expensive, supply chains remain constrained, and newer engines are experiencing durability issues that require additional shop visits.
Why is annual budgeting insufficient for long-term aircraft investments?
Aircraft ordered today may not be delivered for more than a decade and can remain in service for decades. A 12–18-month budget cannot adequately account for changing interest rates, fuel prices, maintenance costs, delivery schedules, and residual values over that period.
How can airlines improve financial planning for long-term capital decisions?
Airlines need adaptable planning models that can quickly update financing rates, maintenance assumptions, fuel costs, delivery dates, and other variables. This allows finance teams to reassess investment decisions as conditions change.

Digital Transformation in Finance: How Finance Teams Break Out Of Digital Planning Purgatory With AI
Read more
Farseer raises $7.2M Series A to build the Enterprise Operating System for Finance
Read more