When the Spreadsheet Becomes the Tax: A CPG CFO’s Guide to Choosing an FP&A Platform

Organizational complexity can drain up to 7% of a company’s annual revenue. Intuitively, many think that volume is the biggest driver of increased cost, when it is complexity. Complexity comes in many forms, with software often the biggest driver. It is estimated that for every $5 spent on software, $1 of it is lost to complexity. That complexity comes from a variety of sources, including poor implementation, underutilized tools, legacy and siloed systems, and the greatest culprit: poor processes. Complexity is what drives employees to focus on reconciling numbers instead of providing insight to drive action and create value. For a CPG finance team, most of that complexity is visible through the lens of the planning function.
The question is not whether your CPG business is complex; it is, it is whether your complexity has crossed the line where legacy spreadsheets, disparate systems, siloed data, and antiquated interfaces have become so taxing that a new system (and a new way of doing things) will pay for itself.
“Complexity” Is Not a Feeling.
Researchers studying organizational complexity identify five dimensions that drive it. For CPG Finance teams, complexity manifests through various layers.
- Product and SKU depth. CPG companies typically manage a broad range of SKUs alongside complex sales, distribution, and promotional agreements, and each additional item multiplies the complexity.
- Channel spread. Pure direct-to-consumer is simple. Retail + club +distributor + grocery is not. Each channel has its own velocity, replenishment rate, compliance rules, and delivery windows. A single blended forecast can hide the difference.
- Trade-promotion machinery. Trade spend is often the second-largest line after cost of goods on a CPG company’s P&L and frequently the single greatest P&L lever.
- Organizational layers. The more layers, entities, countries, states/provinces, the more complex the requirements. Multi-entity, multi-currency, multi-geography consolidation done in Excel can make even the most advanced financial model groan.
- Data quality. Data is a catalyst that multiplies the other four. The gap between what your systems show and what is actually moving through various channels is where margin leaks hide.
Most teams measure complexity by SKU, but layers two through five are what actually break a spreadsheet. For example, a 50-SKU brand, sold through four channels each with different trade promotions within 6 countries that each have an average of 15 territories with data aggregated via five unconsolidated reporting systems, is much more complex than a 300-SKU brand selling one product line through one channel out of one entity in one country with one system.
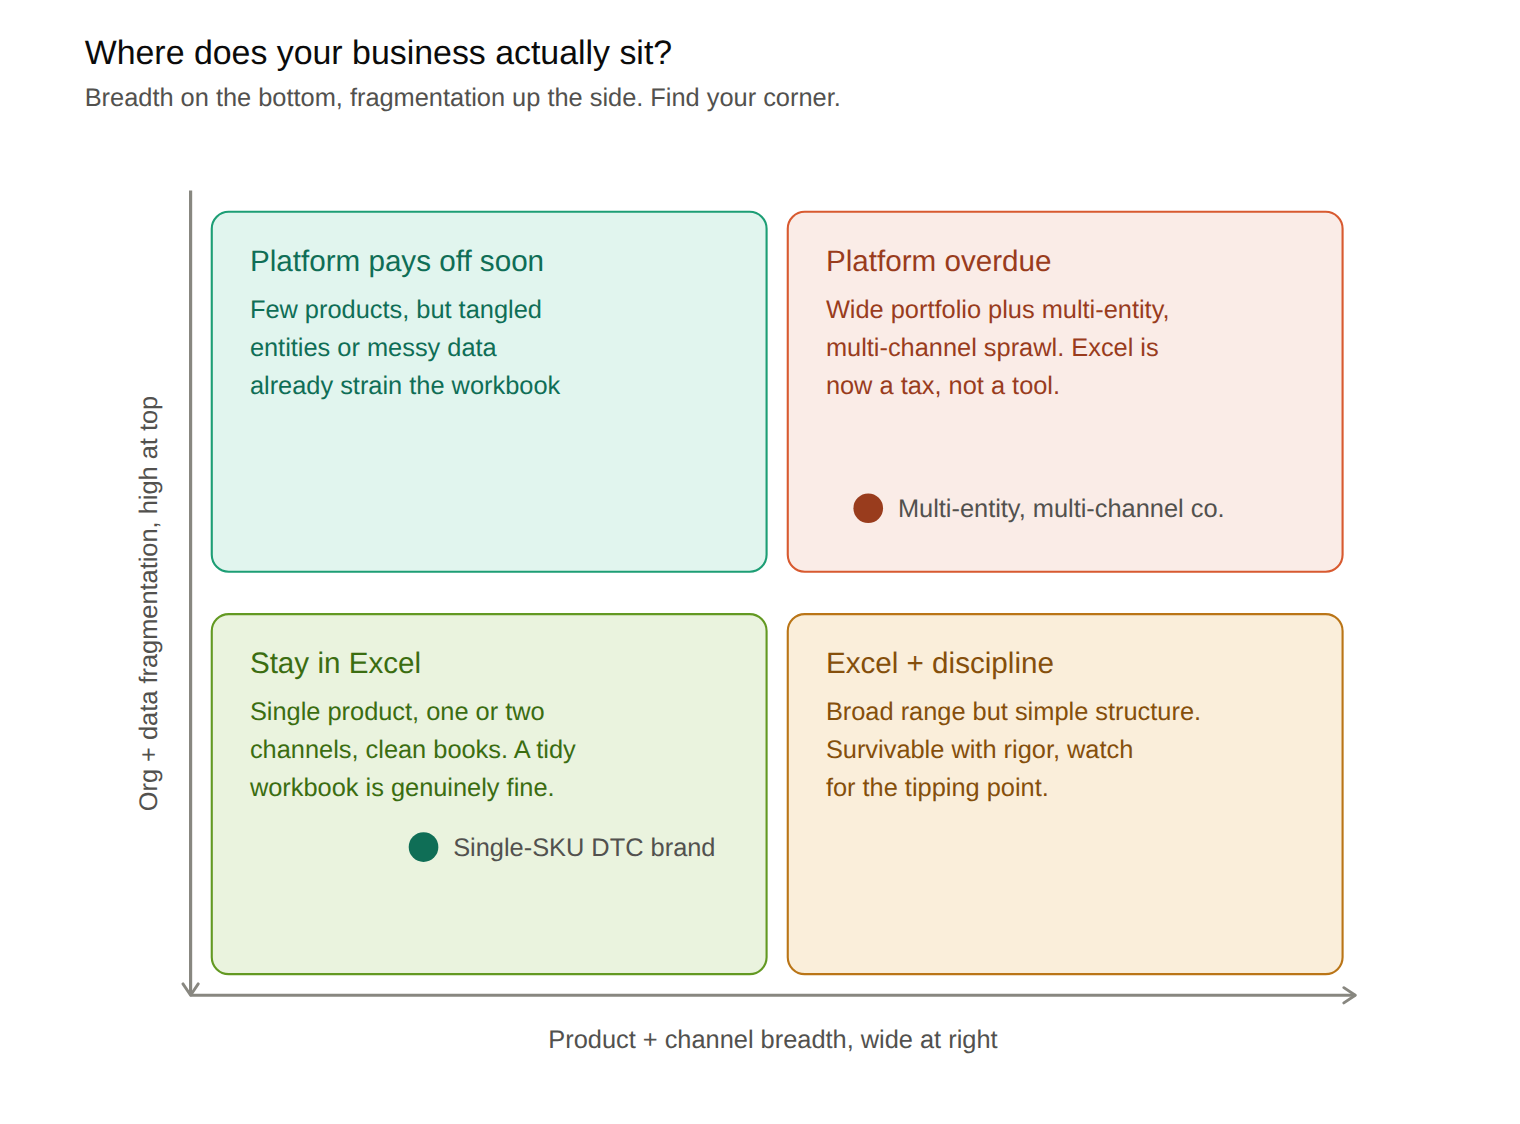
Plot your organization in the matrix above. Breadth of products and channels runs along the bottom; organizational and data fragmentation runs up the side. A single SKU direct-to-consumer brand sits comfortably in the bottom-left, where an Excel workbook is genuinely enough.
A multi-entity, multi-channel company sits in the top right, this is where Excel has quietly become a tax rather than a tool. The two boxes in between are where most companies actually operate.
Read: Demand Forecasting Software: 7 Tools Compared for 2026
The Complexity Tax
Complexity is not just annoying. It carries a documented price:
“Drawing on 10-K disclosures to apply a broad measure of firm complexity for a large sample of U.S. publicly listed companies, we document that greater complexity is associated with less efficient investment, manifested in both underinvestment and overinvestment.”
It also produces less accurate management forecasts of earnings and capital spending by degrading the internal information environment. When the data environment is fragmented, the forecast gets worse. The cost of complexity also shows up in firm valuation. Markets discount what they cannot see clearly. Transparency is not a virtue. It is equity value.
CPG business complexity continues to increase amid higher inflation, changing tariffs, increased regulation, and rising capital costs. Instead of simplifying, AI will only accelerate change as consumer demand and mass customization increase. CPG Finance teams continue to be asked to do more with less, or at best the same.
When Excel Is Fine, Until Its Not
This is something you won’t often read on a software company’s website very often – A single-product, one-to-two-channel direct-to-consumer brand with a clean chart of accounts does not need an FP&A platform. It needs a disciplined process that consistently and frequently updates a master three-statement Excel workbook model using source systems and cleansed data, allowing rapid iteration to provide “what-if” scenarios to senior management.
The goal is never to abandon Excel for its own sake, but to identify specific workflows that have outgrown it and replace them surgically, while leaving the rest alone. A spreadsheet will remain the ultimate tool for ad hoc analysis for many more generations, but when faced with frequent, high-risk, multi-party budget cycles that impact firm valuation, a more robust tool should be considered.
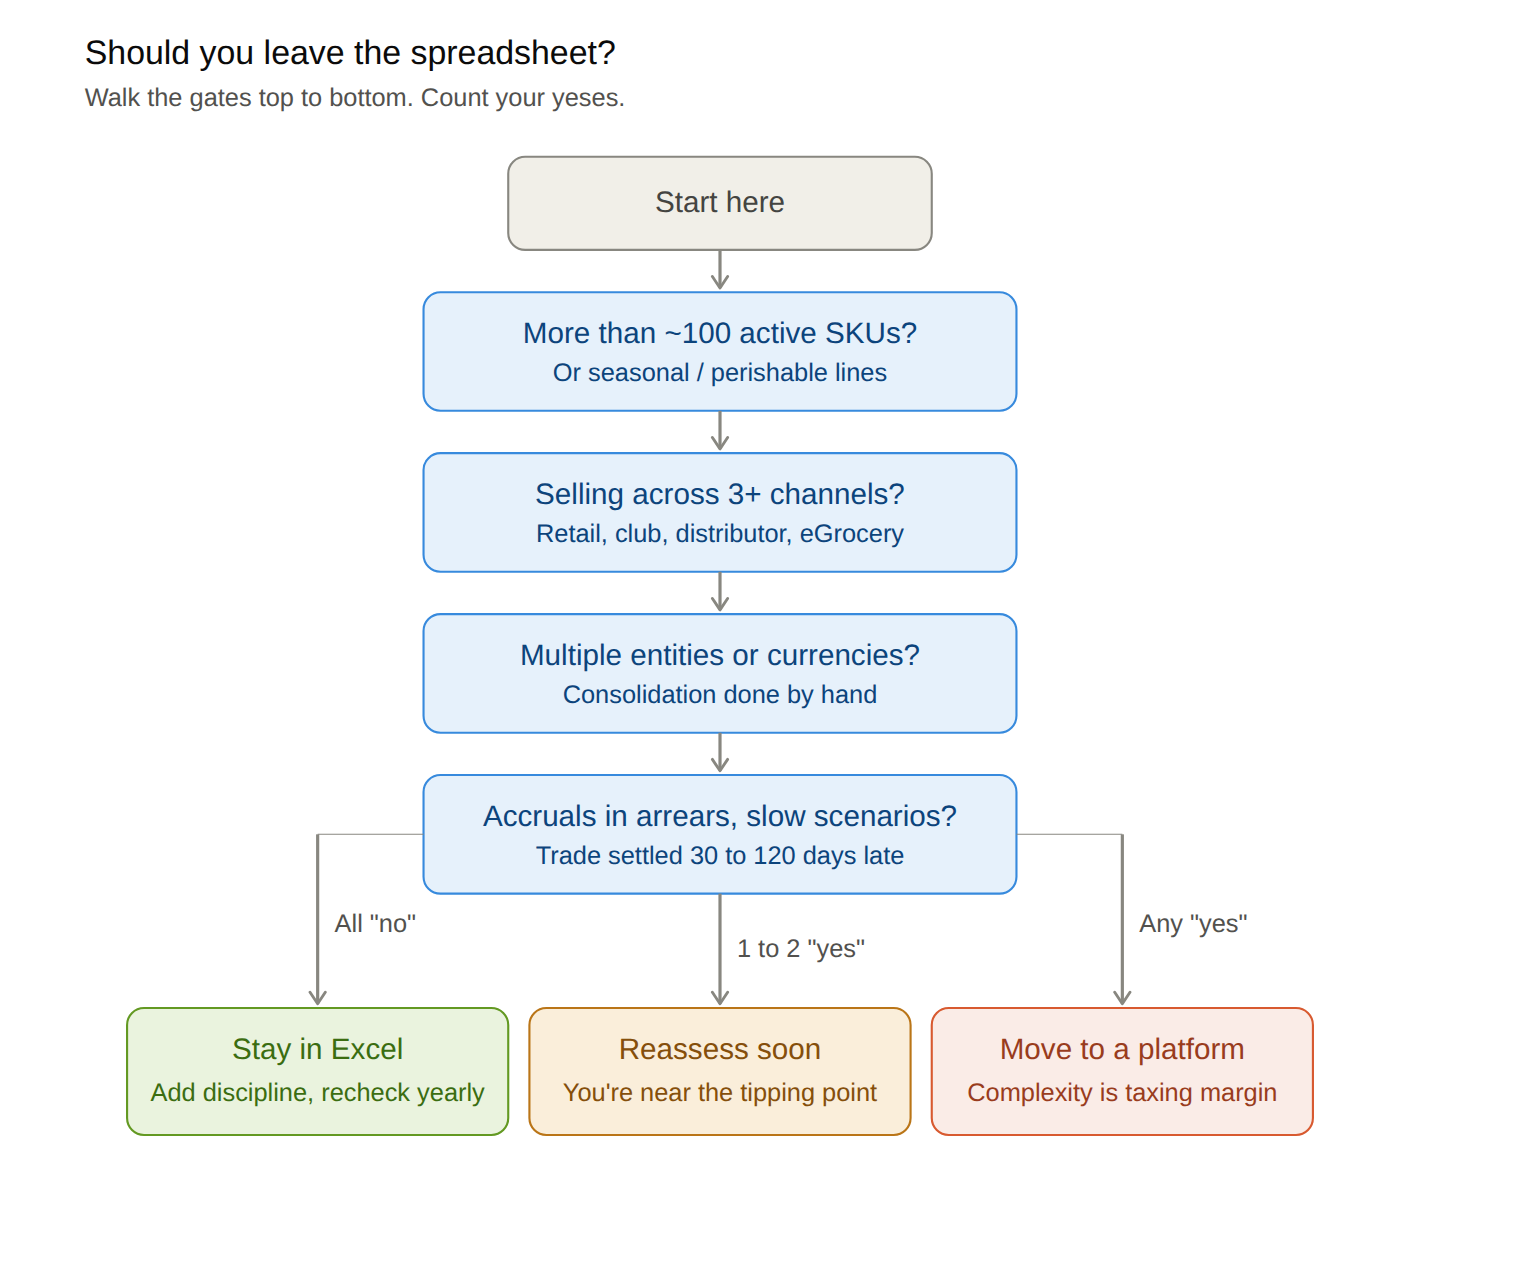
Four signals tell you if your Excel-based, disciplined process has (or will soon be) crossing the line.
- Version chaos. If your planning files have names like Budget_FINAL_v24, and nobody is fully sure which one is live, your master Excel workbook is no longer a single source of truth and is of high operational risk due to potential broken links, data entry errors, and formula discrepancies. Trust me, they are there no matter how good you think it is.
- Slow scenarios. If running a single alternative view takes days, then you only have time to run one scenario instead of three. The value of one more scenario, one more iteration, one more change is both invaluable and worthless, but you won’t know which if you can’t run them.
- Trade spend in arrears. If Accounting for trade spend is based on planned activity and only reconciled against actuals 30 to 120 days later, the books are always being closed on estimates. In a single-channel, 50-SKU company, management can still make changes quickly based on channel reporting, but as the need for portfolio optimization grows and trade spend becomes a larger line item on the P&L, the need for more accurate actual-to-budget variances at a granular level becomes imperative.
- Manual consolidation. The first acquisition was easy; the new entity sent the finance team a CSV file mapped to the parent company’s chart of accounts, and you have a financial analyst map SKU and channel data in an offline spreadsheet to provide visibility to senior management. When you start having to use offline spreadsheets to consolidate multiple source systems files from different entities/divisions/units to provide the transparency of the (Price x Volume x Mix) equation tied to total revenue, you might have a problem.
The pivot point is money. Leakage can be calculated in various ways. Avoiding underperforming promotions and reallocating that spend to better ones can put as much as 1% to 2% of revenue straight on the bottom line. A spreadsheet error that did not happen could save millions; a faster accounting close and more rapid scenario iteration could identify business risks and opportunities sooner, allowing the company to capture new value. The total value to justify the increased software expense will be derived from both soft and hard costs, based on your unique business structure.
Garbage In, Garbage Out: No System Can Outrun Bad Data
A platform fed dirty data does not fix anything. It produces confident wrong answers, faster. Data quality, reconciliation, and organizational trust remain the core concerns, and AI only magnifies their importance rather than dissolving them.
Six dimensions determine whether your data is FP&A platform-ready, per the framework used by the UK government, IBM, and many other companies. Most, if not all, can be fixed without hiring external resources.
- Is it complete? Are all SKUs, customers, and trade events populated? Are there any blank or N/A fields? If not, you can often fix this yourself through better data governance.
- Is it consistent? Does ‘Walmart’ equal ‘Wal-Mart Inc’ equal ‘WMT’ everywhere it appears? This may require mapping to a canonical naming table.
- Is it timely? How old is the data? Will it be fresh during key planning times, or will it be weeks old? May require your IT or an outside consultant to create live ERP / portal feeds into a single source of truth.
- Is it accurate? Do accruals and estimates match what was actually settled? A process of consistent reconciliation with primary sources, along with variance tracking to ensure estimates remain within tolerance, should be established.
- Is it unique? Are there duplicate SKUs, legacy items that are no longer valid, or double-counted accounts? An active policy and process of deduping and retiring should be implemented.
- Is it valid? Does the data conform to the format, type, or range of its definition? A promo’s end date should not be before its start date. Do all account numbers have a certain length? May require a data validation error log and correction before uploading.
Arguably, the heaviest initial and ongoing lift of any new FP&A system is not the data analysis once the platform is up and running, but the data maintenance to keep it relevant and credible. This is the unglamorous data plumbing that takes up more time than anyone would like but is necessary to ensure optimal results.
Read: Record Revenue. Record Load Factors. But Negative Returns
What a Platform Does That Excel Structurally Cannot
Absent the above, the rest is structural. Think of it as how you like your spaghetti. You can spend $50 a plate at a fancy restaurant with all the bells and whistles or $2 at home, make it yourself, and eat it in front of the TV. The quality and experience matter just as much as the dish.
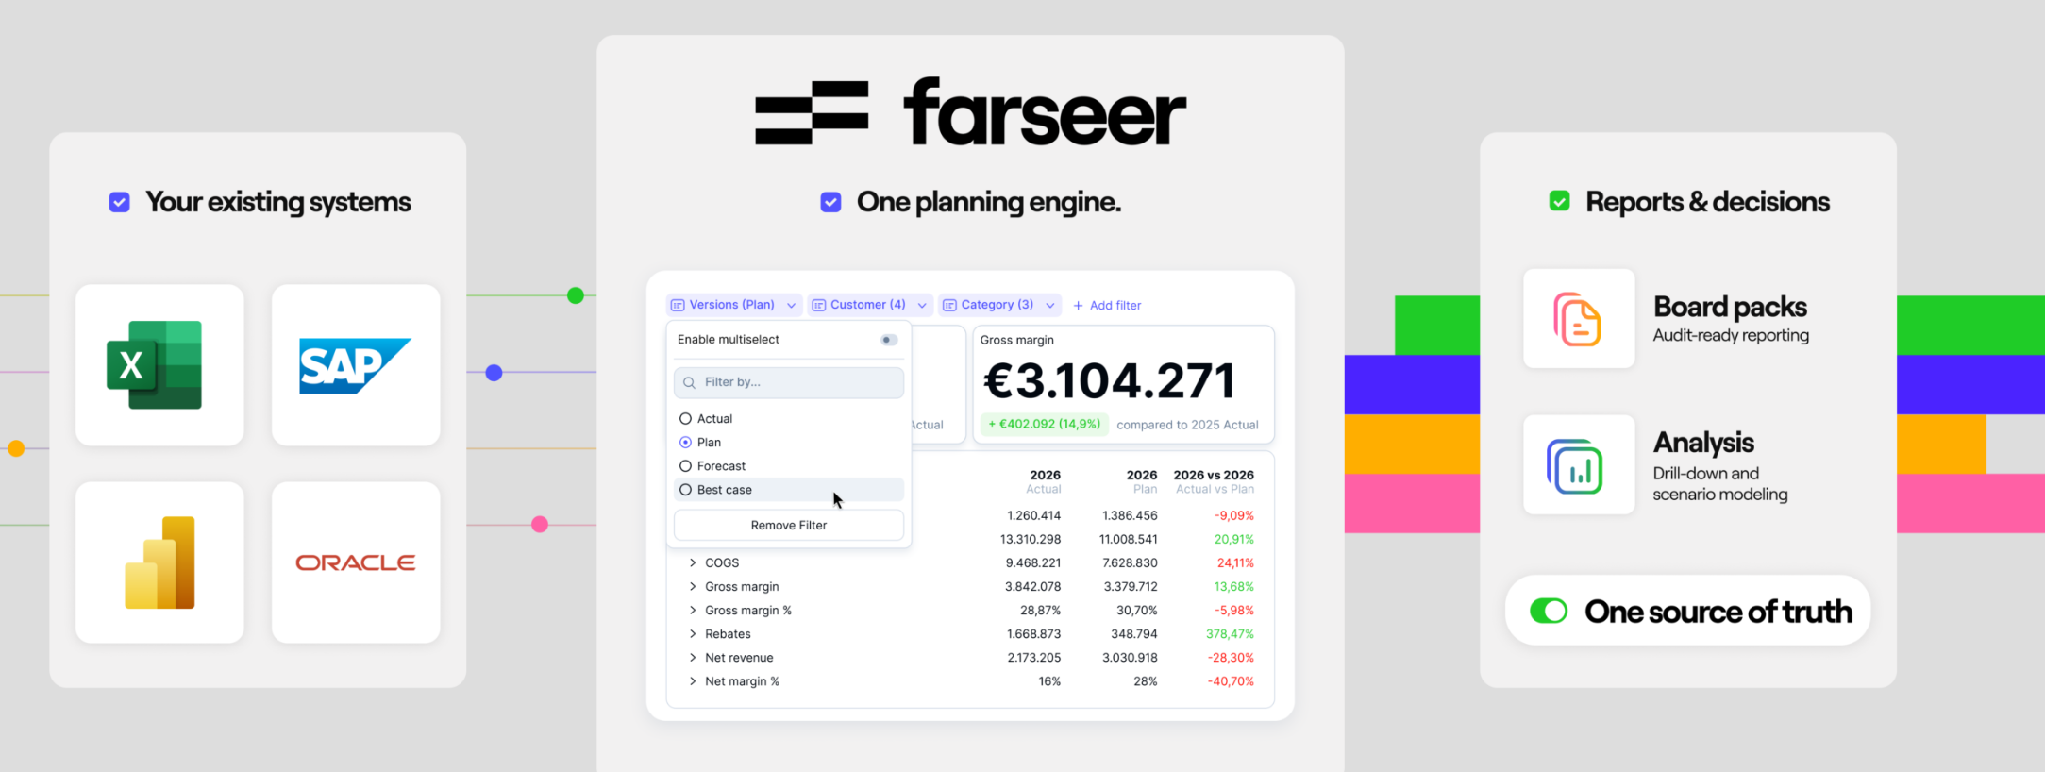
Farseer keeps the familiar spreadsheet interface but runs it on an in-memory database, eliminating data fragmentation at the structural level rather than leaving finance to manage it manually. Change logging provides an audit trail and transparency, ensuring accurate forecasting. Role-based access lets business-unit owners write back to the same source rather than emailing versions around. It is strongly recommended that an in-house data maintenance strategy and enforced policy be developed and deployed before searching for a solution.
The FP&A Tooling Ladder: Five Levels Explained
It has been well documented in various academic and trade journals that upwards of 86% of Excel models have both overt and hidden errors. Every tool category above raw Excel exists because somebody’s workbook produced a confident wrong answer at a bad moment.
Level 1 Spreadsheets alone. Its variable cost is almost nothing, it’s ubiquitous, and it will model anything anyone can think of. The trade-offs for the incredible flexibility are ever increasing operational risk caused by known and unknow errors, growing version chaos, connected data sources (it can be done, but not very easily) and key-person risk because the workbook is exactly as durable as the last analyst who touched it. For many companies, this is the solution of choice and rightfully so. Excel, GoogleSheets, RowZero, Equals, quadratic are spreadsheet options.
Level 2: Excel plus bolt-ons. The real power of Excel and the Microsoft platform are unleashed with Power Query, macros, connectors and add-ins. This automates the data pulls and refreshes the reports and buys back real hours. It cannot move the logic out of one analyst’s head or leave an audit trail, and the silent errors exponentially increase with model complexity and functionality. Tools include Claude, EBITDAI, ChatGPT, Copilot. From there you have FP&A tools built for Excel Vena, XPNA, Datarails, Aleph.
Level 3: BI and dashboard tools. Leveling up the presentation of data with modest increases with the creation of cloud-based data models. BI resolves a lot of concerns around visibility. It allows drilldowns, live charts and a user-friendly interface. Dashboards look nice, but report actuals or a plan, they do not help the CPG Finance team create one. If the question is what happened, teams at this level of sophistication can answer fast, but BI tools fall down when dynamic, real-time scenario iteration and decision support analysis is required. Tools that are trying to break the historical view model and incorporate planning include Acertys, PowerON, K4 Analytics, Lumel/Fabric Planning, Fiplana, Aimplan.
Level 4: Enterprise EPM suites. EPMs are built for close optimization, consolidation, controls, and governance. For the companies they were built for, they are worth it. The tradeoff is everything about them: price, timeline, and IT staffing, is sized for those companies, and deployments run in years and quarters, not weeks. In addition, be careful of who owns and where your data is. Due to the large switching costs, it is not uncommon for these players to extort large annual increases, knowing they can charge just shy of these costs without adding any real value. Oracle, SAP, OneStream, Prophix, Workday, Lucanet.
Level 5: The purpose-built FP&A platform. This is where you will find Farseer. The difference is structural. Farseer keeps the spreadsheet-like interface every analyst already knows, but runs it on an in-memory database, so the data fragmentation that forces finance teams to reconcile numbers by hand is eliminated at the foundation rather than managed after the fact. Multi-entity, multi-currency consolidation is native, turning the offline mapping exercise described earlier into a same-day reforecast.
Where this matters most for CPG teams is trade spend. Promotion ROI is visible mid-flight rather than surfacing 30 to 120 days later once the books close on estimates, which is precisely the window where the 1% to 2% of revenue leakage hides. Reallocating spend away from underperforming promotions becomes a live decision.
The rest follows from the architecture. Change logging provides a full audit trail, so the logic no longer lives in one analyst’s head and the key-person risk of Level 1 disappears. Role-based access lets business-unit owners write back to the same source of truth rather than emailing versions around. Familiar with files like “Budget_FINAL_v24”? This is something to forget about with Farseer,
Scenario iteration that once took days runs in real time, so teams can afford to run three scenarios instead of settling for one. And unlike the enterprise EPM suites in Level 4, you’re live in weeks instead of years. You won’t need IT to babysit it, and you’re not locked in the way those suites trap you into paying more every year.
AI is where this architecture earns its keep. Earlier in this ebook we warned that a platform fed dirty data produces confident wrong answers, faster. Generic AI copilots bolted onto spreadsheets do exactly that, because they guess at logic they cannot verify. Farseer’s AI runs against the same governed in-memory model, so its outputs are grounded in the actual calculation engine rather than a language model’s approximation of it. That is what lets AI accelerate a reforecast without quietly introducing the silent errors that already plague 86% of Excel models.
One honest note: garbage in, garbage out still applies. AI does not repeal that law, it enforces it more strictly, since a model reasoning over bad data fails more confidently than a human would. Farseer amplifies clean data. It does not forgive dirty data, which is why the data-quality groundwork described above comes first, always.
Other platforms in this category include Drivetrain, Abacum, Una AI, Anaplan, and Pigment.
Bottom Line
Complexity is a choice to grow slower than you should. Below a certain threshold, you can see your business clearly enough to defend its margin inside an Excel workbook, and you should. Above it, the spreadsheet stops being a tool and becomes the tax, skimming forecast accuracy, trade dollars, and finance hours quarter after quarter.
This is the environment Farseer was built for. It keeps the spreadsheet interface your analysts already know, runs it on infrastructure that eliminates fragmentation rather than managing it by hand, and turns a multi-entity reforecast into a same-day exercise. The decision is not really about software. It is about whether you can see your own business clearly enough to act before the quarter closes rather than after. The complexity is not going away. The only question is whether you keep paying the tax by hand.

FAQ
How do I know if my company has outgrown Excel for FP&A?
If your team struggles with version control, manual consolidations, slow scenario planning, delayed trade spend reconciliation, or managing multiple entities and channels, you’ve likely reached the point where Excel is creating more cost than value. The blog suggests that if you identify three or more of these warning signs, it’s time to evaluate a dedicated FP&A platform.
What is the "complexity tax," and why does it matter for CPG finance teams?
Complexity tax refers to the hidden cost of managing fragmented data, disconnected systems, manual processes, and growing organizational complexity. Rather than simply increasing workload, complexity reduces forecast accuracy, slows decision-making, creates operational risk, and can even impact company valuation by limiting financial transparency.
Can AI solve FP&A challenges if my data isn't clean?
No. AI can only be as effective as the data it analyzes. Poor-quality, inconsistent, incomplete, or outdated data leads AI to generate inaccurate recommendations faster. Before implementing AI or an FP&A platform, organizations should establish strong data governance and ensure data is complete, accurate, consistent, timely, unique, and valid.
What advantages does a purpose-built FP&A platform offer over Excel?
A modern FP&A platform eliminates manual data consolidation, supports multi-entity and multi-currency planning, enables real-time scenario analysis, provides audit trails, improves collaboration through role-based access, and allows finance teams to monitor trade spend and forecast performance continuously instead of waiting until month-end. It complements Excel rather than replacing analytical flexibility.
Should every company replace Excel with an FP&A platform?
No. The blog explicitly states that many businesses—especially smaller organizations with simple operations, limited product lines, and clean financial structures—can continue using Excel effectively. The decision should depend on business complexity, not company size. The goal is to replace only the workflows that have outgrown spreadsheets while keeping Excel where it remains the best tool.