What’s Holding Back Financial Planning in FMCG

Consider a beverage company preparing for summer in a tourist destination. It targets 10% revenue growth by selling 6% more cases at a 4% higher net price. However, by summer’s end, revenue rises only 2.5%, and despite higher sales volume, profit declines.
The warning signs were already there in May. Hotel bookings fell short of expectations, and demand was weaker than planned. Sales volume still grew, but only by 1%. Increased competition led to additional retailer discounts and rebates, bringing net price growth down to 1.5%, while rising costs put further pressure on margins. Management only understood the combined impact after the quarter closed.
This challenge is common in FMCG. Many Finance teams base plans on last year’s sales, an expected growth rate, and a planned price increase. However, demand shifts with seasonality, weather, stock availability, and retailer activity. Discounts and rebates affect net prices, while costs fluctuate independently. Managing these drivers across separate tools and teams makes it difficult to keep financial plans aligned with reality.
In this article, we’ll look at how disconnected volume, pricing, and cost assumptions affect financial planning, and what changes when they’re managed together.
3 Reasons FMCG Financial Planning Fails (and How to Fix It)
When a Growth Rate Becomes the Volume Forecast
Many FMCG Finance teams still forecast sales volumes by applying a growth rate to last year’s figures. It’s a familiar approach and relatively easy to manage inside spreadsheets. But historical sales already contain one-off orders, promotions, stockouts, and distribution changes. Applying a flat growth rate can carry those distortions into the next planning cycle, while overlooking changes in seasonal demand.
Take our beverage manufacturer. Its plan assumes 6% volume growth, largely based on last year’s sales. But summer demand depends on a number of factors, including tourist arrivals, weather, and retailer activity. By May, hotel bookings are already below expectations. The company has an early indication that its summer sales forecast may be too optimistic, yet that information isn’t reflected in the financial plan because the teams work with different tools.
Farseer enables teams to incorporate these demand drivers into the same financial model used for revenue and profitability planning. Teams can plan volumes by product, customer, and channel, and model commercial assumptions such as promotions and distribution changes separately when data is available.
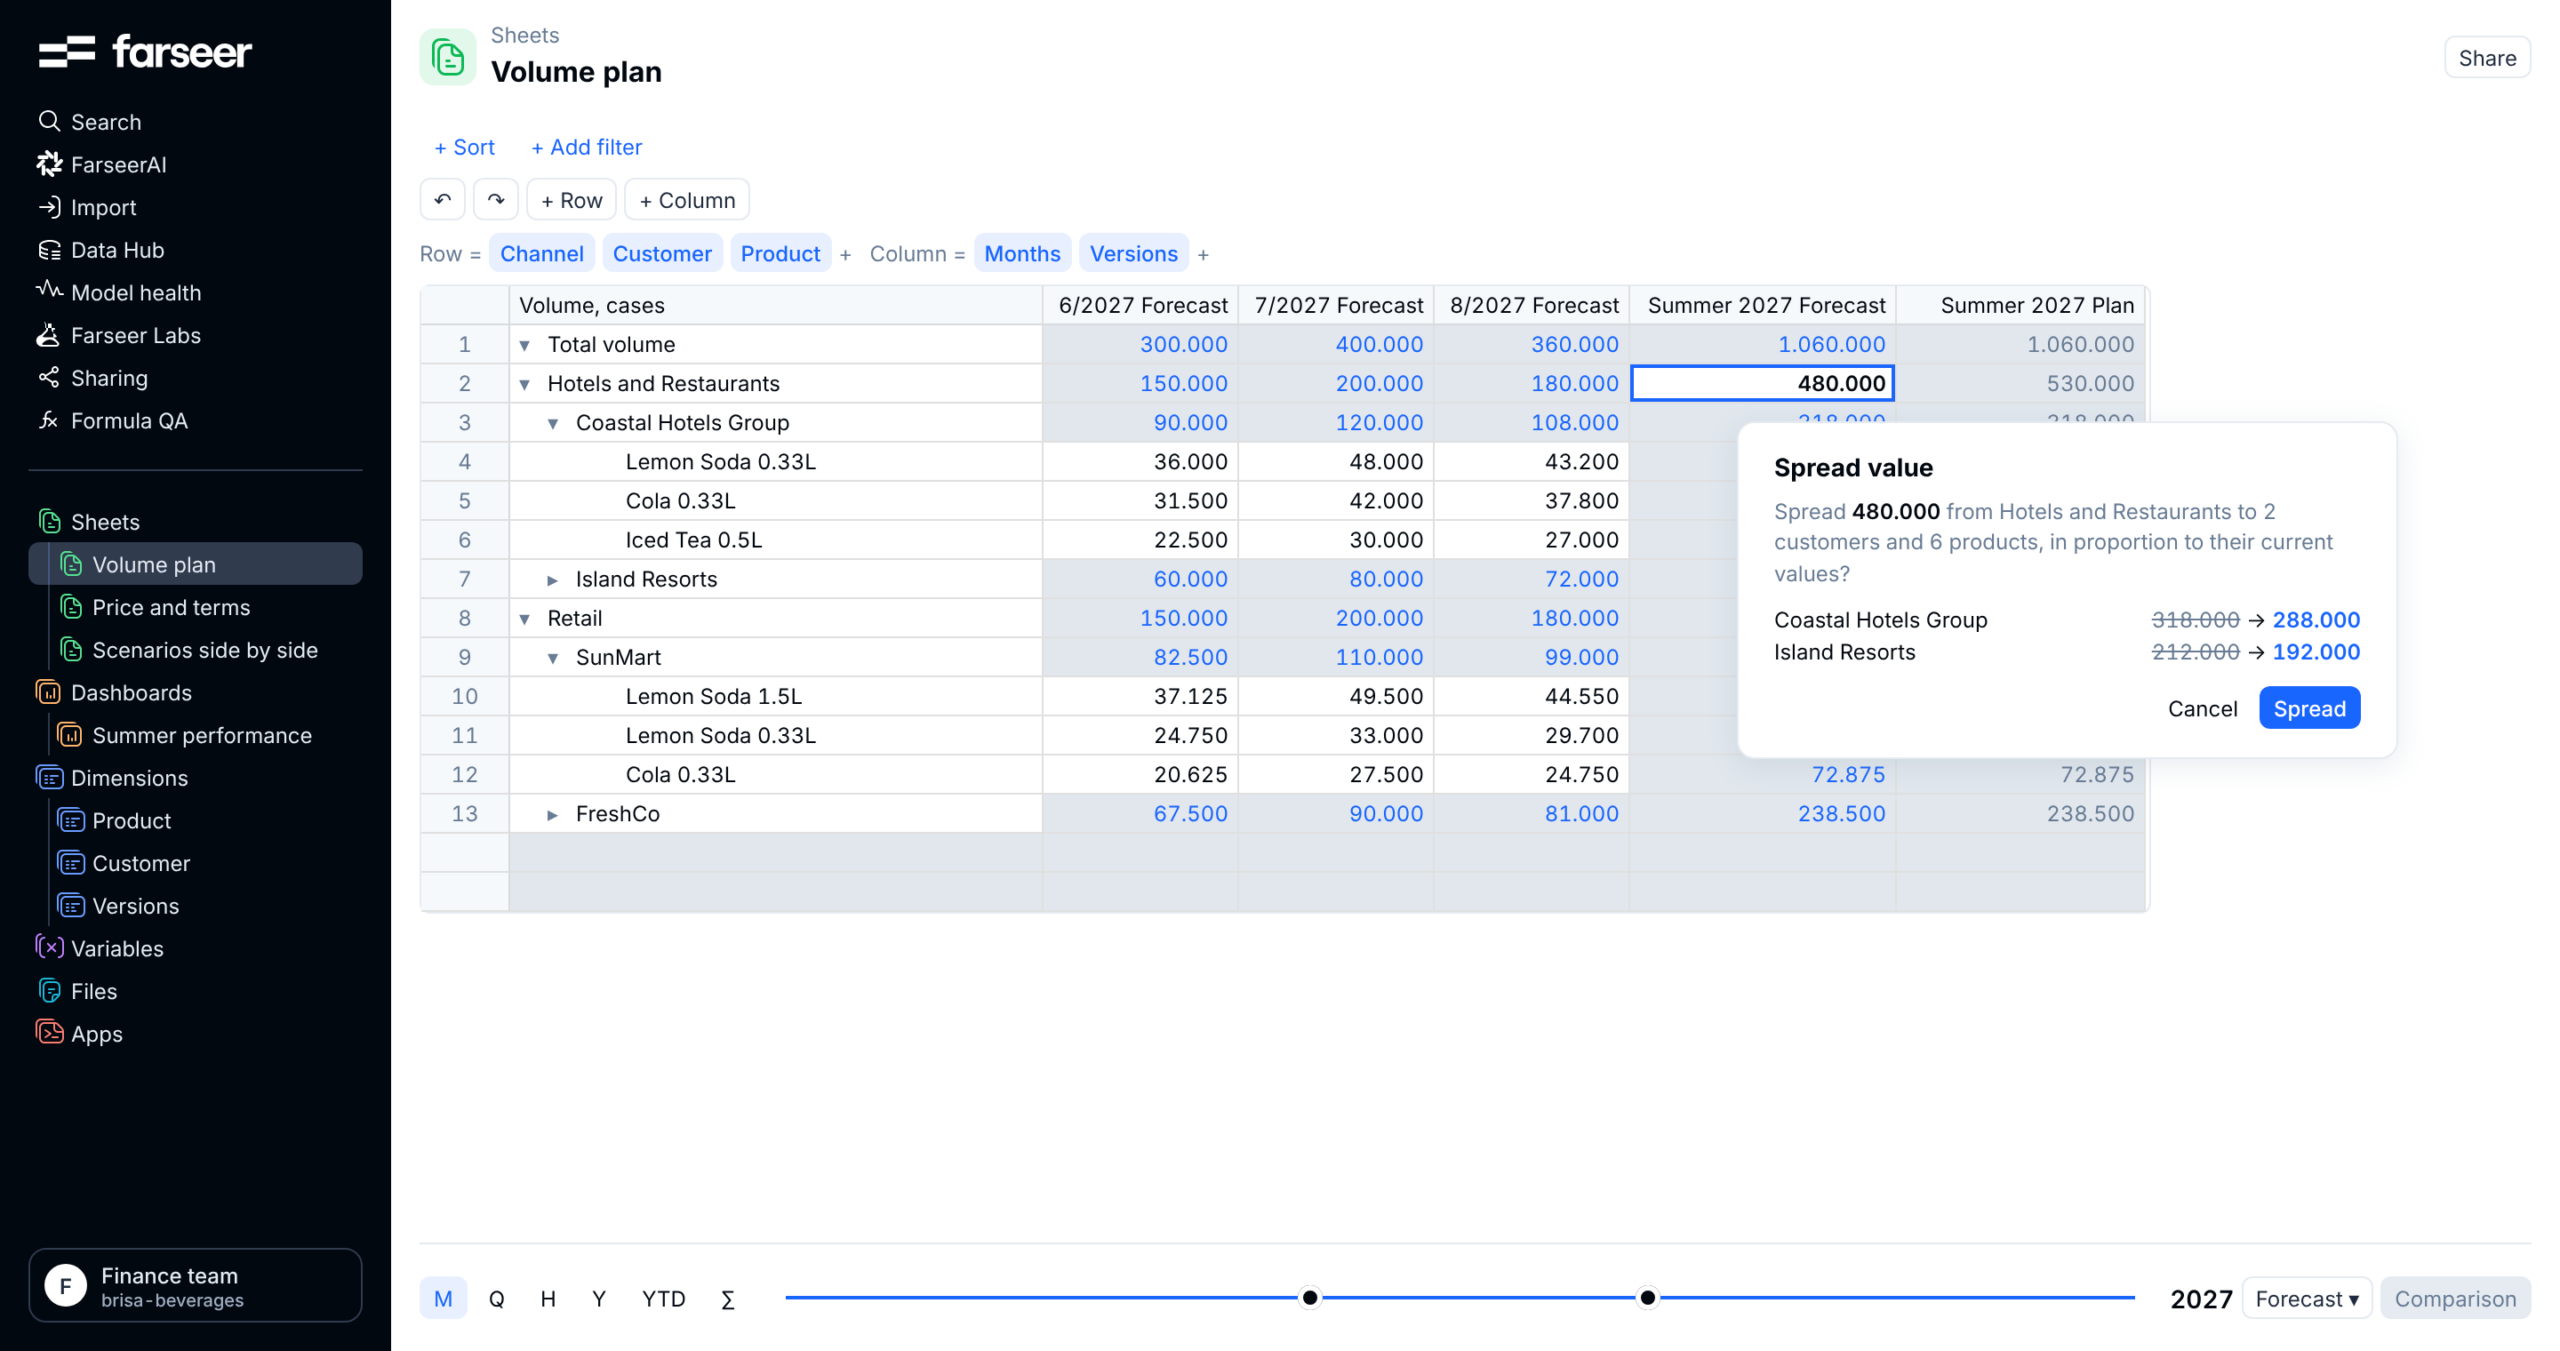
Farseer also supports statistical forecasting based on historical sales, trends, and seasonality. Teams can compare this baseline with the approved commercial plan and actual performance by month or category, making differences easier to identify and investigate.
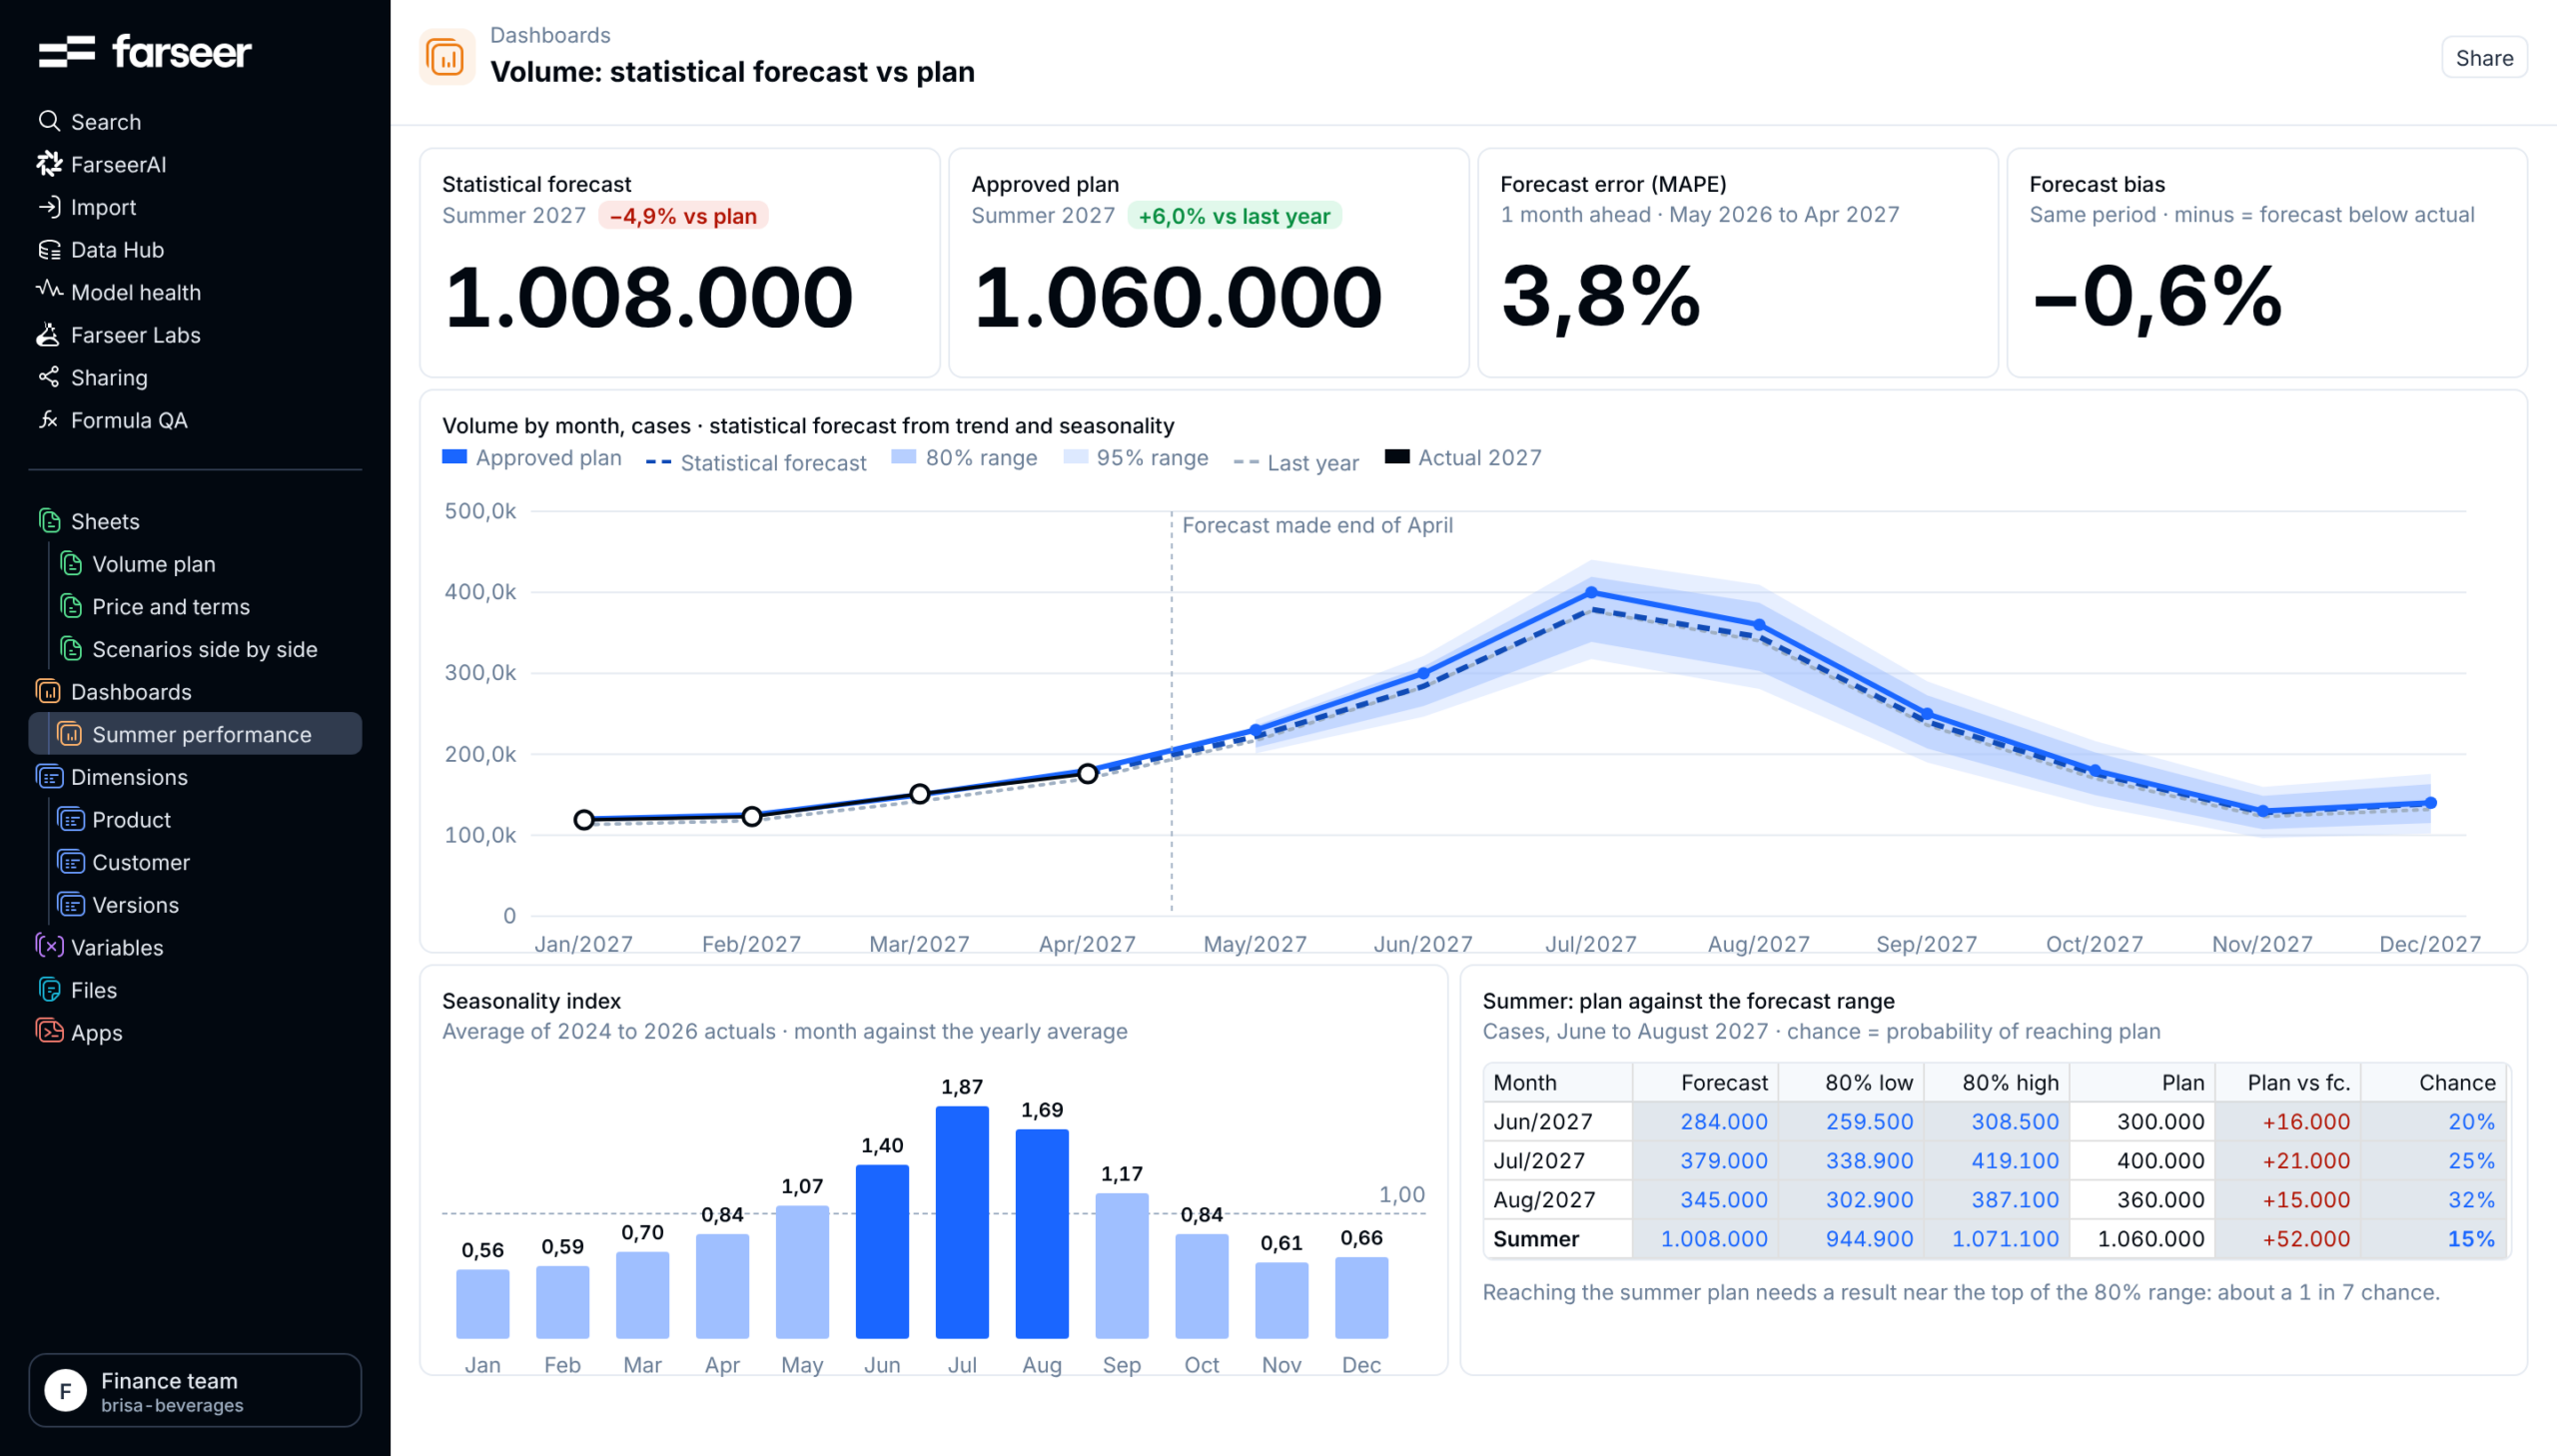
Still – the statistical baseline doesn’t replace commercial judgment. It gives Finance another reference point to challenge volume assumptions and understand their impact on revenue and profitability.
For our beverage manufacturer, this means Finance can see where the planned summer peak differs from the statistical baseline and incorporate weaker tourism expectations into an adjusted forecast. Rather than waiting until the end of the season to explain why volume grew by only 1% instead of the planned 6%, the team can assess the financial impact as new information becomes available.
The Difference Between Planned Price and Net Price
Pricing creates a similar problem. Finance may build revenue forecasts around an expected price increase, while Sales and key account teams negotiate discounts, rebates, and commercial terms with individual retailers. When these contracts are managed in separate files, the financial plan may still reflect prices the business is unlikely to achieve.
Take our beverage manufacturer. It expects net selling prices to increase by 4%. But with summer demand looking weaker and competition intensifying, commercial teams offer additional discounts and rebates to protect sales volumes. These concessions eventually bring net price growth down to just 1.5%. Yet Finance may still be working using the original 4% assumption because the updated customer agreements haven’t reached the financial model.
Farseer brings list prices, customer-specific discounts, rebates and sales volumes into the same financial model. When commercial terms change, Finance can update the assumptions and see how they affect expected net revenue at the revised sales volumes. Planned and actual prices can be compared by product, customer and channel, making it easier to identify where the expected price increase is being lost.
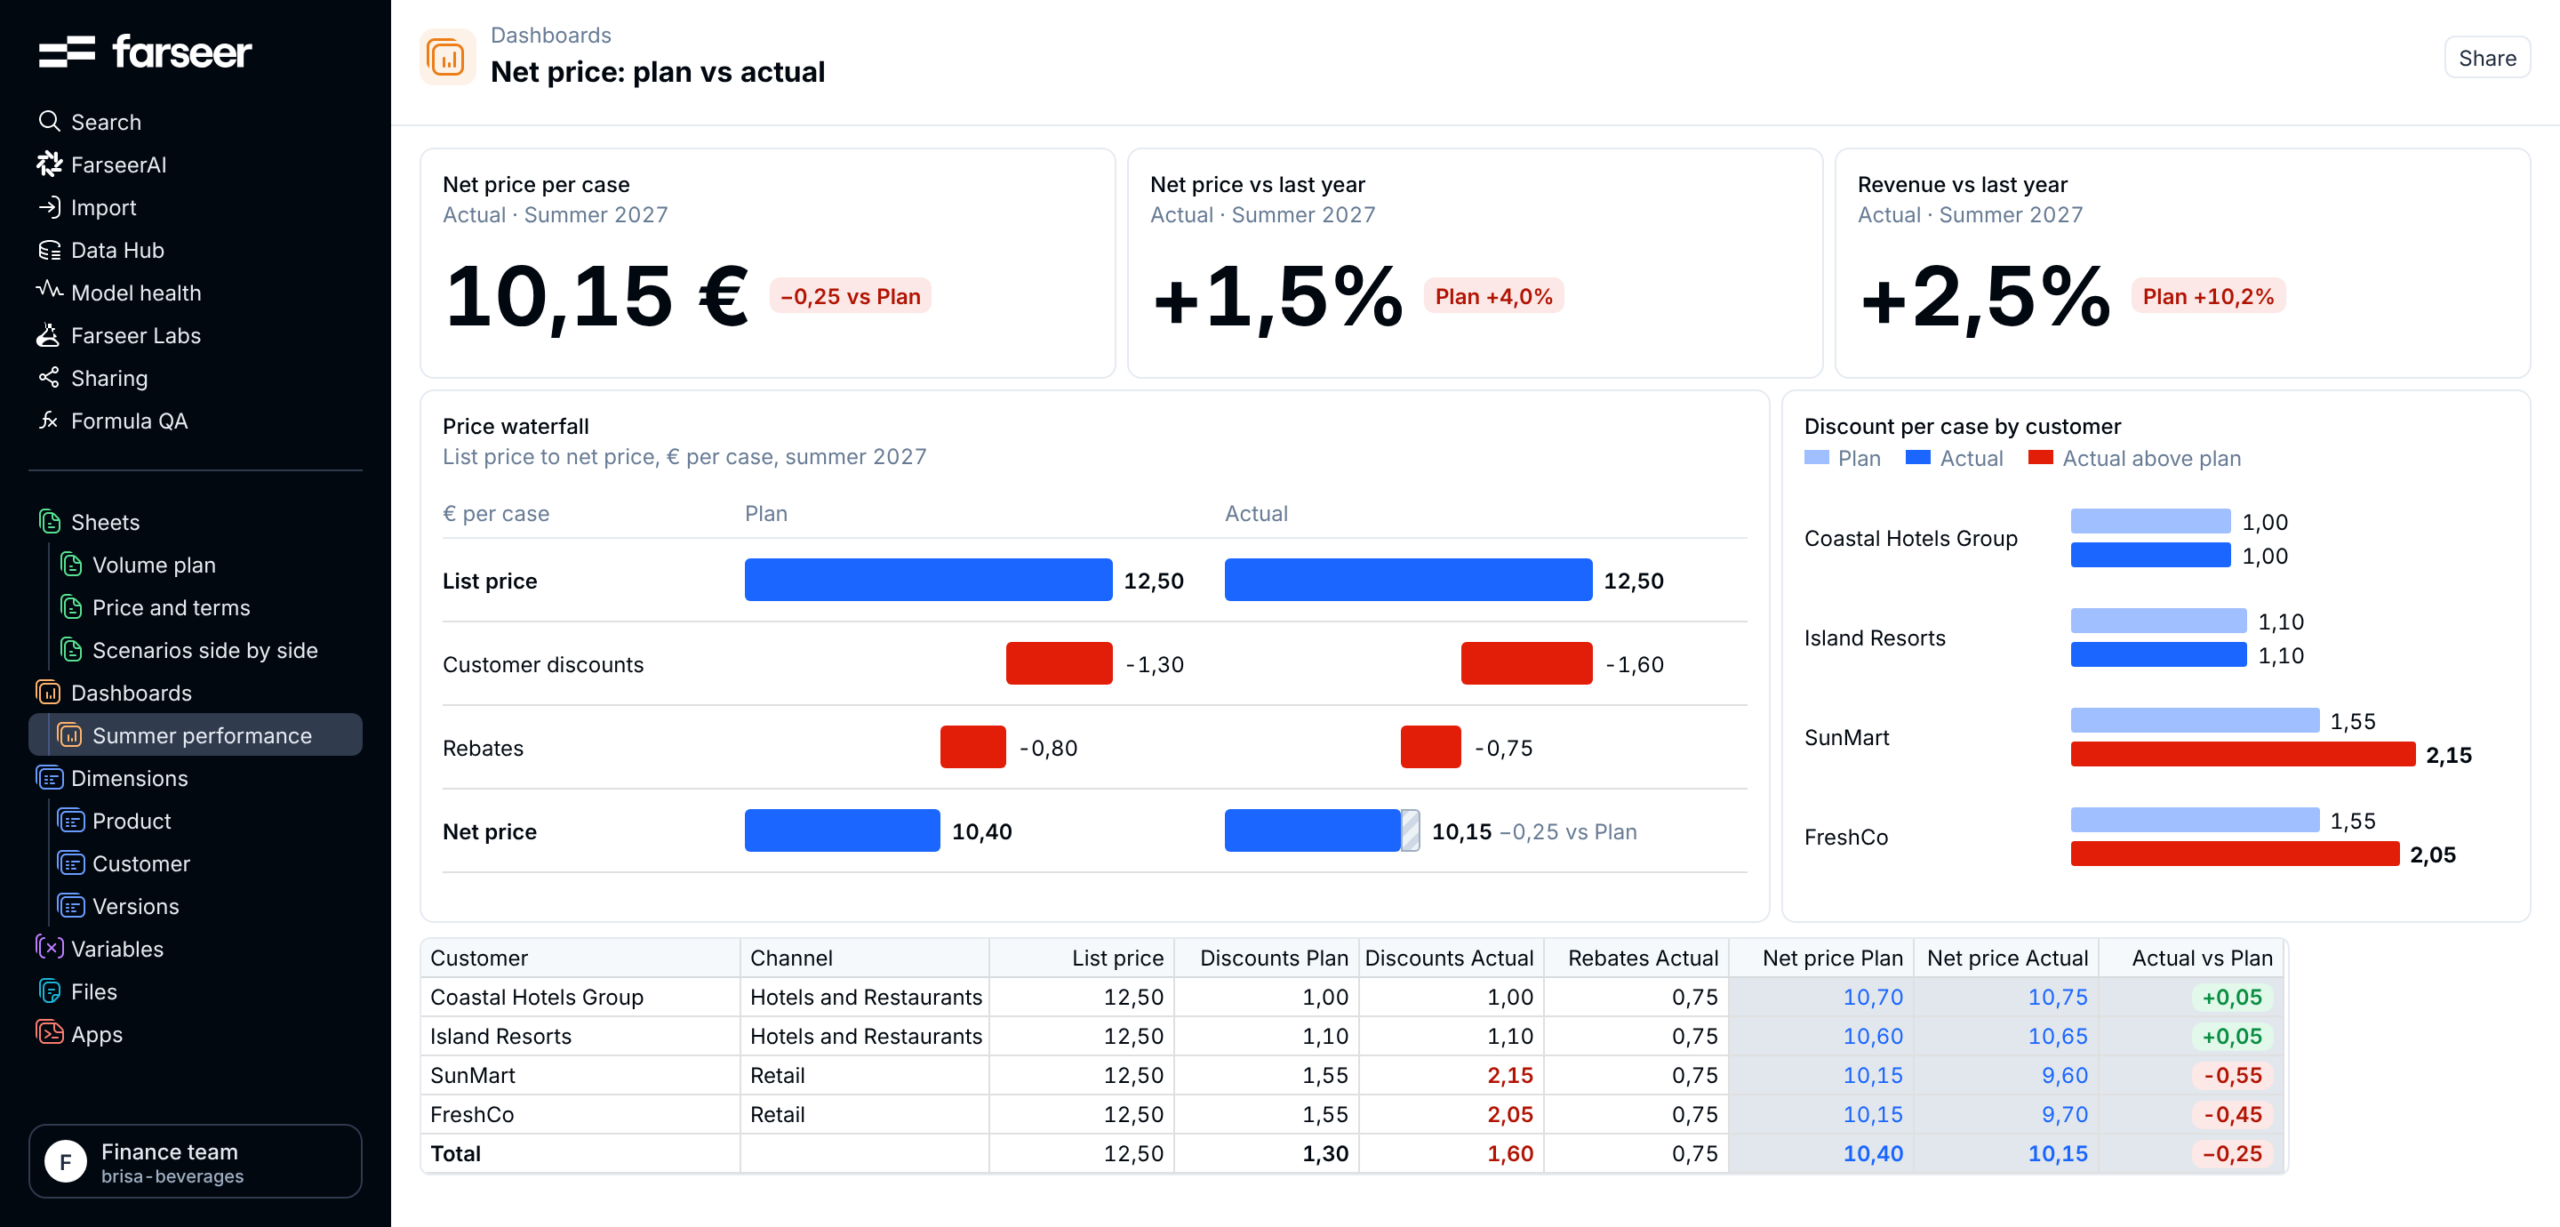
For Finance, the priority is to determine how much of the planned price increase will be retained, which customer agreements drive the difference, and how this affects the revenue forecast.
Understanding Profitability Through Connected Revenue and Cost Drivers
Costs add further complexity to FMCG financial planning. Procurement teams track raw material and packaging prices, while logistics teams manage freight and distribution charges. When cost forecasts are separate from sales and pricing plans, Finance may rely on outdated assumptions as the business evolves.
Take our beverage manufacturer. The plan expected a margin of €3.20 per case, up from €3.00 last year. But weaker net price realization, combined with higher packaging and distribution costs, brought the actual margin down to €2.75 per case. Despite selling 1% more cases than last year, the company generated approximately 7% less total margin. Revenue grew, but profitability went in the opposite direction.
Farseer connects cost drivers with the same sales volumes and net prices used in the financial plan. When material prices, freight rates, or commercial assumptions change, Finance can update them in one model and see how they affect profitability by product, customer, and channel. Comparing planned and actual margins also makes it easier to identify whether the shortfall comes from lower volumes, weaker net prices, or rising costs.
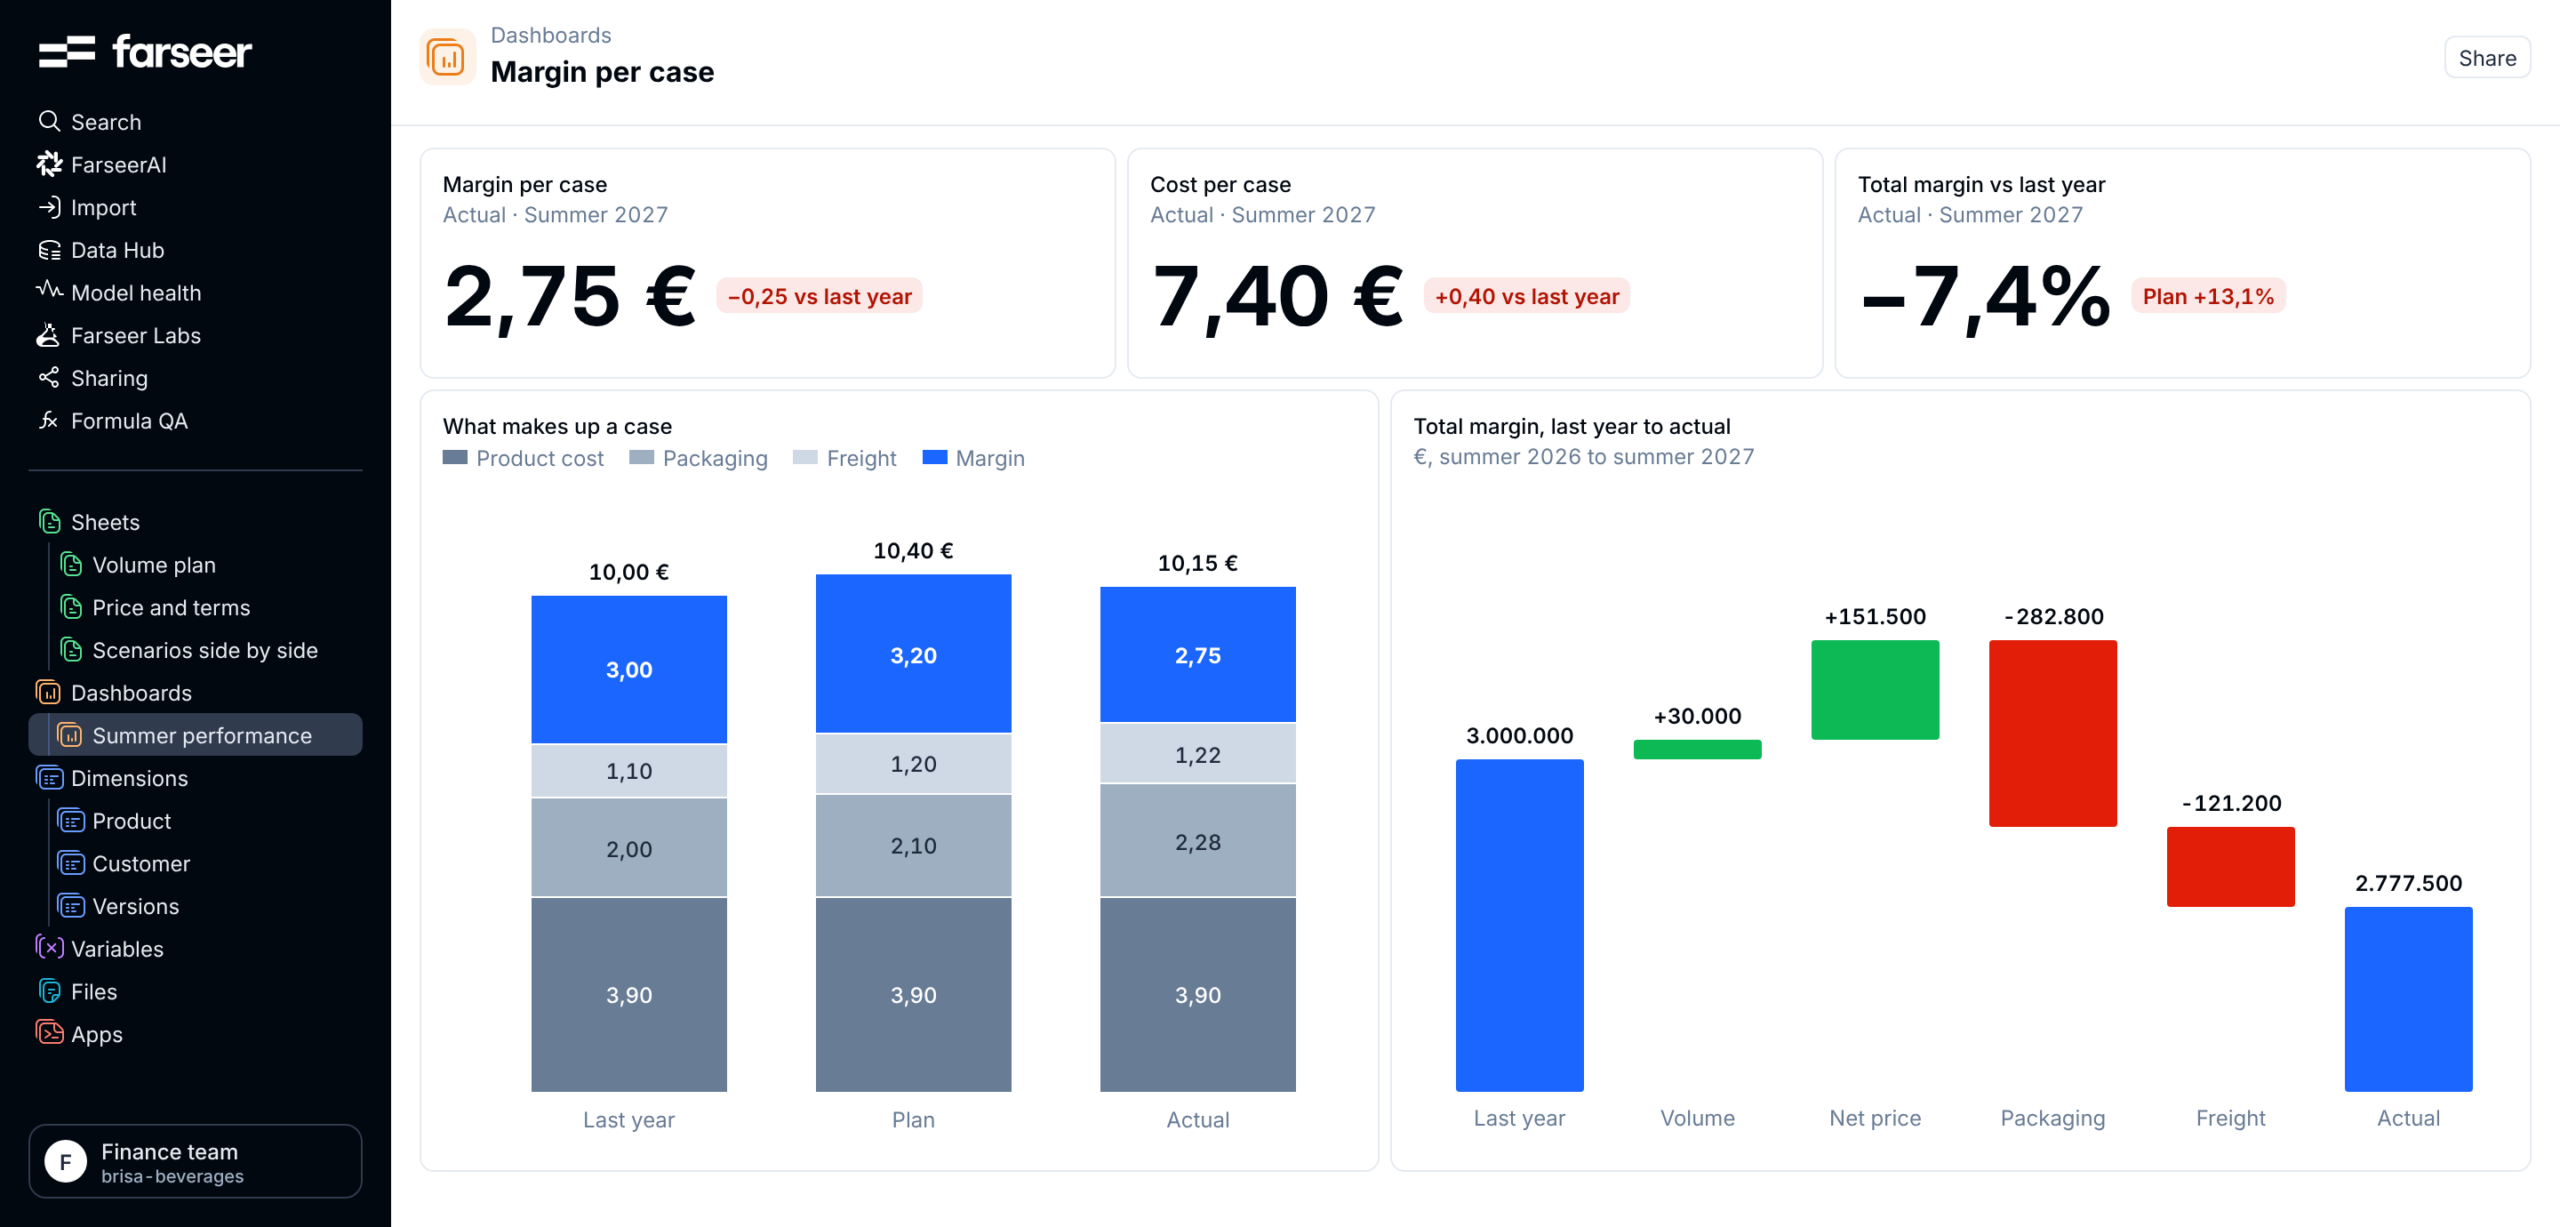
For Finance, the value lies in having a complete view in one place: expected sales volume, earnings per unit, and the cost to deliver growth.
Scenario Planning: Comparing the Financial Impact of Different Decisions
With demand, pricing and costs connected in one model, Finance can compare actual performance against the original plan and update its forecast as new information becomes available.
For our beverage manufacturer, weaker hotel bookings in May, revised retailer terms in June and higher freight costs in July could all be reflected in the financial outlook as those inputs arrive.
Management now has decisions to make. Should the company maintain retailer discounts to support sales volumes, or protect net prices and risk selling fewer cases? What happens to profitability if freight costs rise further? Evaluating these options is difficult when each team maintains its own assumptions and spreadsheets.
Farseer allows Finance to test different scenarios in the same model used for planning and forecasting. Teams can adjust volumes, net prices and costs, compare the outcomes side by side, and see how each scenario affects revenue and profitability without rebuilding the financial model.
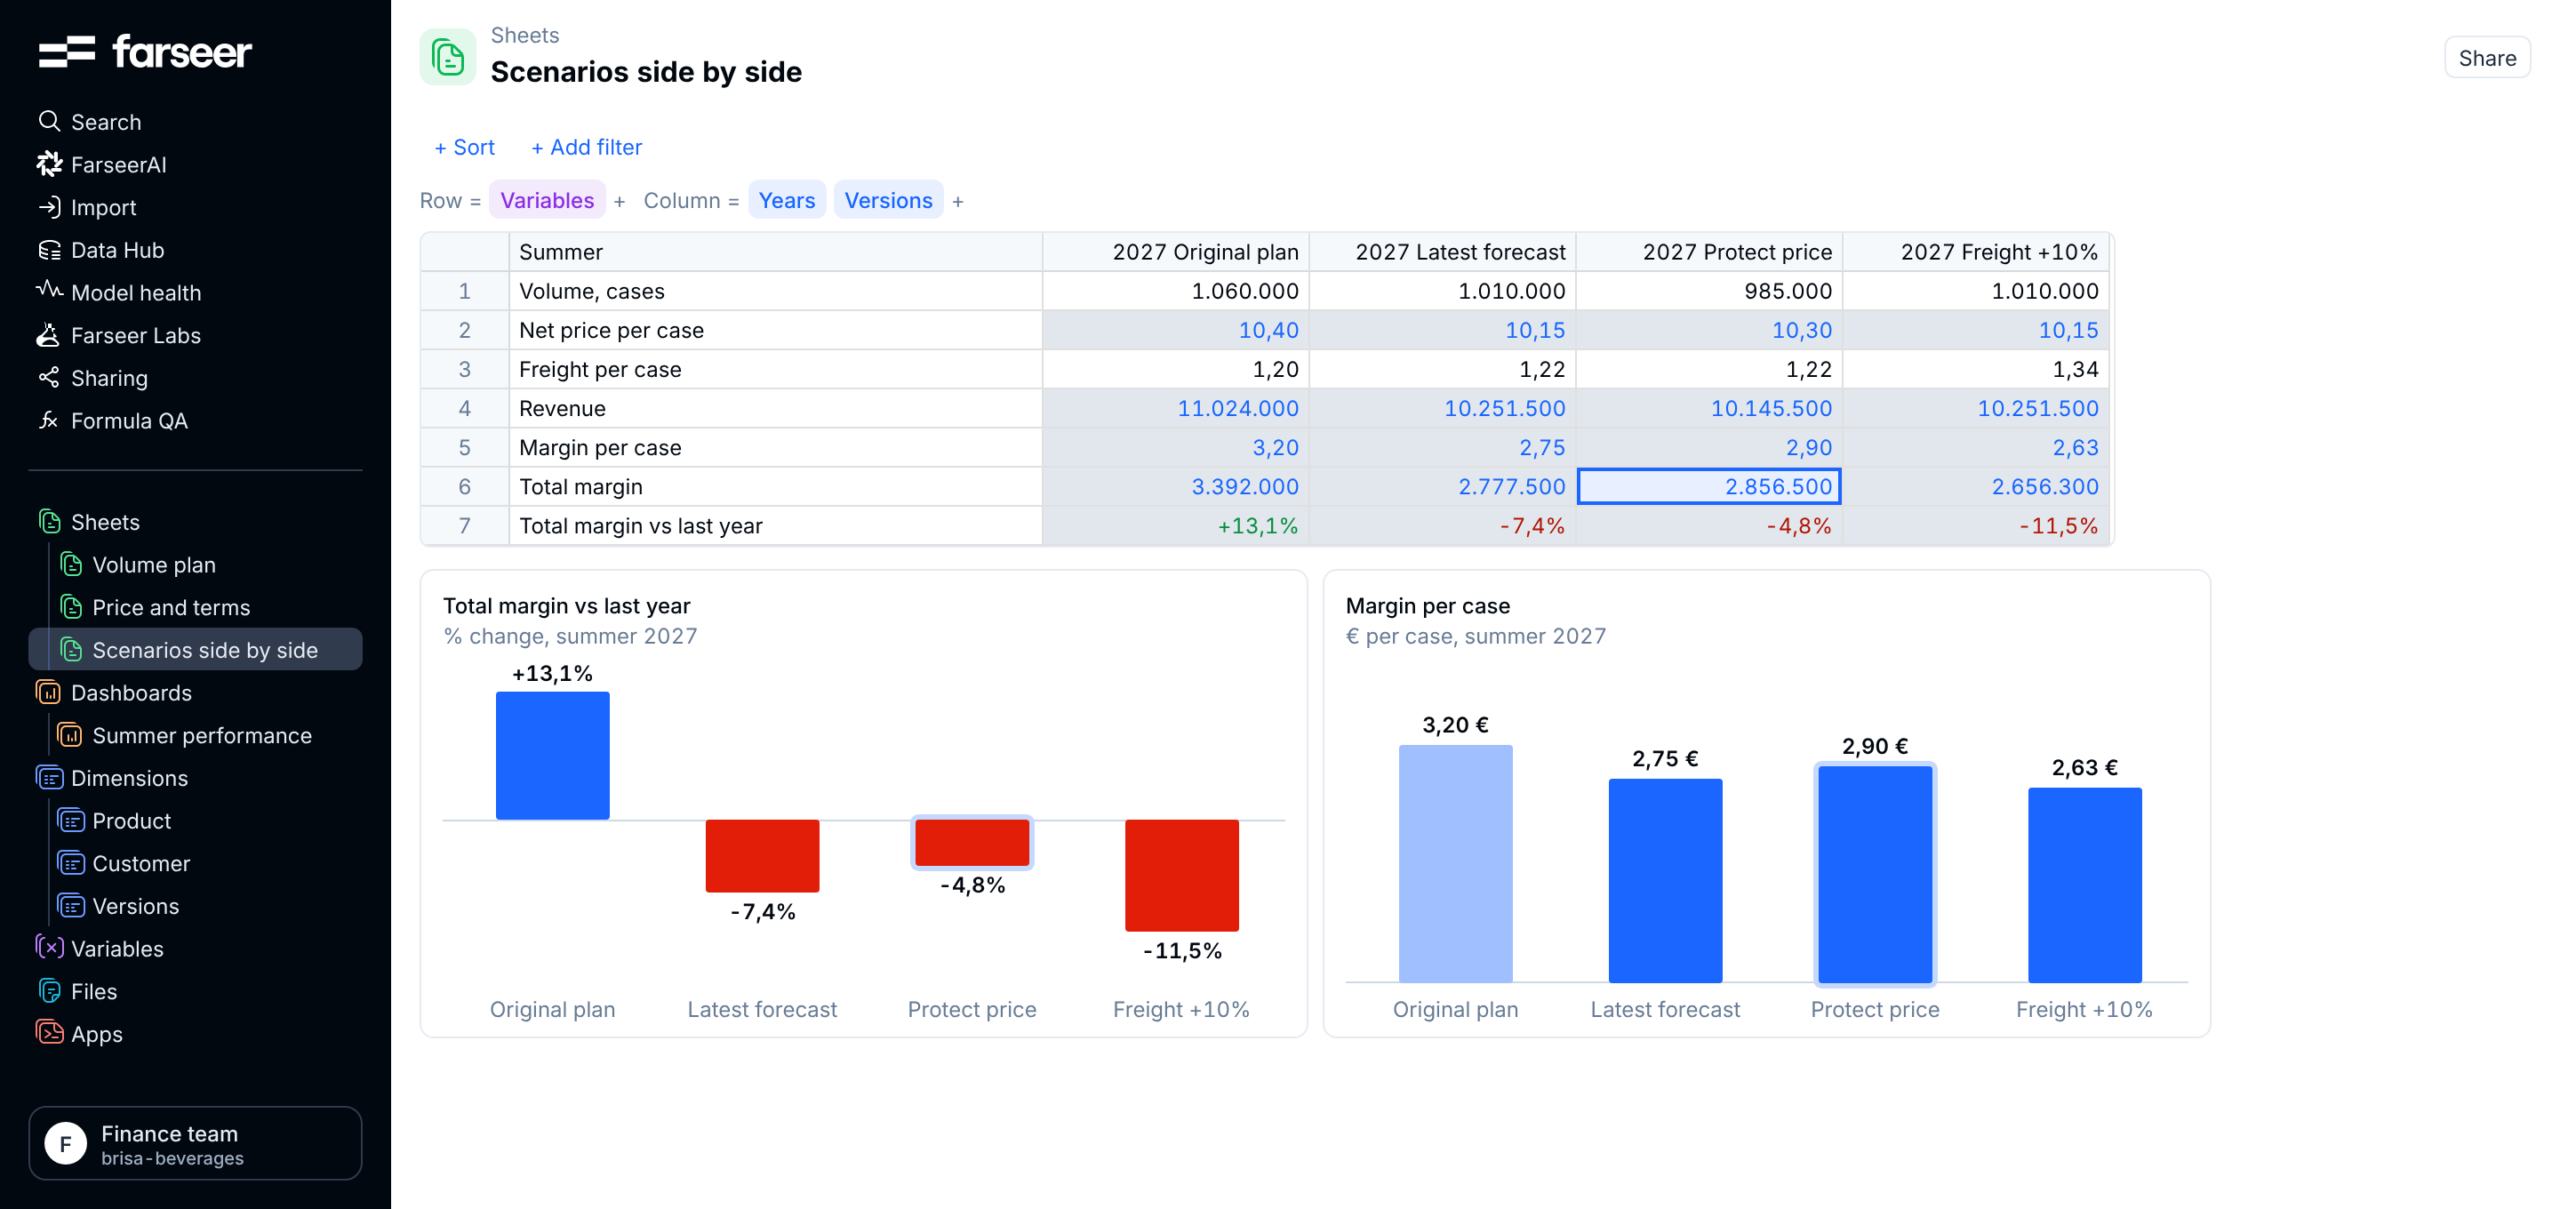
Finance can compare the financial impact of different options before management commits to a decision.
Assessing the Effectiveness of Your FMCG Planning Process
Our beverage manufacturer didn’t lack information. The warning signs were there, from weaker demand to changing retailer terms and rising costs. The problem was that these signals didn’t show up in the financial plan early enough to act.
Before your next planning cycle, ask yourself three questions:
- Can we explain our volume forecast? Do we understand the assumptions behind expected growth, and can we compare them with historical demand patterns?
- Do we know how profitable our sales really are? Can we see how customer discounts, rebates and changing costs affect margins by product, customer and channel?
- How quickly can we react when assumptions change? Can Finance update the forecast, see the impact on profitability and compare alternative scenarios without reconciling multiple spreadsheets?
If handling these questions requires pulling data from several teams and rebuilding financial models, there’s room to improve how your business plans.
Farseer brings these drivers, along with actuals, into one financial model down to the SKU, customer, and channel level. As new information becomes available in real time, Finance can update its assumptions and see the impact on revenue and profitability. Instead of reconciling separate plans after the quarter closes, teams can compare planned and actual performance, revise forecasts and test scenarios as there is still time to act.

FAQ
Why does FMCG financial planning fail?
It usually comes down to three things: volume forecasts built on last year’s sales plus a growth rate, price assumptions that leave out discounts and rebates, and cost forecasts kept separate from sales and pricing plans. When these drivers sit in different tools, the financial plan drifts away from reality.
Why are growth-rate forecasts unreliable in FMCG?
Historical sales already include one-off orders, promotions, stockouts and distribution changes. A flat growth rate carries those distortions into the next plan and misses changes in seasonal demand, weather or retailer activity.
What is net price realization?
Net price realization is the price a manufacturer keeps after customer discounts, rebates and other commercial terms. It is often lower than the planned price increase, especially when Sales offers extra concessions to protect volume.
How can revenue grow while profit falls?
If net prices rise less than planned and material, packaging or freight costs go up, margin per unit drops. Selling more units then isn’t enough to make up for it, so revenue grows while total margin shrinks.
How do you find the cause of a margin shortfall?
Compare planned and actual volumes, net prices and costs in the same model, broken down by product, customer and channel. That shows whether the gap comes from lower volume, weaker net price or higher costs.
How does scenario planning help FMCG Finance teams?
It lets Finance compare the revenue and profit impact of different options, such as keeping retailer discounts or protecting price, before management commits to a decision.
How often should FMCG companies update their forecast?
Update it whenever a key input changes, such as demand signals, customer terms or cost rates, rather than only at quarter close. That gives Finance time to act while results can still be influenced.

Budget Forecasting Methods: 6 Approaches Every CFO Should Know (And How to Choose)
Read more
Strategic Financial Planning That Actually Drives Results
Read more