Seasonality and Trend Analysis: The 4 Patterns Every FP&A Team Should Recognise
Look at three years of revenue and you are not looking at one thing. You are looking at several forces stacked on top of each other. A long-term direction pulling the numbers up or down. Movement that reflects shifts in the wider economy. A rhythm that repeats every year like clockwork. And noise that means nothing at all.
If you cannot separate these forces, your forecast becomes a guess. If you can, you start to forecast with intent. You know which signals to extend forward and which ones to leave behind.
In this article we will walk through the four patterns every FP&A professional should be able to spot on sight. Trend. Cycle. Seasonality. And the combination of trend plus seasonality, which is what most real business data actually looks like. We will keep it practical, and we will show how this thinking moves from theory into the tools finance teams use every day.
Read: Rolling Forecasts: The Complete FP&A Guide (With Examples)
Why decomposition matters more than the chart
Decomposition is a fancy word for a simple idea. You break a messy line into its parts so you can understand each one on its own.
Think of a song. What sounds like one piece of music is actually dozens of separate tracks: vocals, drums, bass, guitar, and keyboards. A producer can isolate each track, adjust it, then mix them back together. Forecasting works the same way. Your demand is the finished song. Trend, seasonality, and cycles are the individual tracks. Random noise is the background hiss.
Here is why this matters for FP&A specifically. When a number misses plan, the board wants to know why. “Sales were soft” is not an answer. “Underlying trend is still up four percent, but we hit the seasonal trough early because Easter shifted into March” is an answer. Decomposition turns a flat reaction into a real explanation.
It also protects you from two classic errors.
- The first is reading noise as signal and chasing a blip that will reverse next month.
- The second is reading signal as noise and dismissing a real shift because it looks small in week one.
Once you can name the patterns, you stop making both mistakes so often.
So let us name them.
Pattern 1: Trend
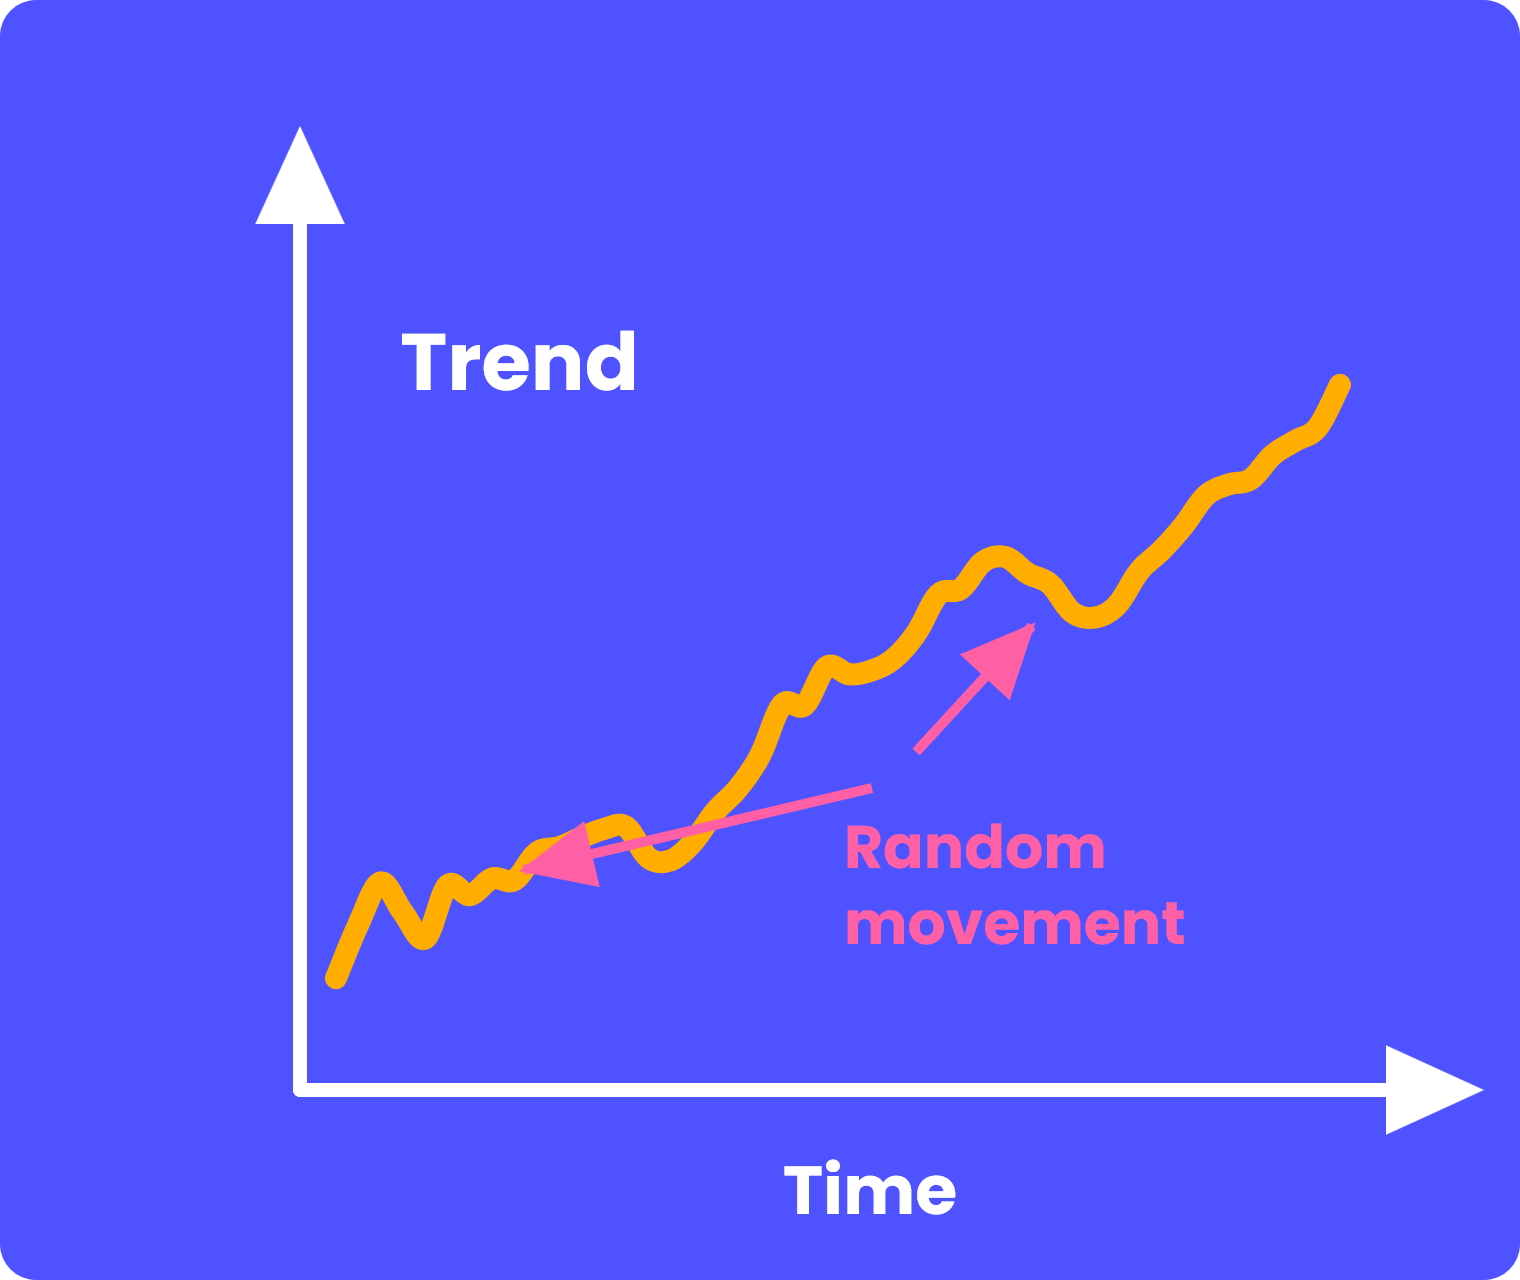
A trend is the long-term direction of your data. Strip away the wiggles and the bumps, and the trend is the line your business is travelling along over months and years.
Trends can rise, fall, or stay flat. A subscription business adding logos every quarter shows an upward trend. A legacy product being phased out shows a downward trend. A mature market with stable share might show no trend at all.
The important thing about a trend is that it is slow. It does not flip from one month to the next. It bends gradually. This is what makes it the most reliable thing to extend into a forecast. If the underlying direction has been up for two years, the base case for next year is more of the same, adjusted for anything you know is changing.
Read: Short-Term Forecasting Explained: Methods, When to Use It, and When Not To
But here is the catch. A trend rarely shows itself in a clean straight line. Real data jitters around the direction it is heading. Look closely at any growth chart and you will see the line stumble, dip, recover, and overshoot. Those small movements are not the trend. They are random movement, sometimes called residual or irregular variation.
Random movement is the part of your data with no pattern at all. A one-off supplier delay. A single large order that landed on the last day of the month. A weather event. These things move the number, but they tell you nothing about next quarter. The skill is drawing the trend line through the noise rather than connecting every bump and calling it insight.
Pattern 2: Cycle
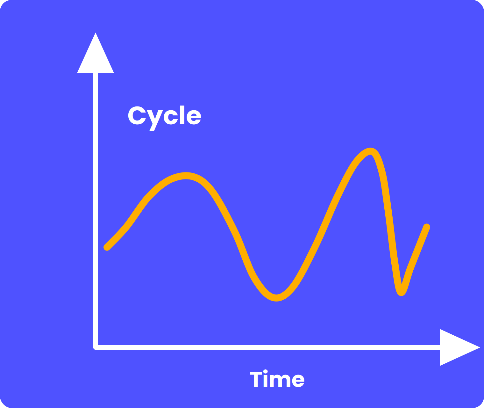
A cycle is a rise and fall in your data that does not happen at fixed intervals. It is usually tied to the broader business or economic environment. Think expansions and recessions. Think credit cycles. Think the multiyear boom and bust in commodities, construction, or capital spending.
The defining feature of a cycle is that its length varies. One upswing might last eighteen months. The next might last four years. There is no calendar you can set your watch by. That is what separates a cycle from seasonality, which we will get to next.
Cycles matter for FP&A because they shape the environment your plan lives inside. If you are forecasting into the back half of an expansion, your assumptions about demand, pricing power, and hiring should look different from a forecast built at the bottom of a downturn. A team that ignores the cycle tends to extrapolate good times forever, then gets blindsided when the turn comes.
Read: Continuous Forecasting: Why It Beats Annual Budgets
Cycles are also the hardest of the four patterns to forecast. Because the timing is irregular, you cannot simply project the last cycle forward and expect the next one to match. The best you can usually do is recognise where you probably sit in the current cycle, build scenarios around the turning points, and avoid betting the whole plan on the cycle continuing.
This is one reason rolling forecasts have become so popular. A static annual budget locks in your view of the cycle at one moment, usually in the autumn before the year even starts. By the time spring arrives, the environment may have shifted underneath you. A forecast you refresh every month gives you room to respond as the cycle reveals itself.
Pattern 3: Seasonal pattern
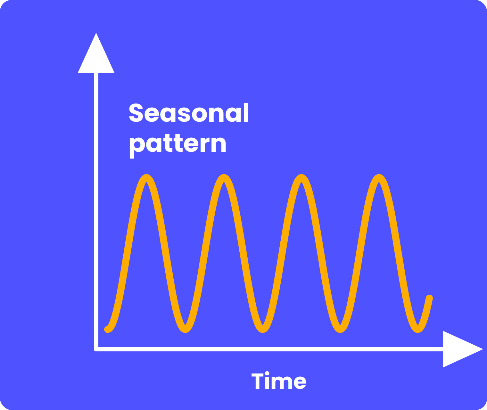
Seasonality is the rhythm that repeats at fixed, known intervals. This is the pattern most finance people already feel in their bones even if they have never named it.
Retail spikes in the fourth quarter. Ice cream sells in summer. Accounting software gets busy near tax deadlines. Tourism follows the school calendar. A gym signs up half its yearly members in January. These are seasonal patterns. They repeat every year, in roughly the same months, with roughly the same shape.
The key word is fixed. Unlike a cycle, seasonality runs on a calendar you can predict. That predictability is a gift. Of the four patterns, seasonality is often the easiest to model well, because the past is a genuinely good guide. If December is always your biggest month by a factor of three, next December almost certainly will be too.
Read: Rolling Forecast Software: Top 5 Options in 2026
For FP&A, seasonality is where a lot of monthly variance noise actually comes from. A revenue number that drops twenty percent from December to January can look alarming on a month-on-month basis. But if January always drops twenty percent from December, that is not a problem. That is the season doing exactly what it always does. The mistake is treating a known seasonal dip as a performance miss.
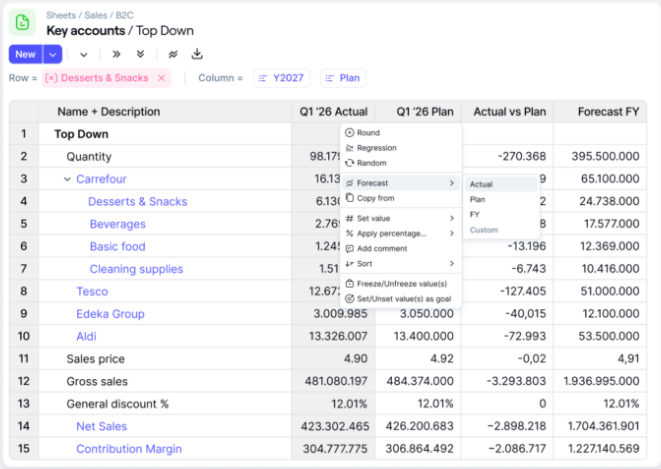
This is exactly the kind of work that modern FP&A platforms now handle automatically. Farseer, for example, examines your historical data and checks for seasonality, volatility, and other patterns before it forecasts. Rather than asking you to hand pick a method, it identifies how the data behaves and applies the approach that fits. For a finance team, that means the seasonal shape of each product, region, or channel gets captured without you building a separate model for every line by hand.
The practical lesson is to always compare like with like. Look at this December against last December, not against last month. Look at this quarter against the same quarter a year ago. Year over year comparisons strip seasonality out automatically, which is why they remain one of the most useful habits in finance.
Pattern 4: Trend with seasonal pattern
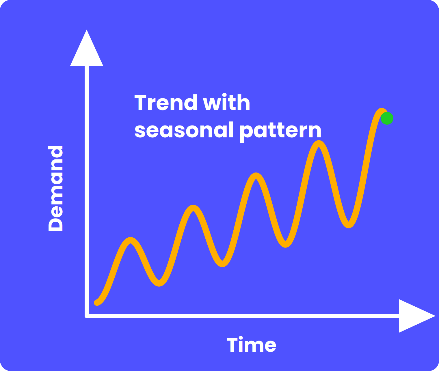
Pure trend is rare. Pure seasonality is rare. Most real business data is a trend and a seasonal pattern layered together.
Picture demand that climbs steadily year after year, but inside that climb it also rises and falls in a repeating annual wave. Each year the peaks are higher than the last, and each year the troughs are higher than the last troughs. The line marches upward while it also breathes in and out. That breathing is the season. The march is the trend.
A growing retailer shows this clearly. Sales rise every year because the business is expanding. Within each year, sales still surge at Christmas and ease off in the quiet months. You cannot forecast one without the other. If you only model the trend, you will badly underestimate December and overestimate February. If you only model the season, you will miss the year-on-year growth entirely.
Read: What Is a 3+9 Forecast? How It Works, When to Use It and How to Implement It
This is why decomposition is not an academic exercise. To forecast a trend with seasonality, you need to pull the two apart, project each one forward, and then add them back together. Estimate the trend going forward. Apply the seasonal shape on top. The result is a forecast that grows and breathes the way the real business does.
Two layers means two ways to be wrong, and FP&A teams tend to miss one or the other. They nail the seasonal swing but flatten the growth. Or they capture the growth but smooth away the seasonal peaks that finance the whole year. The discipline is to ask, every time, whether you have accounted for both. Where is this heading over time, and what is the repeating shape along the way.
The mistake that quietly wrecks forecasts: cycle versus seasonality
If you take one thing from this article, make it this. Cycles and seasonality look similar and behave completely differently. Mixing them up is one of the most common and most expensive forecasting errors in finance.
The difference comes down to timing. Seasonality repeats at fixed, known intervals. Every year. Same months. A cycle repeats at irregular, unknown intervals tied to the wider economy. Both produce a rise and fall. Only one of them runs on a calendar.
Read: 6 Best Practices for Rolling Forecasts That Work
Here is why it matters in practice. Seasonality can be projected forward with real confidence, because the timing is locked. A cycle cannot, because the timing floats. If you mistake a cycle for seasonality, you will assume the next upswing arrives right on schedule, and you will build a plan around a turning point that may be a year early or a year late.
A quick way to separate them. Ask whether the pattern is anchored to the calendar or to the economy. School holidays, weather, tax dates, and shopping events anchor to the calendar, so they are seasonal. Interest rates, business confidence, and capital spending anchor to the economy, so they are cyclical. When you are unsure, look at the length. A pattern that is always twelve months is seasonal. A pattern that runs three years then five years then two is cyclical.
Get this distinction right and your forecasts immediately become more honest. You stop pretending you can time the economy, and you start using the parts of the past you can genuinely rely on.
Why all of this changes your forecast accuracy
It is fair to ask whether naming patterns actually moves the number. It does, and in three concrete ways.
First, it sharpens your base case. When you know the trend, you extend the right slope. When you know the season, you apply the right monthly shape. The forecast stops being a flat average and starts matching the real rhythm of the business.
Second, it improves your variance commentary. Instead of explaining a miss with vague language, you attribute it. Trend held, but the seasonal peak came late. Cycle softened across the whole market. A genuine new shift appeared that we should fold into the next forecast. That precision is what earns finance a seat in the strategy conversation rather than the scorekeeping one.
Third, it tells you what to do with surprises. When an actual lands away from plan, pattern thinking helps you classify it fast. Is it noise that will reverse, a seasonal effect you under weighted, a cyclical turn, or a real change in the underlying trend. Each one calls for a different response. Random noise gets ignored. A trend change gets built in.
This is also where the move from spreadsheet to platform pays off. Doing this by hand across hundreds of product lines, regions, and entities is slow and easy to get wrong. The pattern logic that takes a skilled analyst hours to apply to one series needs to run across thousands of series, every month, without the model breaking. That is a tooling problem as much as an analytical one.
Read: MAPE vs RMSE: How to Measure Forecast Accuracy in FP&A
From theory to the FP&A tool
Everything above is the concept. Now picture it inside the system your team actually plans in.
In a spreadsheet world, decomposition is painful. You build helper columns for the trend. You build a separate seasonal index. You hand stitch them together for each line. Then someone copies a cell wrong, the model breaks silently, and the seasonal shape quietly disappears from the forecast nobody re checked. The maths is not the hard part. The maintenance is.
This is the gap modern FP&A platforms are built to close, and it is worth seeing how the four patterns show up in practice. Farseer was designed to move finance teams beyond disconnected spreadsheets into one connected model. Its AI looks at the behaviour of your historical data, detects whether a series is trending, seasonal, volatile, or some combination, and applies a fitting forecast method without you configuring it line by line. The decomposition we just walked through stops being a manual chore and becomes something the platform handles in the background.
The driver-based approach matters here too. Because the model is connected, you can separate the trend from the season at the level that drives your business, then push a change through and watch it flow across revenue, margin, and cash instantly. Want to test what happens if the seasonal peak is ten percent weaker this year. You adjust the assumption and the whole plan updates. No rebuilding. No version chasing. That is the difference between analysing patterns once a year in a static budget and working with them live in a rolling forecast.
Read: Everything You Need to Know About Driver-Based Forecasting
The payoff for FP&A is time and trust. Less time wrangling helper columns, more time interpreting what the patterns mean for the business. And a forecast the team can defend in the boardroom, because the trend, the season, and the assumptions behind them are all visible and traceable rather than buried in a formula three tabs deep.
Common mistakes FP&A teams make with patterns
Even strong teams slip on the same handful of errors. Watch for these.
Reading noise as a trend. One unusual month is rarely a turning point. Wait for confirmation before you rebuild the forecast around a single data point.
Comparing month on month when you should compare year over year. This is the fastest way to mistake a seasonal dip for a performance problem. Anchor your comparisons to the same period last year.
Assuming the cycle is seasonality. If you treat an economic upswing like a calendar event, you will time the next turn wrong. Be honest about which patterns you can predict and which you cannot.
Forecasting trend without season, or season without trend. Real data usually carries both. Account for the direction and the rhythm, not just whichever one is easier to see.
Letting the model decay. A seasonal pattern from five years ago may not hold today. Customer behaviour shifts. Channels change. Revisit the patterns regularly rather than trusting a model you built once and never questioned.
Over engineering the noise. Not every wiggle deserves an explanation. Sometimes random movement is just random. Spending an afternoon explaining a blip that reverses next week is effort the business did not need.
The Takeaway
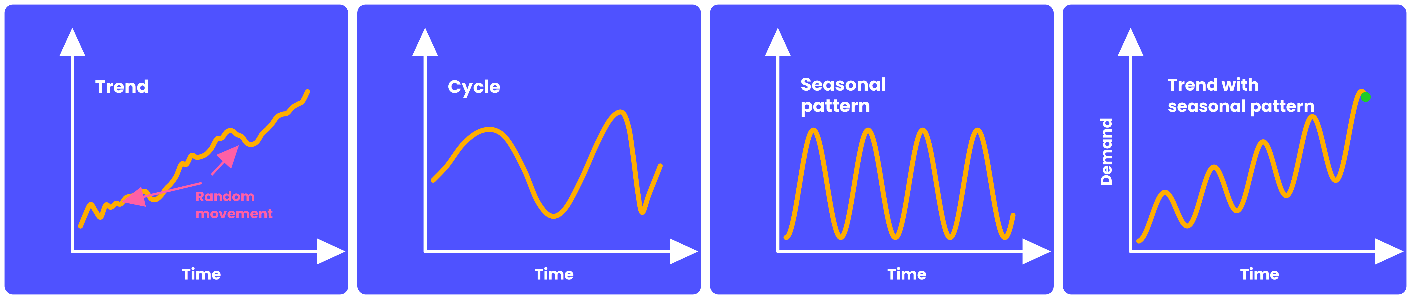
Trend, cycle, seasonality, and the combination of trend with seasonality. Four patterns. Once you can spot them on a chart, you read your own numbers differently. You stop reacting to noise. You stop mistaking a known seasonal dip for a real miss. You stop assuming the economy will turn on a fixed schedule. And you start building forecasts that grow and breathe the way the business actually does.
The concept is timeless. The execution is what has changed. What used to take helper columns and careful manual stitching can now run across your whole model automatically. If pattern-based forecasting is on your team’s agenda, it is worth seeing how a connected platform like Farseer handles trend and seasonality in practice, so your analysts can spend more time interpreting patterns and supporting better business decisions, rather than maintaining spreadsheets.

FAQ
What is the difference between a trend and a cycle?
A trend is the long-term direction of your data, moving slowly up, down, or sideways over months and years. A cycle is a rise and fall tied to the broader economy that repeats at irregular intervals. The trend is the slope. The cycle is the wave around it. The trend rarely reverses quickly, while a cycle can turn as economic conditions change.
How is seasonality different from a cycle?
Seasonality repeats at fixed, known intervals, usually within a year, and is tied to the calendar. A cycle repeats at irregular, unpredictable intervals and is tied to the economy. Both create a rise and fall, but only seasonality runs on a schedule you can forecast with confidence. If the pattern is always twelve months long, it is seasonal. If its length varies, it is cyclical.
Why does separating these patterns matter for forecasting?
Because each pattern behaves differently, and you forecast each one differently. You extend a trend, apply a seasonal shape, build scenarios around a cycle, and ignore random noise. If you treat them as one blurry line, you tend to chase noise, miss seasonal swings, or mistime the cycle. Separating them gives you a base case that matches how the business actually moves.
What is random movement and should I forecast it?
Random movement is the part of your data with no pattern, caused by one off events like a single large order or a supplier delay. You should not try to forecast it, because by definition it does not repeat. The goal is to recognise it as noise and look past it to the patterns that do repeat.
How do I know if my data has both trend and seasonality?
Look at the data across several years. If the overall level rises or falls over time and there is also a repeating shape within each year, you have both. A clear sign is peaks that get higher every year alongside troughs that also get higher. In that case you need to model the direction and the repeating shape together, not just one of them.
Can software detect these patterns automatically?
Yes. Modern FP&A platforms can analyse historical data, detect whether a series is trending, seasonal, or volatile, and apply a fitting forecast method without manual setup. Farseer, for instance, checks for seasonality and other patterns in your data and selects an approach that suits how each series behaves, which removes much of the manual decomposition work finance teams used to do in spreadsheets.
How often should I review my seasonal assumptions?
At least once a year, and more often if your business is changing fast. Seasonal patterns shift as customer behaviour, channels, and product mix evolve. A pattern that held five years ago may no longer be accurate. Treat your seasonal model as something to validate against recent actuals rather than a fixed truth.
What is decomposition in forecasting?
Decomposition is the process of breaking a time series into its underlying components, such as trend, seasonality, cycle, and random movement. By analysing each component separately, FP&A teams can better understand what is driving historical performance and build more accurate forecasts. Rather than treating the data as one noisy line, decomposition helps distinguish long-term growth from recurring seasonal patterns and one-off events.
Can a data series have trend, seasonality, and cycles at the same time?
Yes. Most real-world business data contains more than one pattern. A company may experience long-term revenue growth (trend), predictable holiday sales peaks (seasonality), and periods of stronger or weaker demand caused by economic conditions (cycles). Effective forecasting separates these components so each can be modelled appropriately instead of treating them as a single pattern
What is the difference between seasonality and random variation?
Seasonality is a predictable pattern that repeats at fixed intervals, such as higher retail sales during the holiday season or increased tourism during summer. Random variation, also called irregular variation or noise, consists of one-off events that do not follow a recurring pattern, such as supplier disruptions, extreme weather, or an unusually large customer order.