

Consistency
Data is exported, loaded, and refreshed on a schedule.
The trade promotion that ended this morning won’t show in margin until the next refresh, and by then pricing for next week is already set.
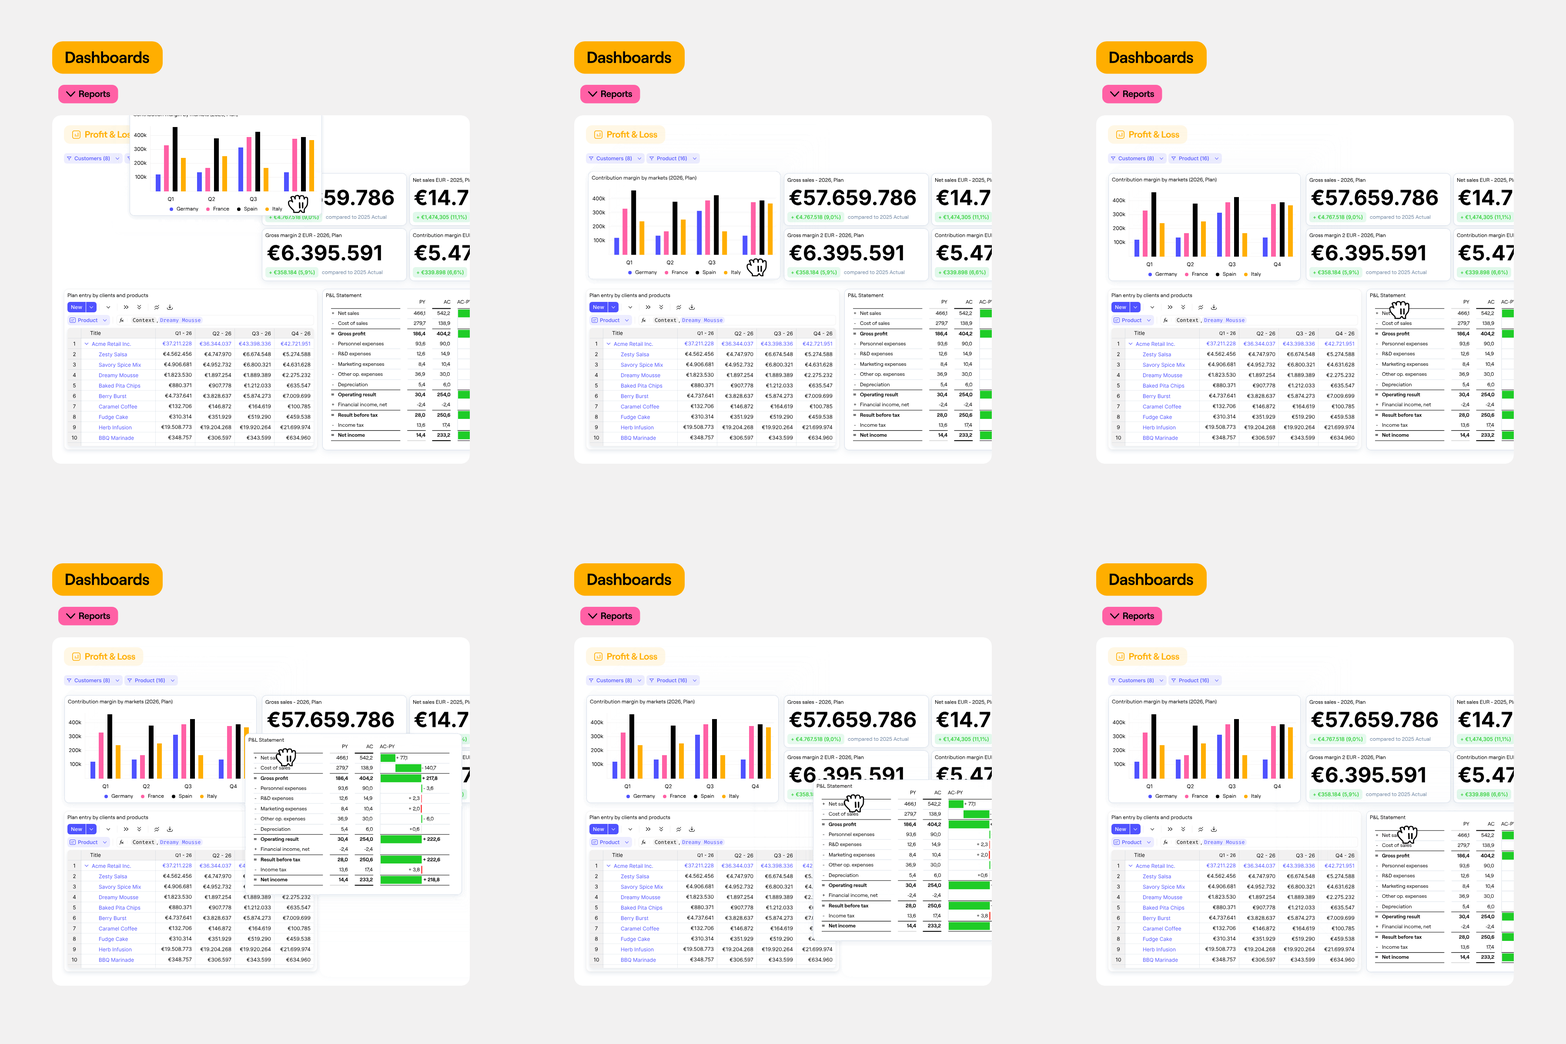
Describe the view you need, and Farseer AI builds it, IBCS-ready, on your financial model.
No exports, refresh schedule or second database. Change a number and every chart updates.
From group P&L down to SKU, customer, and channel, every chart reads the same model your planners work in.
Trusted by enterprise finance teams

"Farseer turned our dreams into reality. The tool is so intuitively easy to use that whoever logged in continued to use it. Farseer is a refreshment in terms of the ease of planning and reporting."Read case study






"Feature-wise, Farseer was on par with the big players, but the difference was in the approach. The Farseer team was honest, hands-on, and they truly understood our needs. That's what sealed the deal for us."Read case study


“We tested other solutions, but in the end we chose Farseer because it was very similar to Excel; intuitive, you can copy and paste, and it’s visually familiar. That made it easy for planners to transition. But underneath, it’s a properly structured model with fact tables, dimension tables, and variables everything we couldn’t have in Excel.”Read case study




"From our SAP ERP, Farseer pulls all the historical data, prices, and rebates automatically. We can now create a preliminary sales plan in about ten minutes, apply growth targets, and get margin-level results immediately, something that used to take days."Read case study

"Manual work is cut by more than 50%. And I know exactly where every number came from."Read case study

"Farseer has significantly enhanced the speed of our processes, as well as the quality, level of detail, and reliability of the information we prepare and analyze, bringing notable improvements to our controlling operations."Read case study

"With Farseer, we're seeing results we can act on. Reporting is 30% faster, planning cycles are shorter, and we now have real-time insights at our fingertips. It's been transformative for how we operate."Read case study

Live on the model
Dashboards read the model itself, so they’re never out of date.
Analyze performance from every angle
Slice results by entity, region, product, or department and drill into the drivers behind every KPI.
IBCS by default
Certified notation for actual, plan, and variance in every view.

“Whenever I want to look at the financial plan or any version, I can do it myself — instantly.”
Data is exported, loaded, and refreshed on a schedule.
The trade promotion that ended this morning won’t show in margin until the next refresh, and by then pricing for next week is already set.
You spot a gap in a key account's volume, but you can't adjust the forecast where you see it.
It’s back to the spreadsheet, then another upload, then another refresh.
Every team builds its own view.
Actual, plan, and forecast use different colors and labels in each report, and gross margin is calculated three different ways for the same customer.
Dashboards connect your financial data so you can see performance as it happens
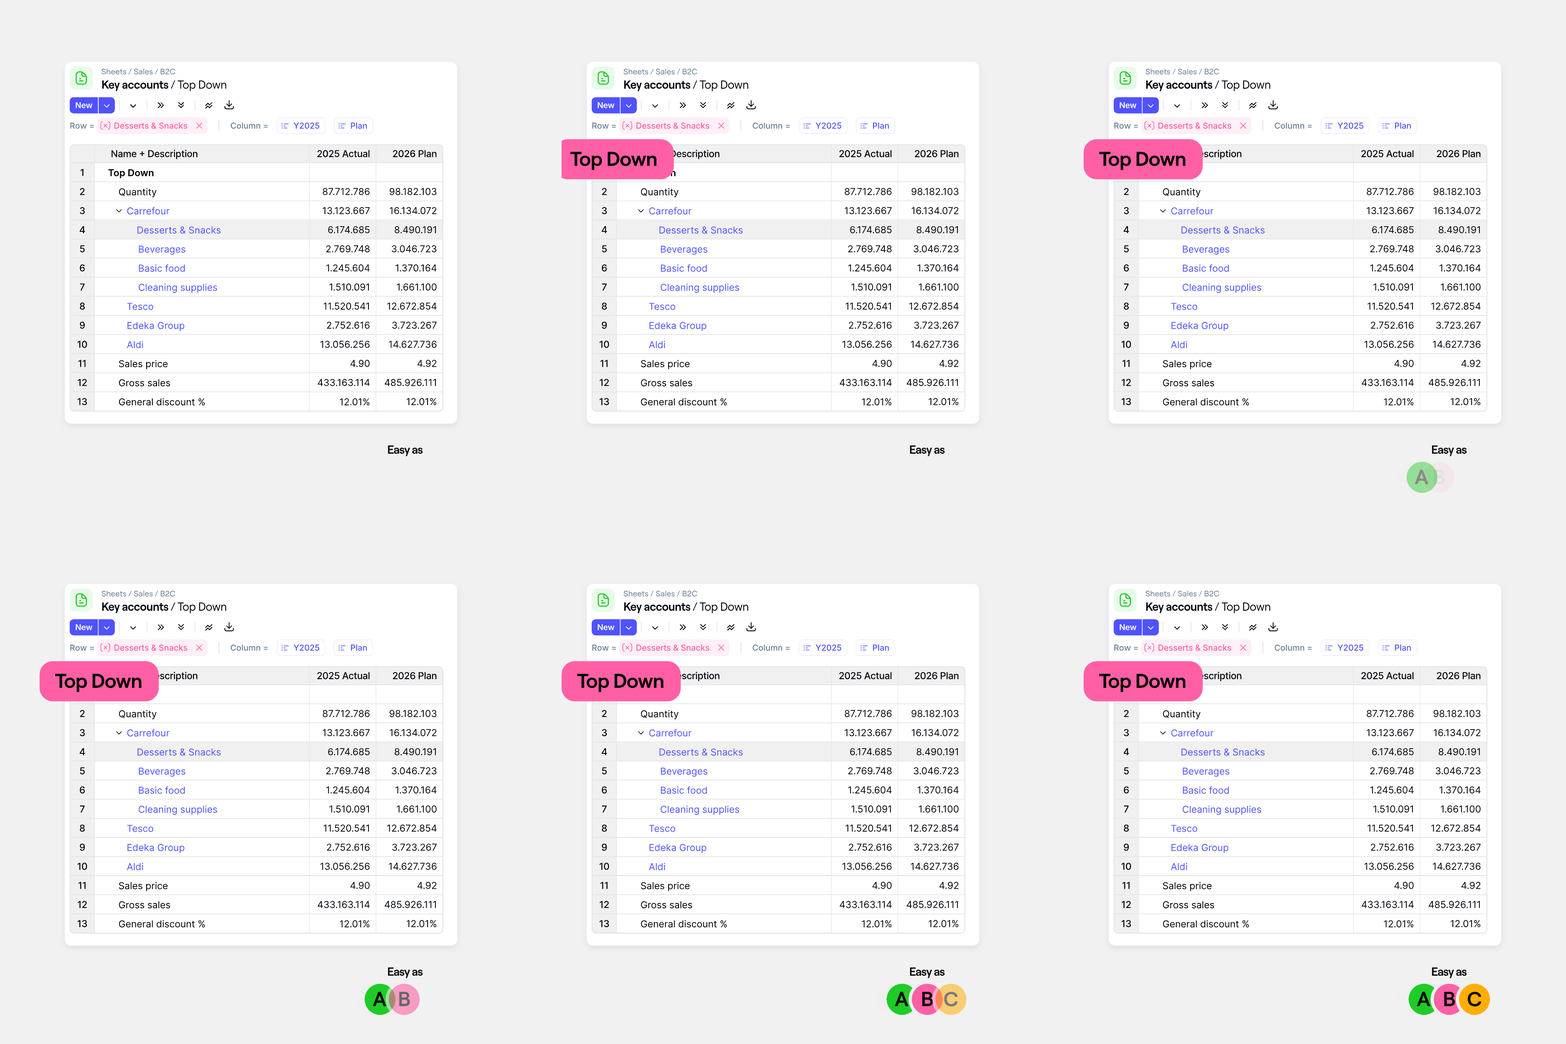
Drill from consolidated results down to entity, brand, SKU, customer, and channel, and filter by region, retail chain, or period without rebuilding a report.
Every value stays linked to the model, so the breakdown always adds up to the total.
Click any value to expand the data behind it instantly.
Analyze results by entity, product, region, or custom dimensions.
All tables stay linked to the underlying financial model and calculations.

“Farseer gave us the clarity to understand what really drives our financial performance.”
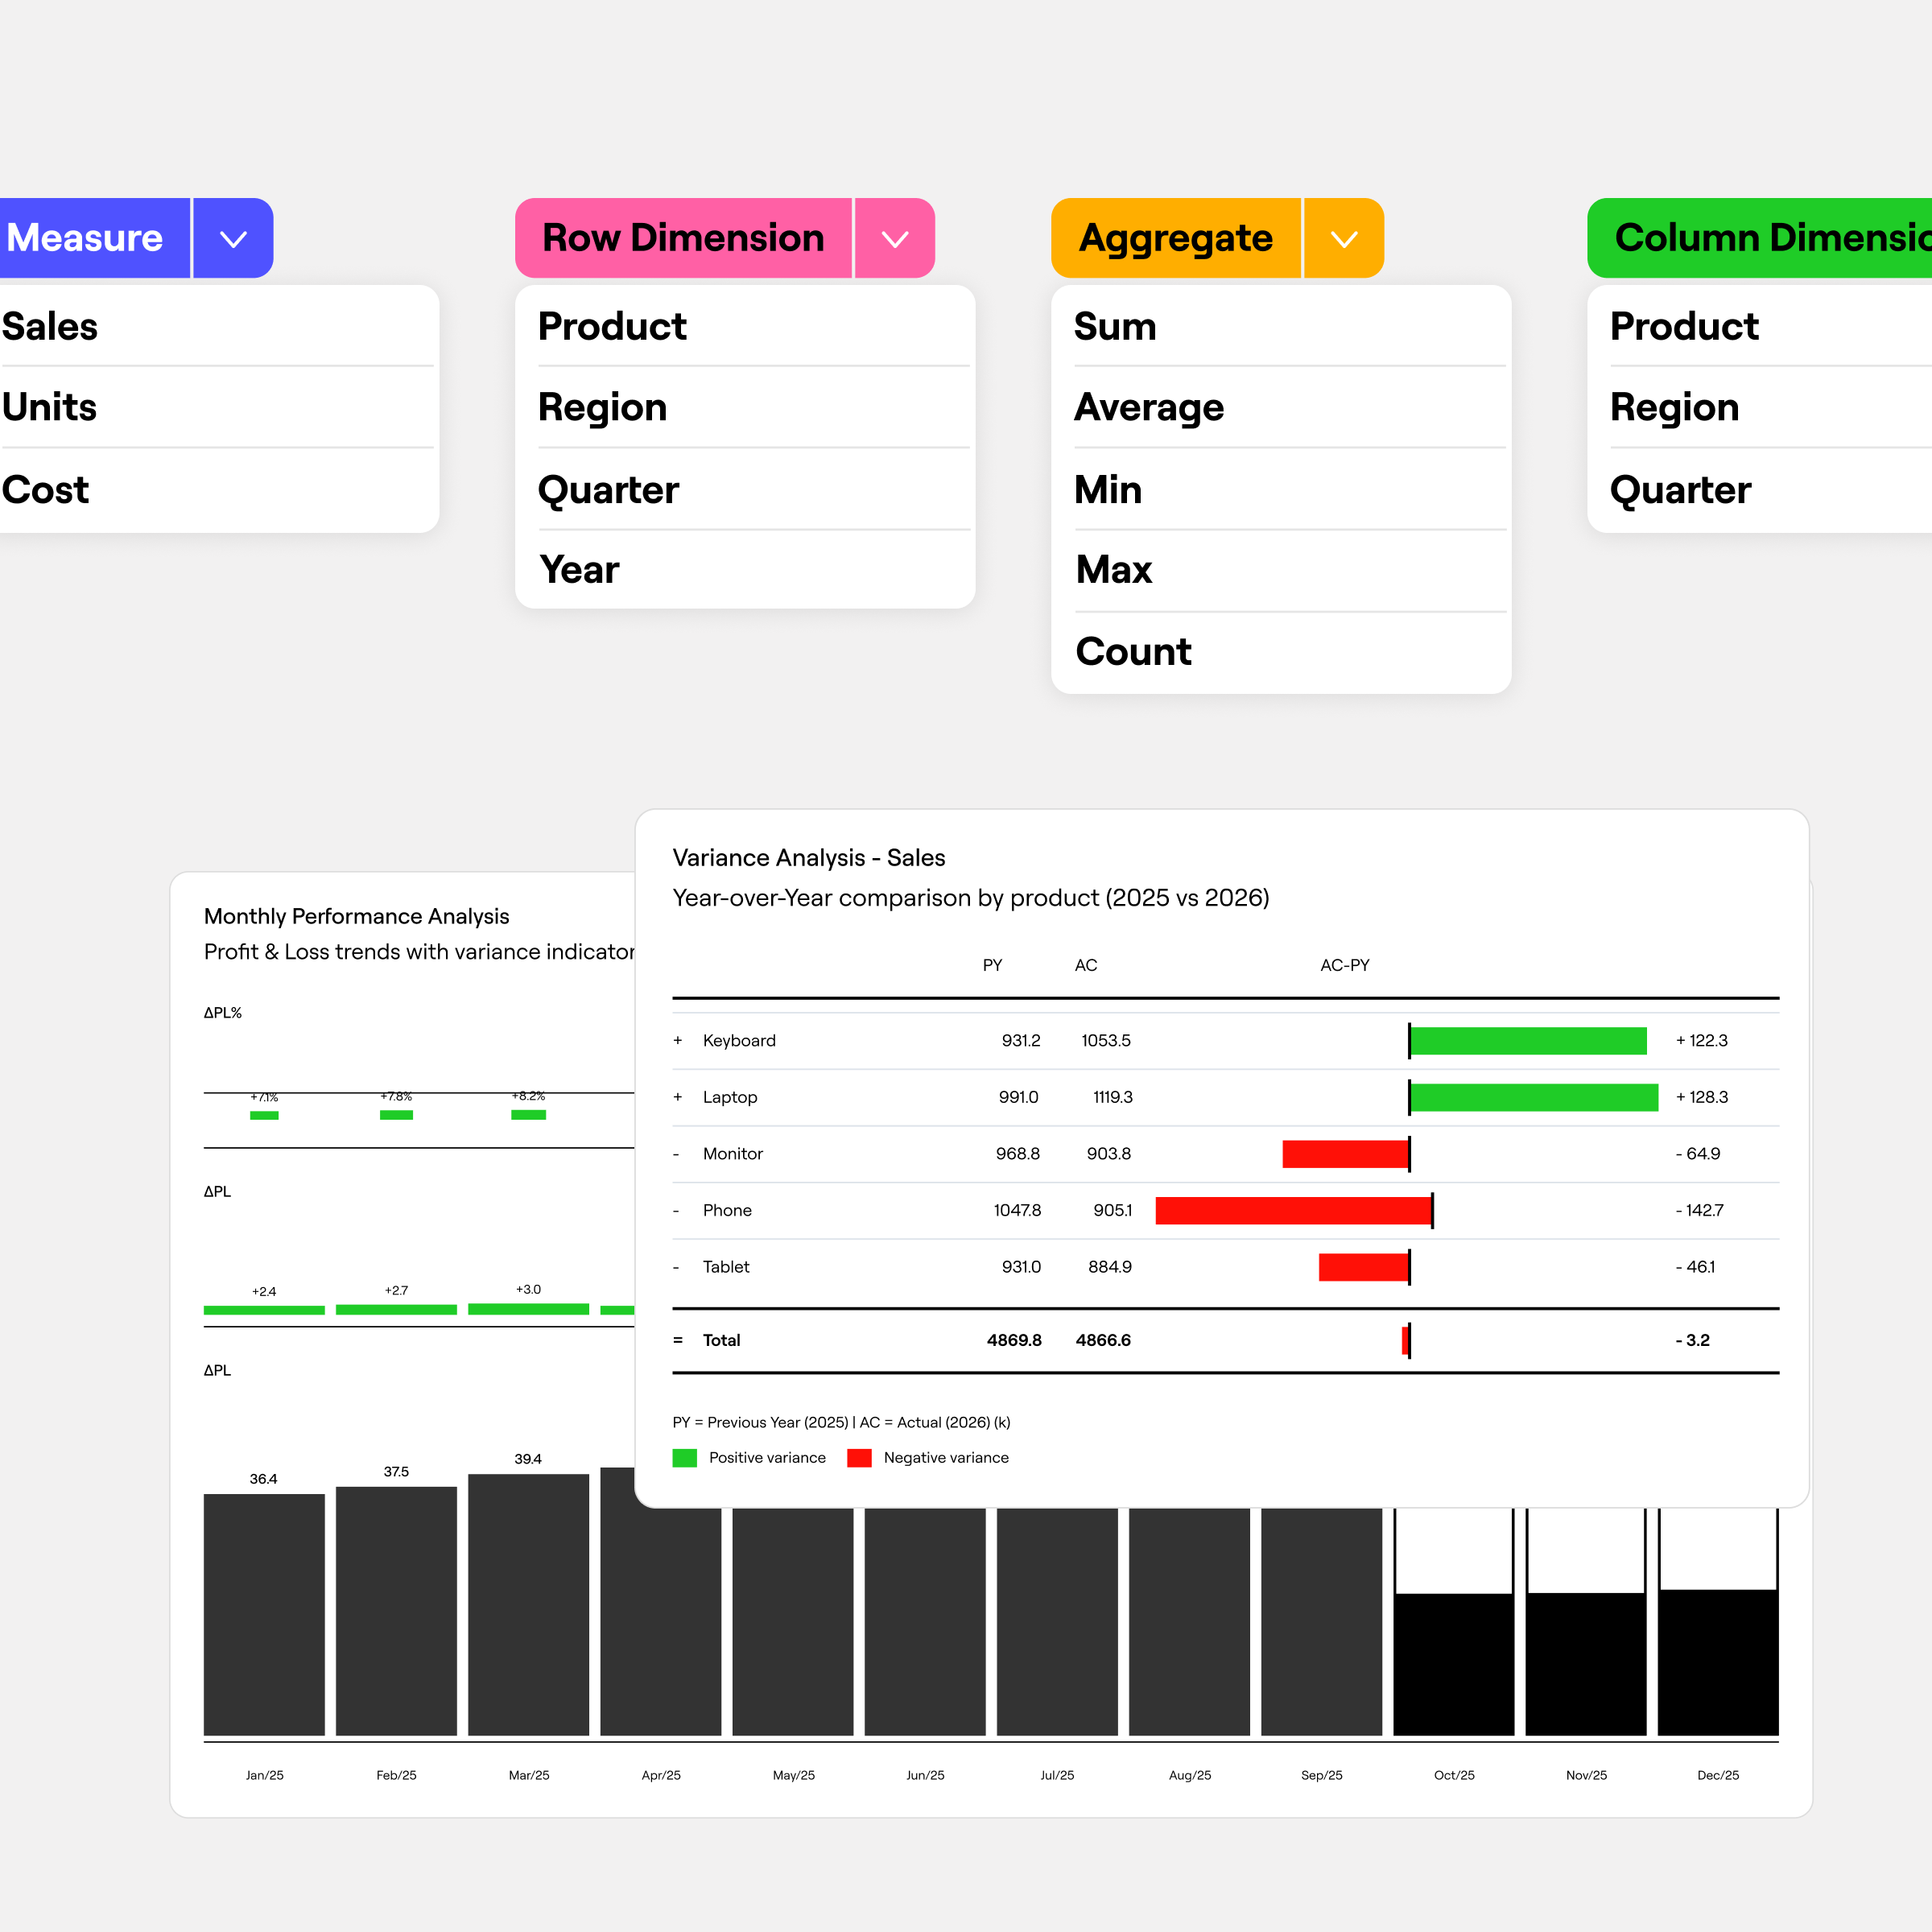
Headlines and commentary pull live values, period labels, and filter selections straight from the model.
Switch from Q2 to Q3 or from one retail chain to another and the words change with the charts. Page layouts look the same on every screen and when printed, so the dashboard becomes the board pack.
Quickly filter dashboards by entity, product, region, or custom dimensions.
Adjust filters and see results update immediately.
Explore performance across multiple business views in one dashboard.

“Farseer frees us from the grind of manual tasks, letting us focus on deeper, more impactful analyses.”
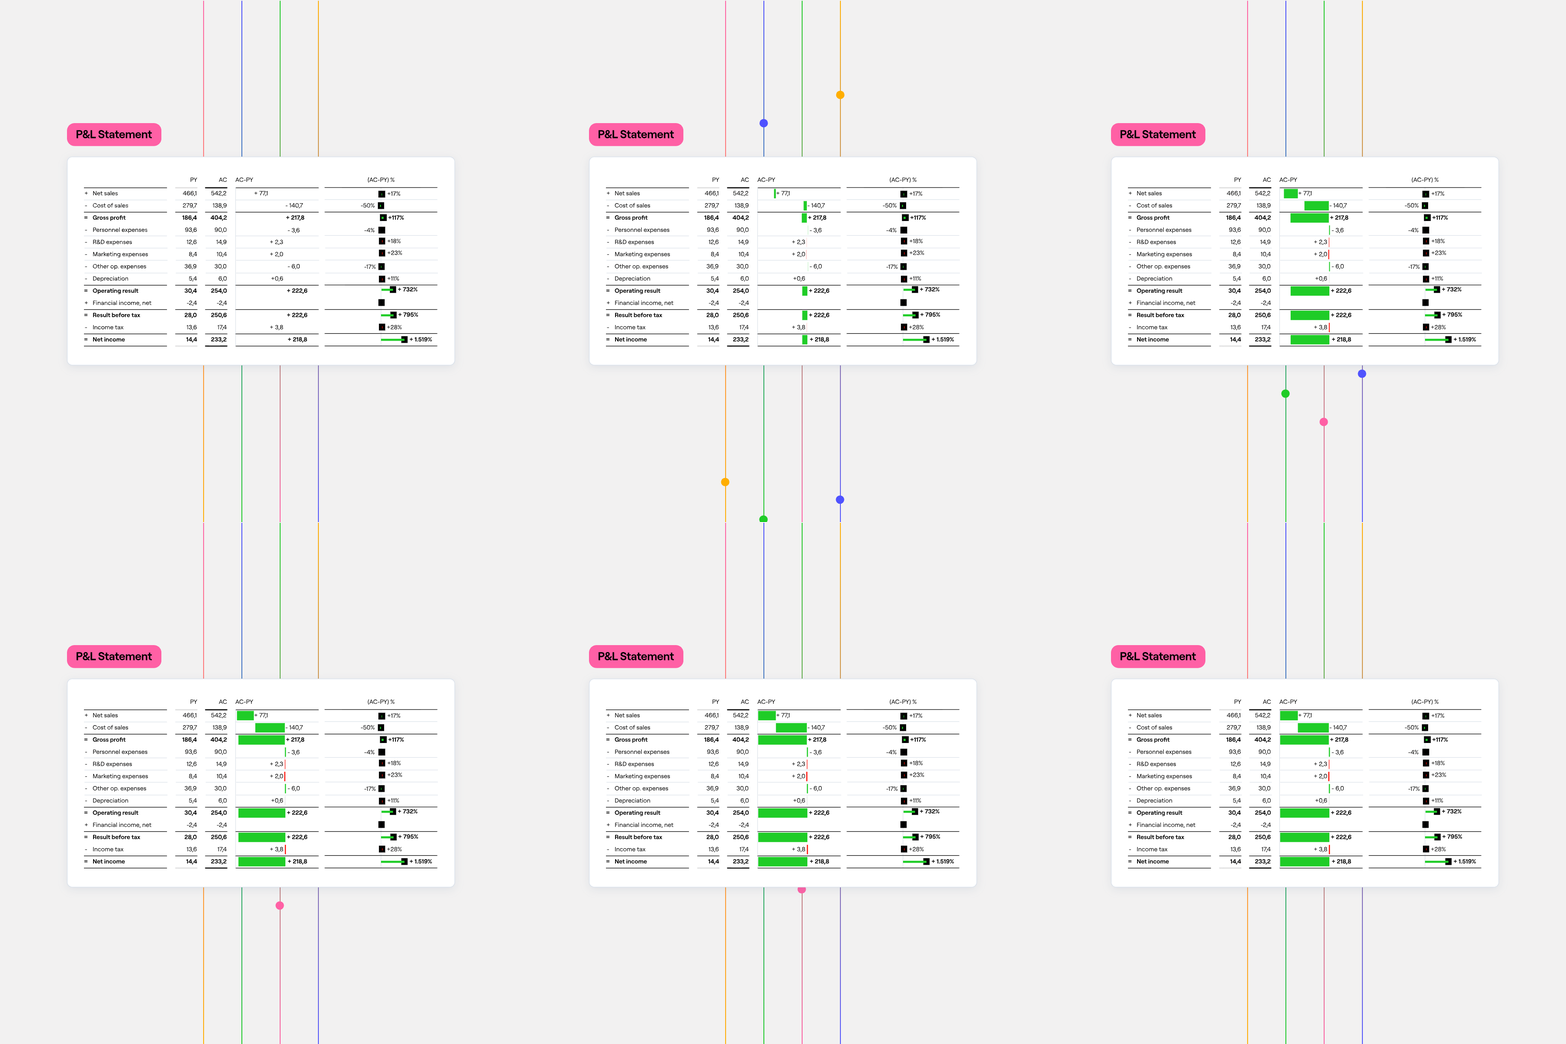
Farseer dashboards update automatically as soon as underlying numbers change in the model.
When new actuals arrive, assumptions shift, or forecasts update, dashboards reflect the changes instantly.
There’s no need to refresh reports, rebuild exports, or wait for the next reporting cycle.
Changes in the model appear in dashboards instantly.
New ERP or system data flows directly into dashboards.
Dashboards always reflect the latest financial calculations.
“With Farseer, we’re seeing results we can act on — with real-time insights at our fingertips.”
Talk to our solutions experts so they can build a customized demo for your organization.
Book a call"Farseer has been transformative for how we operate."

We review your data, processes and business goals to design the right setup.
We integrate your systems and structure your data in an isolated, ISO-certified environment.
Your team can budget, forecast and model scenarios in one connected platform.

“We saved significant time and shifted our focus from data preparation to analysis and decision-making.”
Talk to our solutions experts so they can build a customized demo for your organization.
Book a callFarseer provides interactive, real-time dashboards connected directly to your financial model. Users can explore KPIs, drill into variances, compare actuals against budget and forecast, and slice results by entity, region, product, or department — all without manually building or refreshing reports.
Farseer dashboards update automatically whenever underlying model data changes. When new actuals arrive, forecasts shift, or assumptions are revised, every connected dashboard reflects the changes instantly — eliminating manual exports, scheduled refreshes, and the reporting lag that causes teams to act on outdated information.
Yes. Every value in a Farseer dashboard is connected to the underlying financial model. Clicking any figure expands the data behind it, allowing users to drill from consolidated performance down to entity, account, product, or cost center level — without leaving the dashboard or rebuilding any reports.
All Farseer dashboards draw from a single financial model, meaning revenue, margin, and cost metrics are calculated using the same logic everywhere. This eliminates the conflicting KPI definitions that arise when teams build dashboards from separate data extracts, spreadsheets, or disconnected BI tools.
Farseer allows users to apply filters across entities, products, regions, departments, and time periods directly within a dashboard. Results update instantly as filters change, enabling multi-dimensional performance analysis without rebuilding reports — giving finance and business teams immediate clarity on what is driving results.