Accounts Payable Turnover Ratio: Formula, Benchmarks and How to Optimise It

The accounts payable turnover ratio can flag serious cash flow problems that are not visible in the P&L. A mid-sized manufacturing company noticed that despite growing sales, they were constantly short on cash. The reason was hidden in their payables process: the team was paying suppliers within 10 days of invoice receipt while their agreed terms were 45 days, and customer payments were taking the full 30-day window. They were providing 35 days of free credit to suppliers while simultaneously waiting 30 days to collect. The cash gap went unnoticed until it hurt operations.
The accounts payable turnover ratio is the metric that surfaces exactly this kind of issue. It measures how efficiently your business pays its suppliers, whether your payment practices align with your financial strategy, and where working capital is being left on the table.
Read more: Strategic Financial Planning That Actually Drives Results
What Is the Accounts Payable Turnover Ratio?
The accounts payable turnover ratio measures how many times a business pays off its accounts payable balance during a specific period. It evaluates whether payment practices are aligned with financial strategy. It is also called the payables turnover ratio or creditors turnover ratio.
Industries where supplier relationships and payment cycles directly impact operations, including FMCG, pharma, and manufacturing, find this ratio particularly useful because payment timing directly affects both liquidity and supply chain reliability.
Read: 9 Key Balance Sheet Ratios Every Finance Team Should Track (With Industry Benchmarks)

How to Calculate the Accounts Payable Turnover Ratio
Standard Formula
The most common calculation divides net credit purchases by average accounts payable during the period.
APTR = Net Credit Purchases / Average Accounts Payable
Average Accounts Payable = (Beginning AP Balance + Ending AP Balance) / 2
Example: Your business made $200,000 in credit purchases. AP started at $50,000 and ended at $70,000. Average AP = $60,000. APTR = $200,000 / $60,000 = 3.33. This means the business paid off its accounts payable 3.33 times during the period.
Converting APTR to Days Payable Outstanding (DPO)
DPO converts the turnover ratio into an average number of days to pay suppliers, which is often more intuitive for cash flow planning.
Read: How to Perform Account Analysis: A Step-by-Step Guide for FP&A Teams
DPO = 365 / APTR
Example: APTR of 3.33 gives DPO = 365 / 3.33 = 110 days. This means the business takes approximately 110 days on average to pay its suppliers.
Alternative Formula Using COGS
If detailed credit purchase data is not tracked, COGS can substitute as the numerator.
APTR (COGS method) = Cost of Goods Sold / Average Accounts Payable
Example: COGS of $300,000 and average AP of $60,000 gives APTR = 5. This method works best in manufacturing and retail where most purchases are tied to production costs, but is less precise if total COGS does not closely match credit purchases.
What Does the Accounts Payable Turnover Ratio Tell You?
A high APTR means paying suppliers frequently. This can signal strong cash flow and good supplier relationships, but it may also mean missing the opportunity to hold cash longer within the agreed payment terms.
A low APTR suggests taking longer to pay. This can be a deliberate strategy to conserve cash, or it can signal financial pressure or payment delays. The distinction matters: strategic DPO extension is healthy; late payment is a supplier relationship and credit risk problem.
Neither high nor low is universally good. The right ratio is the one that aligns with your industry norms, your supplier agreements, and your cash flow strategy.
Industry Benchmarks: APTR and DPO by Sector
Comparing your ratio to industry benchmarks is essential for meaningful interpretation. What is normal in retail is very different from what is normal in construction or pharmaceuticals.
| Industry | Typical APTR | Typical DPO (days) | Context |
| Retail / FMCG | 8-12 | 30-45 | Fast inventory cycles; suppliers expect prompt payment |
| Manufacturing | 4-7 | 52-91 | Longer production cycles; more flexible payment terms |
| Technology / SaaS | 6-10 | 37-61 | Service-based; fewer physical goods; mixed terms |
| Healthcare | 5-9 | 41-73 | Regulated procurement; longer approval cycles |
| Pharmaceuticals | 4-8 | 46-91 | Complex supply chains; extended terms common |
| Construction | 2-4 | 91-182 | Long project cycles; extended payment norms |
| Logistics / Transport | 5-9 | 41-73 | High operational costs; moderate payment cycles |
| Food & Beverage | 8-12 | 30-45 | Similar to retail; fast-moving perishable supply |
| Energy / Utilities | 3-6 | 61-122 | Capital-intensive; long supplier payment terms |
| Professional Services | 6-10 | 37-61 | Low COGS; primarily labour costs |
| Financial Services | 8-12 | 30-45 | Regulatory requirements; timely payment culture |
| Telecommunications | 4-7 | 52-91 | High infrastructure cost; extended payment norms |
| Real Estate | 2-4 | 91-182 | Long development cycles; extended payment terms |
| Wholesale / Distribution | 6-10 | 37-61 | Volume purchasing; negotiated extended terms |
| Automotive | 4-7 | 52-91 | Complex supply chains; JIT purchasing common |
Your APTR is only useful in context. Compare it to your industry, to your own prior periods, and to the specific payment terms in your supplier agreements. Seasonal changes, supply chain disruptions, and strategic term renegotiations all affect the ratio in ways that broad benchmarks cannot capture.
APTR and the Cash Conversion Cycle
The accounts payable turnover ratio connects directly to the Cash Conversion Cycle (CCC), which measures the net number of days between paying for inventory and collecting cash from customers.
CCC = DIO + DSO – DPO
Where DIO is Days Inventory Outstanding, DSO is Days Sales Outstanding, and DPO is Days Payable Outstanding.
Extending DPO reduces the Cash Conversion Cycle, preserving cash for longer. A company with DSO of 45 days, DIO of 30 days, and DPO of 60 days has a CCC of 15 days, meaning it holds cash from operations for 15 days before paying it out. The same company with DPO of 35 days has a CCC of 40 days, meaning it must fund 40 days of operations from reserves or credit.
AP Turnover vs AR Turnover: The Working Capital Relationship
Accounts payable turnover and accounts receivable turnover are the two sides of the working capital equation. AP turnover measures how quickly you pay suppliers. AR turnover measures how quickly customers pay you.
| Metric | Formula | What it measures | Typical objective |
| AP Turnover | Net Credit Purchases / Average AP | Speed of paying suppliers | Lower ratio = longer DPO = more cash retained |
| AR Turnover | Net Credit Sales / Average AR | Speed of collecting from customers | Higher ratio = shorter DSO = faster cash collection |
| Cash gap implication | When DSO > DPO: | You pay before you collect | Funding gap must be covered by reserves or credit |
The ideal working capital position is to collect from customers faster than you pay suppliers: AR turnover should be higher than AP turnover (DSO shorter than DPO). If your DPO is 30 days but your DSO is 45 days, you are paying suppliers 15 days before you receive customer payments, creating a cash gap that must be funded from elsewhere.
How to Optimise Your Accounts Payable Turnover Ratio
When Your APTR Is Too High (Paying Too Quickly)
The manufacturing company from the opening example had exactly this problem. They were paying within 10 days when their agreed terms were 45 days. By paying 35 days early, they were effectively providing free credit to suppliers while their own customers took the full 30-day payment window.
The solution was not to strain supplier relationships. It was to align payment timing with agreed terms. Three practical steps:
- Review payment terms for each major supplier and confirm whether actual payment timing matches the contracted terms.
- Implement a payment scheduling process that releases payments on day 42-44 rather than day 7-10 for 45-day term suppliers.
- Redirect the cash previously released early toward reducing other current liabilities or short-term working capital needs.
After implementing term-aligned payment scheduling, the manufacturer’s DPO increased from 10 days to 42 days on the affected supplier portfolio, freeing several weeks of cash without any change to supplier terms or relationships.
When Your APTR Is Too Low (Paying Too Slowly)
A declining APTR can be a deliberate strategy to conserve cash, or it can signal payment delays caused by cash flow pressure or process inefficiency. Before concluding it is strategic, verify whether payments are being made within agreed terms or past them.
Late payments are not DPO optimisation. They damage supplier relationships, may trigger late payment clauses or interest charges, and risk supply disruption. True DPO optimisation means negotiating extended terms openly with suppliers and paying within those extended terms consistently.
Read: Levered vs. Unlevered Free Cash Flow: Formulas, Differences, and Use Cases
The Early Payment Discount Trade-off
Many suppliers offer early payment discounts, typically 2% for payment within 10 days instead of the standard 30 days (written as 2/10 net 30). Taking the discount increases APTR and reduces DPO. Whether it is worth doing depends on the annualised cost of not taking the discount.
Annualised cost = (Discount % / (1 – Discount %)) x (365 / (Payment period – Discount period))
For a 2/10 net 30 discount: (0.02 / 0.98) x (365 / 20) = 2.04% x 18.25 = 37.2% annualised.
Forgoing this discount is equivalent to borrowing money at 37.2% per year. If the company’s cost of capital or the return it can generate on that cash over 20 days is below 37.2%, taking the discount is financially optimal in almost all cases. Only businesses with highly productive short-term cash deployment or those in acute cash constraint should routinely forgo 2/10 net 30 discounts.
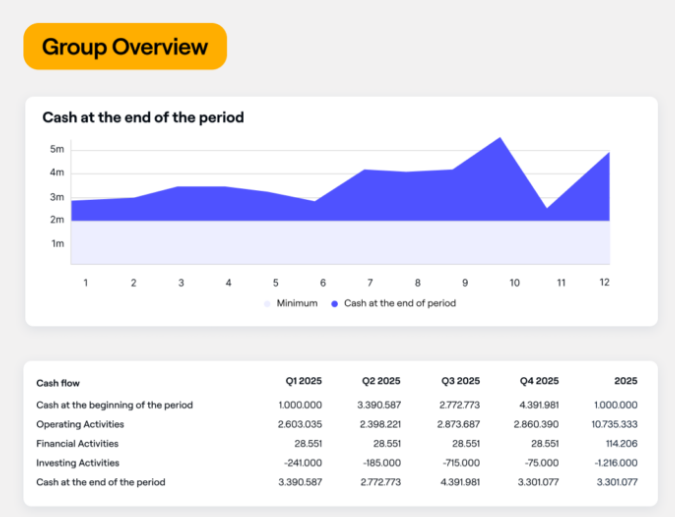
Farseer: Managing APTR strategically requires knowing your DPO by supplier, how your payables timing aligns with your cash inflows, and what the cash position looks like if payment timing shifts. In Excel, this means building a manual payables analysis each month from AP aging reports and supplier data. Farseer’s Cash Flow Forecasting solution connects AP data directly to the 13-week cash flow model, so the timing of supplier payments is visible alongside customer receipts, payroll, and other outflows. When the manufacturer in the opening example asked what the cash position would look like if they held payments to day 42 instead of day 10, that scenario ran in Farseer in real time.
What the Accounts Payable Turnover Ratio Will Not Tell You
- Supplier term differences: A construction company with 180-day terms and a retailer with 30-day terms cannot be compared on raw APTR without adjusting for their contractual payment frameworks.
- Seasonal fluctuations: A retailer’s APTR may drop significantly in slower months when fewer purchases are made, not because payment behaviour has changed but because purchase volume has.
- Non-standard transactions: Cash purchases, barter arrangements, and intercompany transactions do not appear in the ratio, which can skew results for businesses that rely on these methods.
- Payment timeliness: A high ratio might look good but could conceal payments made a few days late on each invoice. The ratio measures frequency, not compliance with agreed terms.
- Uniform supplier terms: The ratio assumes all suppliers offer the same payment terms. In practice, terms vary by supplier, volume, and relationship stage. A blended ratio masks this variation.
- Overall financial health: A low APTR might mean strategic cash management or it might mean cash flow pressure. Without cash flow statement context, the ratio alone cannot distinguish the two.
To get a complete picture, combine APTR with DPO, the Cash Conversion Cycle, AR turnover (DSO), and liquidity ratios. Each answers a different question about the working capital position.
Conclusion
The accounts payable turnover ratio is a straightforward metric with significant strategic implications. Managed well, it preserves cash, strengthens supplier relationships, and gives the finance team the visibility to time payments intelligently. Managed poorly, whether by paying too early or extending beyond agreed terms, it either leaves working capital unrealised or damages the supply chain relationships the business depends on.
The ratio earns its full value when it is monitored alongside DSO, DIO, and the Cash Conversion Cycle; when it is benchmarked against industry norms and the company’s own agreed payment terms; and when it is connected to a cash flow model that shows what different payment strategies mean for the 13-week cash position.

Farseer: The accounts payable turnover ratio is most useful when connected to the full cash flow picture rather than monitored in isolation. A DPO that looks healthy in the AP ledger may be creating a cash gap when set against the DSO in the AR ledger and the inventory days in the balance sheet. Farseer’s three-statement planning model connects accounts payable to cash flow and P&L automatically. When payment terms change, the cash position updates instantly and the impact on current ratio, CCC, and working capital metrics flows through without a manual rebuild. If your team tracks APTR separately from its cash flow model, Farseer provides the infrastructure to connect them. Explore the platform at farseer.com.

FAQ
What is the accounts payable turnover ratio and why is it important?
The accounts payable turnover ratio measures how many times a business pays off its accounts payable balance during a specific period. It evaluates cash flow management, the efficiency of supplier payment practices, and working capital management. A high ratio signals frequent payment; a low ratio signals longer DPO. Both have strategic implications depending on the context.
What is a good accounts payable turnover ratio?
There is no universal good ratio. It depends on industry, company strategy, and supplier payment terms. Retail businesses typically operate with ratios of 8-12 (DPO of 30-45 days). Manufacturers typically maintain ratios of 4-7 (DPO of 52-91 days). The right ratio is one that balances cash conservation, supplier relationship health, and the financial cost of early or late payment relative to your specific agreed terms.
How do you calculate the accounts payable turnover ratio?
Standard formula: APTR = Net Credit Purchases / Average Accounts Payable. Average AP = (Beginning AP + Ending AP) / 2. Alternative using COGS: APTR = COGS / Average Accounts Payable. To convert to DPO: DPO = 365 / APTR.
What does a high or low accounts payable turnover ratio mean?
A high ratio means paying suppliers frequently, which may signal strong cash flow but could also mean missing opportunities to hold cash within agreed payment terms. A low ratio suggests taking longer to pay, which can be a deliberate DPO strategy or may indicate payment delays. The critical distinction is whether the ratio reflects strategic term management or payments being made outside agreed timeframes.
Should I take an early payment discount or maximise DPO?
Calculate the annualised cost of forgoing the discount. For a standard 2/10 net 30 discount, the annualised cost of not taking it is approximately 37.2%. If your cost of capital is below this, taking the discount is almost always optimal. Only businesses with highly productive short-term cash deployment or those in acute cash constraint should routinely forgo early payment discounts.
What is the difference between AP turnover and AR turnover?
AP turnover measures how quickly you pay suppliers; AR turnover measures how quickly customers pay you. The relationship determines your working capital cash gap. Ideally, AR turnover is higher than AP turnover (you collect faster than you pay). If your DPO is shorter than your DSO, you are paying suppliers before collecting from customers, creating a funding gap that must be covered by reserves or credit.
What are the limitations of the accounts payable turnover ratio?
Six main limitations: it does not account for differences in supplier payment terms; seasonal purchase volume fluctuations affect the ratio independently of payment behaviour; non-standard transactions (cash, barter) are excluded; it measures payment frequency not payment timeliness; it assumes uniform terms across all suppliers; and a low ratio can indicate either strategic cash management or cash flow problems. The ratio alone cannot distinguish the two.

Financial Statement Analysis: The Complete Guide (With Step-by-Step Process)
Read more
Best Financial Analysis Tools in 2026: Compare Features & Pricing
Read more