How to Build a Revenue Model: A Step-by-Step Guide

We’ve all built that model. We’ve all inherited that model. And we’ve all spent a Friday afternoon trying to figure out why “Total Revenue” doesn’t tie to the sum of its parts.
Here’s the truth. A revenue model isn’t really about the numbers. It’s about structure. Get the structure right and the numbers practically fill themselves in. Get it wrong and you’ll spend the rest of the quarter patching leaks.
So, in this article, we’re going to build a revenue model the right way. We’ll go from the ground up and talk through the thinking at each step.
We’ll keep it concrete by imagining the simplest business on earth: a small corner store. Then, where it helps, we’ll look at how a purpose-built FP&A platform like Farseer handles each piece. That way you can see the difference between wrestling with a spreadsheet and working in a tool built for exactly this.
Let’s get into it.
Why revenue models break (and what good ones do differently)
Before we build anything, it’s worth being honest about why so many revenue models fall apart.
The usual culprit is that people start with the numbers. They open a blank sheet. They type in last year’s revenue. They slap a growth percentage on it and call it a forecast. That works right up until someone asks a real question. Something like, “What happens to revenue if we raise prices 5% on the food category but volume drops 3%?” Suddenly the single-cell growth assumption has nothing useful to say.
A good revenue model answers questions like that instantly. It can do this because it’s built from the drivers that actually move revenue. At the most fundamental level, revenue is almost always some version of:
Revenue = Price × Quantity
Everything else is a variation on that theme. A SaaS business swaps in customers × average contract value. A consultancy uses billable hours × rate. A retailer uses units sold × unit price, often sliced by product and category. The shape changes. The logic doesn’t. You model the things that drive the outcome. Then you let the outcome calculate itself.
The second thing good models do differently is keep three concepts apart. Messy models jam them together:
- The business structure. What products, categories, regions, or segments exist.
- The numbers. The prices, quantities, and rates attached to that structure.
- The views. The reports and analyses you build on top of both.
When these three live in one undifferentiated grid of cells, every change is risky. When they’re cleanly separated, the model becomes something you can actually scale. Hold on to that idea. It’s the backbone of everything that follows.
Read: Financial Reporting Automation – What It Actually Fixes (And Doesn’t)
Step 1: Define the business structure before you touch a single number
Here’s the discipline that separates a robust model from a fragile one. Don’t enter any numbers until the structure is in place.
I know that’s hard. The instinct is always to start typing values. But think about what a number means without context. The figure “4” tells you nothing. “The price of bread is 4” tells you everything. The context is what makes the number useful. We’re talking about bread, price, this month, this plan version. So, we build the context first.
For our small store, the structure is a list of products and the categories they belong to. Let’s say we stock around a dozen items: Chips, Bread, Chocolate, Water, Juice, Soda, Cigarettes, Newspaper, Magazine, Chewing Gum.
The exact items don’t matter. What matters is that they group naturally into a handful of categories. Think Food, Drinks, Press, Tobacco, and Other. That grouping is going to do a lot of analytical heavy lifting later.
In a spreadsheet, “defining structure” usually means typing these into column A. Then you hope you remember what column A represents.
The problem is that the spreadsheet has no idea that “Bread” is a product or that “Food” is a category. It’s just text. There’s no relationship the tool understands. So, every rollup, every grouping, every cross-tab is something you have to engineer and maintain by hand.
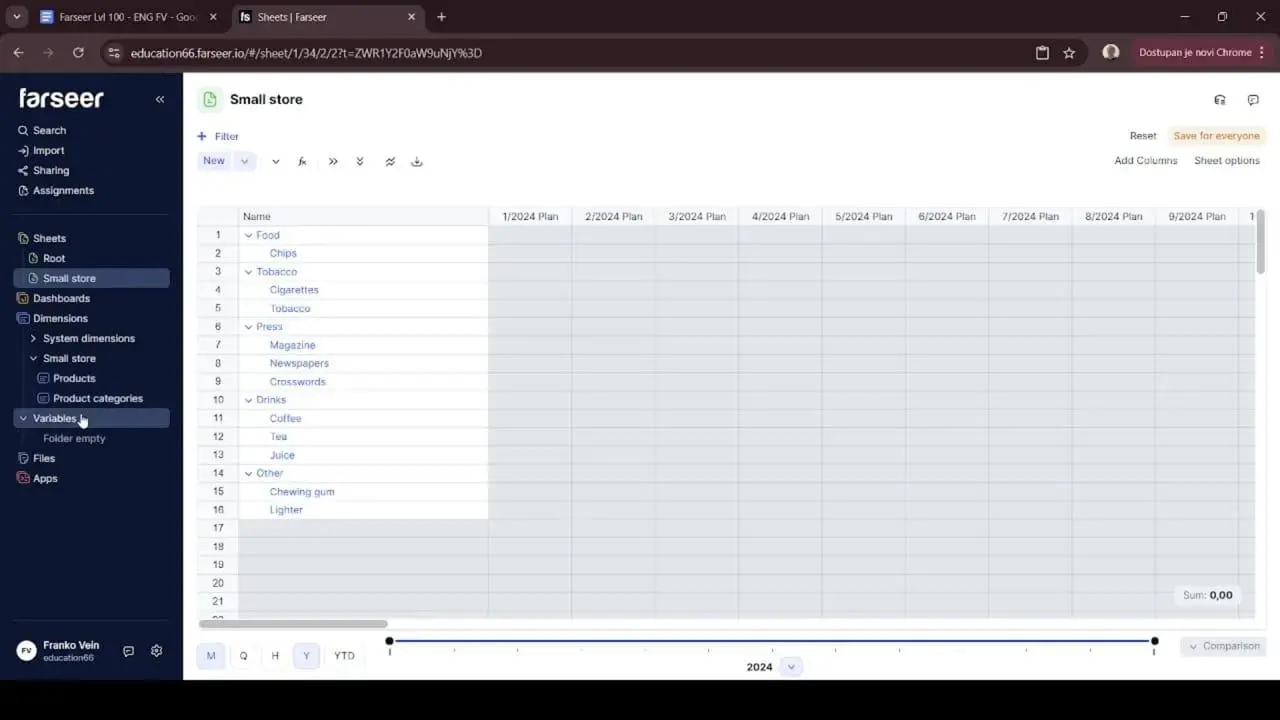
This is the first place a dedicated planning tool changes the game. In Farseer, structure isn’t an afterthought living in a column. It’s a first-class object. The left-hand sidebar tells you everything you need to know about the environment.
- Sheets are where you work.
- Dashboards are for visual reporting.
- Dimensions hold categorical data, like your list of products.
- Variables hold the numbers.

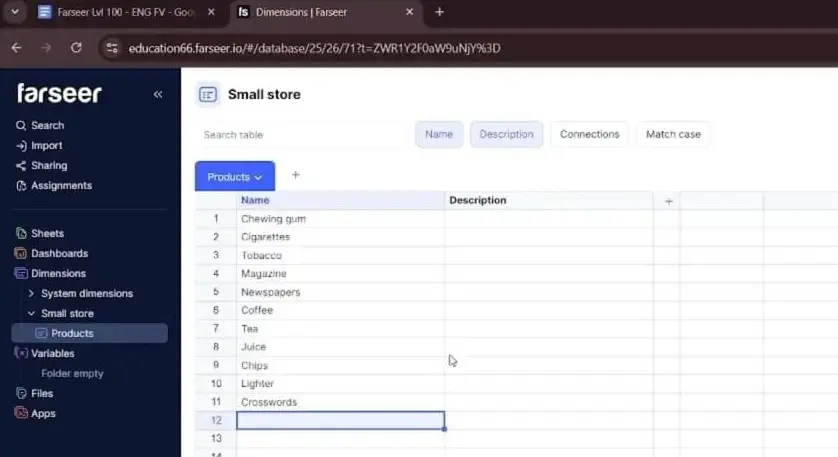
You’d create a folder (say, “Small Store”). Then you’d build a Products dimension and a Product Categories dimension inside it. The Products table is just a clean list of items, the same as you’d type into a spreadsheet, but the tool now genuinely knows these are the building blocks of your business. They aren’t just labels in a grid.
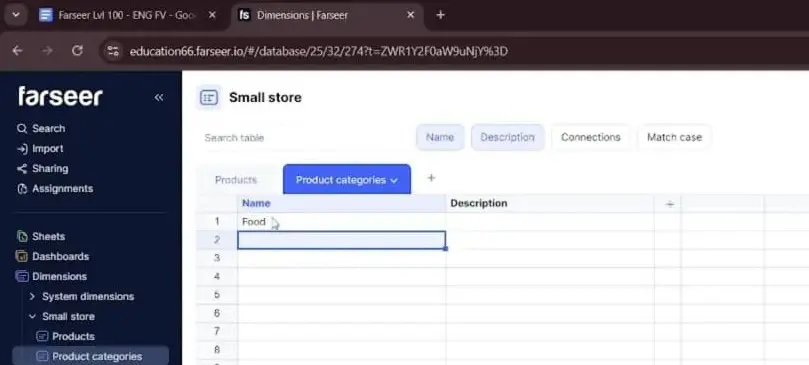
Then you do the same for categories. A second dimension, Product Categories, gets its own simple list: Food, Drinks, Press, Tobacco, Other.
That distinction sounds subtle. It turns out to be everything.
Step 2: Build the hierarchy that connects the pieces
A flat list of products is fine. A flat list of categories is fine. But a revenue model gets its power from the relationship between them. That means knowing that Chips, Bread, and Chocolate roll up into Food, while Water, Juice, and Soda roll up into Drinks.
This parent-child relationship is what lets you answer questions at different altitudes. Sometimes leadership wants to know revenue by individual SKU. More often they want it by category, by region, or by channel. If your model understands the hierarchy, you can zoom in and out effortlessly. If it doesn’t, you’re rebuilding pivot tables every time someone changes the question.
Read: Top-Down vs Bottom-Up Forecasting in Demand Planning: Pros, Cons and How to Choose
So, our mapping looks like this:
- Chips, Bread, Chocolate → Food
- Water, Juice, Soda → Drinks
- Newspaper, Magazine → Press
- Cigarettes → Tobacco
- Chewing gum and other bits → Other
In Excel, you’d express this with a category column next to each product. Then you’d lean on SUMIF or a pivot table to aggregate. It works. But the relationship only exists inside your formulas. Break a formula or insert a row in the wrong place, and the hierarchy quietly breaks with it.
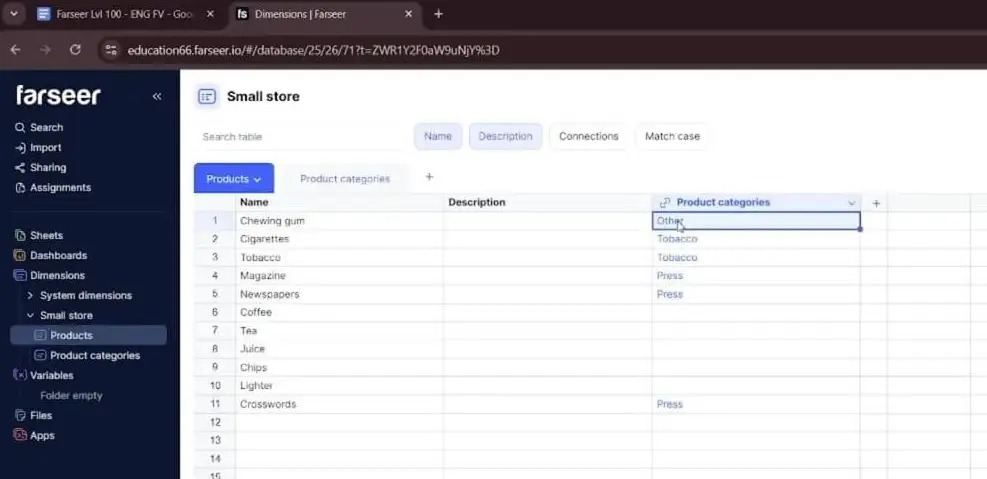
In a dedicated planning tool, you connect the two dimensions directly. You assign each product to its parent category as a defined relationship, not a lookup formula. In Farseer, the Products table gets a Product Categories column, and you fill in each product’s parent category by clicking or typing the value. The relationship is now part of the model itself.
Now you can drop both onto a worksheet. Place the higher level (Product Categories) first. Then nest Products beneath it. Expand a category, and you watch its products fan out underneath.
It’s the difference between storing a list and actually building structure. And once that structure exists, every number you add later automatically knows where it belongs in the hierarchy. That’s a genuinely satisfying moment. It’s the payoff for resisting the urge to type numbers first.
Step 3: Now add the numbers, as drivers, not outputs
With structure in place, we can finally talk about numbers. But notice which numbers we add. Not revenue. We add the drivers of revenue, which are price and quantity. Then we let revenue calculate itself.
This is the single most important mindset shift in driver-based modeling. Revenue is an output. You should almost never type it directly. You type the things that cause it. If you hard-code revenue, you’ve thrown away your ability to ask “what if.” There’s nothing underneath to flex.
Read: How to Choose the Right Revenue Forecasting Model for Your Company
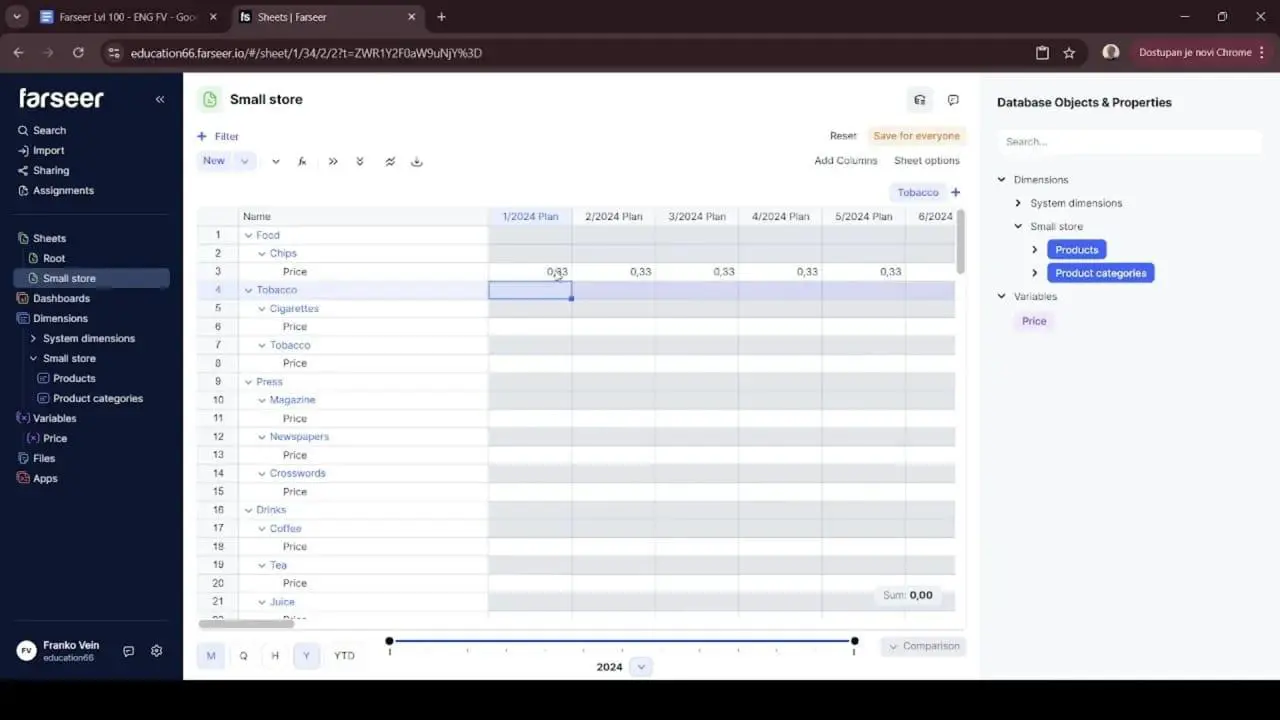
For the small store, the first driver is price. Each product has a price. Prices belong to products. That’s the connection. So, when we create our price data, it has to be tied to the Products dimension. Otherwise, the numbers are floating free with no business meaning.
In a purpose-built planning tool, numbers live in objects often called variables. A variable isn’t just a column of values. It’s a structure that stores numbers together with their dimensions. So, you’d create a “Price” variable and explicitly connect it to the Products dimension. That connection is what tells the system that this “4” is the price of this product, in this period, in this version. Until you make that connection, the cells stay locked. The tool literally won’t let you enter a number until it knows what that number refers to. The first time you hit that, it feels like friction. Then you realize what it’s doing. It’s protecting you from the exact kind of context-free data entry that turns spreadsheets into swamps.
Here’s the mental model to carry forward. Structure holds the meaning. Variables hold the values. And the two are joined at the hip.
Step 4: Get your rollup logic right (the lesson everyone learns the hard way)
This is the step that separates people who think they understand modeling from people who actually do. It’s also the source of more silent forecasting errors than almost anything else.
Here’s the trap. Different metrics behave differently when you move between time periods. Some metrics sum across time. Some average. Some take the last value. Get this wrong and your model will produce numbers that look plausible and are completely wrong.
Think about it with our two drivers:
- Quantity sums across time. If you sell 100 units in January and 100 in February, you sold 200 in Q1. Summing is correct.
- Price does not sum across time. If bread costs 4 in January and 4 in February, the price in Q1 is still 4. It is not 8. Price should average, or take a representative value. It should never sum.
Get this backwards and your annual price for bread shows up as 48 instead of 4. Your revenue inflates absurdly. Then you spend a morning hunting for the “bug” that’s actually just a rollup setting.
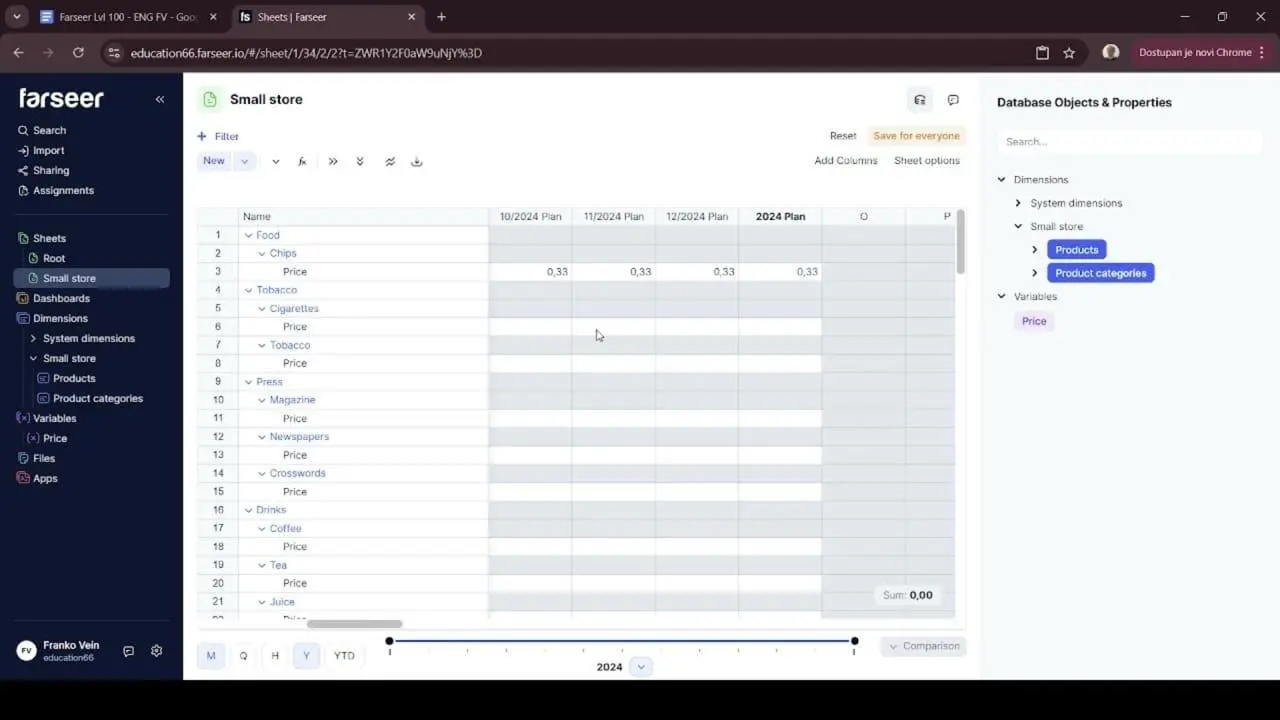
You can see this trap clearly in Farseer. Type “4” as a yearly price for Chips with the default sum rollup, and the tool dutifully spreads that 4 across all twelve months as 0.33 each. Sensible behaviour for a metric that sums. Disastrous for a price.
This is exactly where working in a real planning tool earns its keep. In Farseer, every variable has a rollup type you set deliberately. The fix is simple. You open the variable and change its rollup type so the yearly figure represents the average price rather than a sum. Once you do, entering “4” behaves exactly the way your business intuition expects. The price is 4 in every month and 4 for the year.

There’s a deeper point for FP&A here. The tool is forcing you to be explicit about something spreadsheets let you ignore. In Excel, a price column and a quantity column look identical. Nothing stops you from accidentally summing the wrong one. A platform that makes rollup behaviour a deliberate, visible setting is a platform that quietly prevents a whole class of errors before they reach the boardroom.
Make this a habit in every model you build. Before you enter a single value into a line, ask yourself one question. “Does this metric sum, average, or take the latest value over time?” Your future self, the one not debugging at 6pm, will thank you.
Step 5: Fill data fast by letting the structure do the work
Once your rollup logic is sound, data entry becomes dramatically simpler. You can enter values at a high level and let the model cascade them down.
This is a quiet productivity superpower. Picture typing a price into twelve monthly cells for each of a dozen products. That’s 144 cells of mind-numbing entry. Instead, you enter the yearly price once per product and the model populates the months for you. In our corner store example, a handful of yearly entries instantly fills well over a hundred underlying cells. That’s not just faster. It’s far less error-prone, because there are fewer places for a fat-fingered number to hide.
And because the rollup logic is correct, the model stays sensible even when reality gets messy. Suppose bread’s price rises from 4 to 6 halfway through the year. You don’t have to rebuild anything. You adjust the relevant periods. The annual figure simply reflects the new average price across the year. The model bends without breaking. That’s exactly what you want when assumptions inevitably change three days before the deadline.
The principle here is universal, tool or no tool. Build your model so that you input data at the level where decisions are actually made. Let the structure handle the granularity underneath. Decisions about pricing happen at the annual or quarterly level far more often than the monthly one. Your model should meet you where the thinking happens.
Step 6: Separate Plan from Actual, and move between them cleanly
Your model needs versions.
- A Plan version holds your assumptions.
- An Actual version holds reality.
Most mature FP&A teams also maintain Best Case, Base Case, and Worst-Case versions using the same structure.
You want to keep them in separate, comparable structures. That’s what makes variance analysis possible without copy-pasting columns around and praying the alignment holds.
Read: Scenario Planning or Sensitivity Analysis? A Practical Guide for Finance and FP&A Teams
In a spreadsheet, “versions” usually means a new tab and a duplicated block of cells. It also means a naming convention you’ll abandon by March. It’s workable. But it’s manual, and manual means fragile.
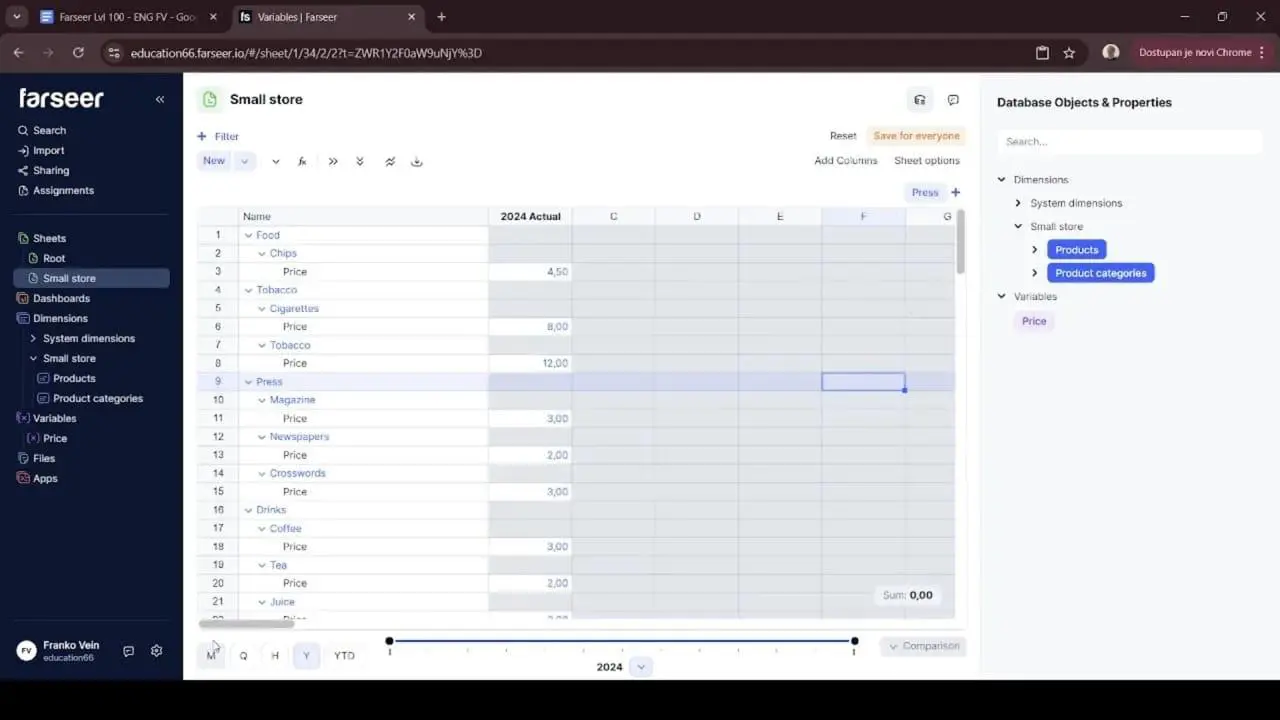
In Farseer, versioning is built in. Plan and Actual are first-class versions of the same model. The same product, the same price variable, and the same hierarchy exist in both. You can compare them directly. Once you’ve populated the 2024 Plan column, the Actual column sits right next to it, ready to be filled in.
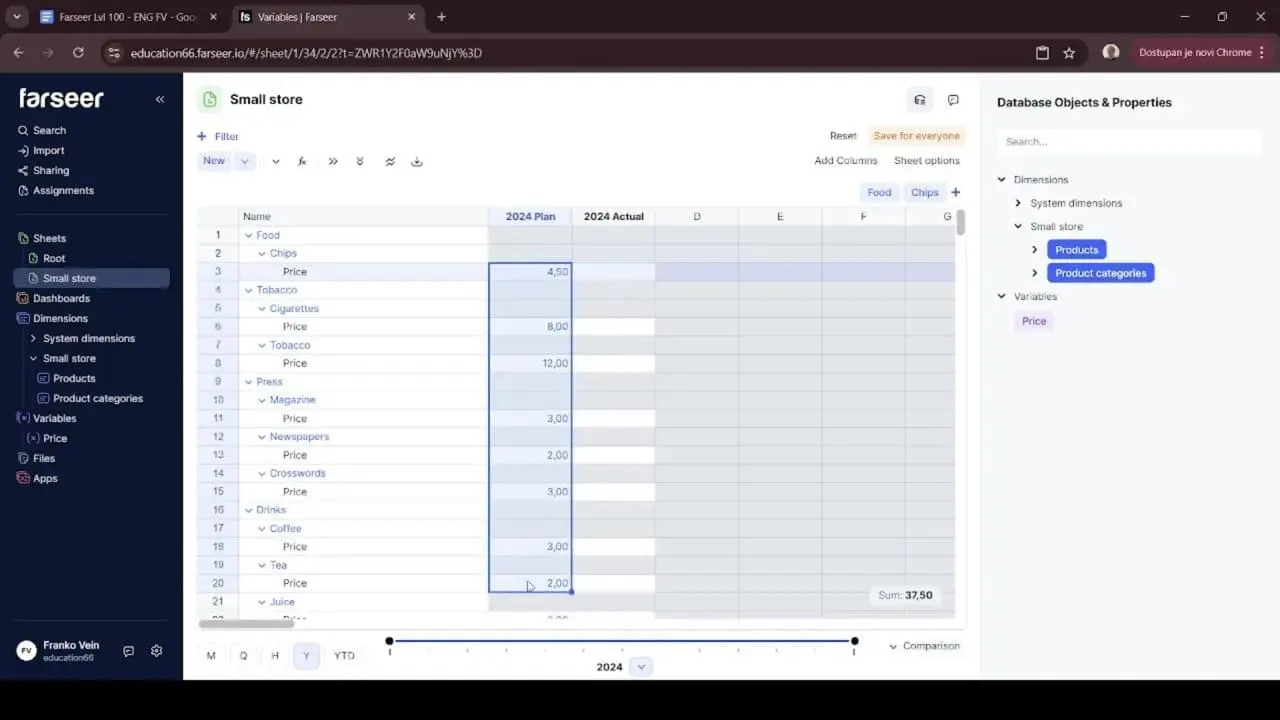
From here you’ve got options. You can simply copy the yearly Plan values and paste them into the Actual column. That’s quick and fine for a straight transfer. Or you can use a “Copy from” function. You right-click and pull directly from “2024 Plan.” This reproduces the structure and values so Actual starts as a faithful mirror of Plan. Then you overwrite it with real results as they land.
Having more than one way to move data between versions sounds like a small thing. In practice it’s the difference between a five-minute task and an afternoon of careful cell surgery.
Whatever tool you use, the principle stands. Design for Plan, Actual, and as many scenarios as you need from day one. Bolting versions later is painful. Building them in is effortless.
Step 7: Aggregate up the hierarchy for real analysis
Individual product data is important, but most business decisions are made at a higher level. Leadership rarely wants to discuss the price of every SKU. They want to understand how categories are performing. Questions such as “Are drink prices increasing?” or “Which category is driving revenue growth?” are typically answered at the category level rather than the product level.
This is where the hierarchy you built earlier becomes valuable. Because each product is already linked to a category, the model can automatically aggregate product-level data into category-level metrics.
In Farseer, you can assign variables such as Price to both the Product and Product Category levels. The platform automatically calculates category-level averages and summaries.
Instead of analysing dozens of individual products, you can immediately compare categories such as Food, Drinks, Press, and Tobacco. The model transforms detailed data into information that supports decision-making.
This is where a revenue model stops being a data-entry exercise and starts becoming a planning and analysis tool.
Read: Annual Recurring Revenue vs Revenue: How Each Metric Impacts Financial Forecasts
Common pitfalls to avoid
A few traps catch even experienced modelers. Here they are in one place so you can sidestep them.
- Hard-coding revenue. If you type revenue directly instead of deriving it from price and quantity, you’ve built a number, not a model. The moment someone asks a “what if,” you’re stuck. Always model the drivers.
- Ignoring rollup behaviour. The sum-versus-average mistake from Step 4 causes an embarrassing share of forecasting errors. Decide consciously how every metric behaves over time, every time.
- Skipping the hierarchy. Building a flat list because it’s faster today guarantees you’ll rebuild pivots forever. Twenty minutes spent on structure up front saves you hours every reporting cycle.
- Entering data at the wrong altitude. If you find yourself filling in hundreds of cells by hand, your model is making you work for it. It should work for you. Push inputs up to the level where decisions are made.
Treating versions as an afterthought. Plan, Actual, and scenarios should be designed in from the beginning. Retrofitting them is where models go to die.
Scaling beyond the Small store
We built a small store. But nothing here is specific to one. The exact same skeleton scales to a model of almost any size.
- A SaaS company swaps Products for Plans (Basic, Pro, Enterprise). Price becomes monthly contract value. Quantity becomes active subscriptions. Then you layer in churn and expansion as additional drivers.
- A manufacturer models units by product line and region, with price lists that genuinely do change mid-year.
- A services firm models headcount × utilization × billable rate, rolling up by practice and office.
In every case, the recipe is identical. Define the dimensions. Build the hierarchy. Attach driver variables with the right rollup behaviour. Separate Plan from Actual. Then aggregate up for analysis. The small store was never the point. The method was. Once the method is muscle memory, the size of the business is just a matter of how many products are in the list.
And this is where having the right environment stops being a nice-to-have. A ten-product corner store is forgiving. You can muddle through it in Excel. A thousand-SKU, multi-region, multi-scenario model is not. That’s the scale where the structure-first approach really matters. A platform like Farseer treats dimensions, hierarchies, variables, and versions as native objects. At that scale, that’s the difference between a model you trust and a model you fear. The discipline is the same at every size. The tooling is what lets the discipline survive contact with complexity.
Bringing it all together
If you take one idea away from this guide, make it this. A revenue model is a structure problem before it’s a numbers problem. Define what exists. Connect it into hierarchies. Attach the drivers that actually move revenue. Get your rollup logic honest. Only then start filling in values, at the level where real decisions happen.
Do that, and your model becomes something rare. It becomes a forecast you can interrogate. Say leadership asks what happens if drink prices rise 8% while volume slips 2%. You don’t reach for a fresh tab and a prayer. You change two driver assumptions. Then you watch the answer ripple cleanly through every level of the hierarchy. It flows across Plan and Actual, all the way up to the category view in the board pack.
That’s the whole promise of good FP&A. You turn a static spreadsheet into a living model that helps the business think. The small store was just our sandbox. The structure you learned in it is the same structure behind every revenue model worth building.
Now go build one properly.

FAQ
What is a revenue model?
A revenue model is a framework that explains how a business generates and forecasts revenue. A well-designed revenue model identifies the key revenue drivers, such as pricing, volume, customers, subscriptions, or billable hours, and uses them to project future performance.
How do you build a revenue model?
To build a revenue model, start by defining your business structure, identifying revenue drivers, creating product or customer hierarchies, and linking assumptions to financial outcomes. The best revenue models separate Plan, Actual, and Forecast data to support analysis and decision-making.
What is the formula for a revenue model?
The most common revenue model formula is: Revenue = Price × Quantity
However, different businesses use different revenue drivers. For example, SaaS companies may use Customers × Average Contract Value, while consulting firms use Billable Hours × Hourly Rate.
What is a driver-based revenue model?
A driver-based revenue model forecasts revenue using the operational factors that directly influence business performance. Instead of applying a blanket growth rate, it models drivers such as customer acquisition, churn, pricing, transactions, utilization, or sales volume.
What are the key components of a revenue forecasting model?
A revenue forecasting model typically includes products or services, pricing assumptions, sales volume, customer segments, revenue drivers, reporting hierarchies, time periods, and multiple planning versions such as Plan, Actual, and Forecast.
What is the difference between a revenue model and a revenue forecast?
A revenue model is the structure used to calculate future revenue. A revenue forecast is the output generated by that model. In FP&A, the revenue model provides the logic, while the revenue forecast provides the projected results.
How do FP&A teams build revenue forecasting models?
FP&A teams build revenue forecasting models by identifying business drivers, linking operational metrics to financial outcomes, incorporating assumptions, and creating scenarios that support budgeting, forecasting, and strategic planning.
What are the most common revenue modeling mistakes?
Common revenue modeling mistakes include hard-coding revenue, ignoring driver relationships, using incorrect rollup logic, failing to create hierarchies, and not separating Plan, Actual, and Forecast versions. These issues can reduce forecast accuracy and limit scenario analysis.
What software is used for revenue modeling and revenue forecasting?
Many companies start with Excel for revenue modeling. As complexity increases, organizations often use dedicated FP&A software such as Farseer, Anaplan, Jedox, Pigment, or Adaptive Planning to support driver-based forecasting, scenario planning, and revenue analysis.
How can businesses improve revenue forecast accuracy?
Businesses can improve revenue forecast accuracy by using a driver-based revenue model, updating assumptions regularly, tracking forecast performance, maintaining clean data structures, and running multiple scenarios to understand potential outcomes before decisions are made.

Budget Forecasting Methods: 6 Approaches Every CFO Should Know (And How to Choose)
Read more
Strategic Financial Planning That Actually Drives Results
Read more