10 Management Reporting Data Terms: The FP&A Guide

If you have spent years living inside spreadsheets, you probably know your way around a SUMIFS, a pivot table, and a stubborn circular reference at 11pm during the month-end close.
Then one day, someone from IT joins the call. Or a software vendor starts a demo. Suddenly, the room fills up with words like “cube,” “leaf,” “grain,” “OLAP,” and “writeback.”
You nod along. You make a note to look it up later.
Later never comes.
Sound familiar? You are not alone.
Most FP&A professionals learn the numbers side of the job brilliantly and pick up the data side simply through exposure. That works fine until you start evaluating a planning tool, scoping a new data model, or trying to explain to a stakeholder why the system rolls up the way it does.
Read more: What Great Financial Reporting and Analytics Actually Look Like
The good news is that none of this is as complicated as it sounds. The jargon comes from the database and BI world, but every single term maps onto something you already do in Excel. Once you see the translation, it clicks.
This article walks through ten core management reporting data terms in plain English. No data science degree required. For each one, you get a simple definition, an FP&A example, and a quick note on why it actually matters to your work.
Let us get into it.
1. Dimensions
A dimension is simply a way of slicing your data. Think of it as a category or an attribute you want to view your numbers by.
Time is a dimension. Product is a dimension. Region, Department, Cost Centre, Customer, Scenario, and Account are all dimensions too.
The easiest way to spot a dimension is to listen for the word “by.”
Revenue “by” region. Headcount “by” department. Spend “by” cost centre. Margin “by” product line. Whatever comes after “by” is almost always a dimension.
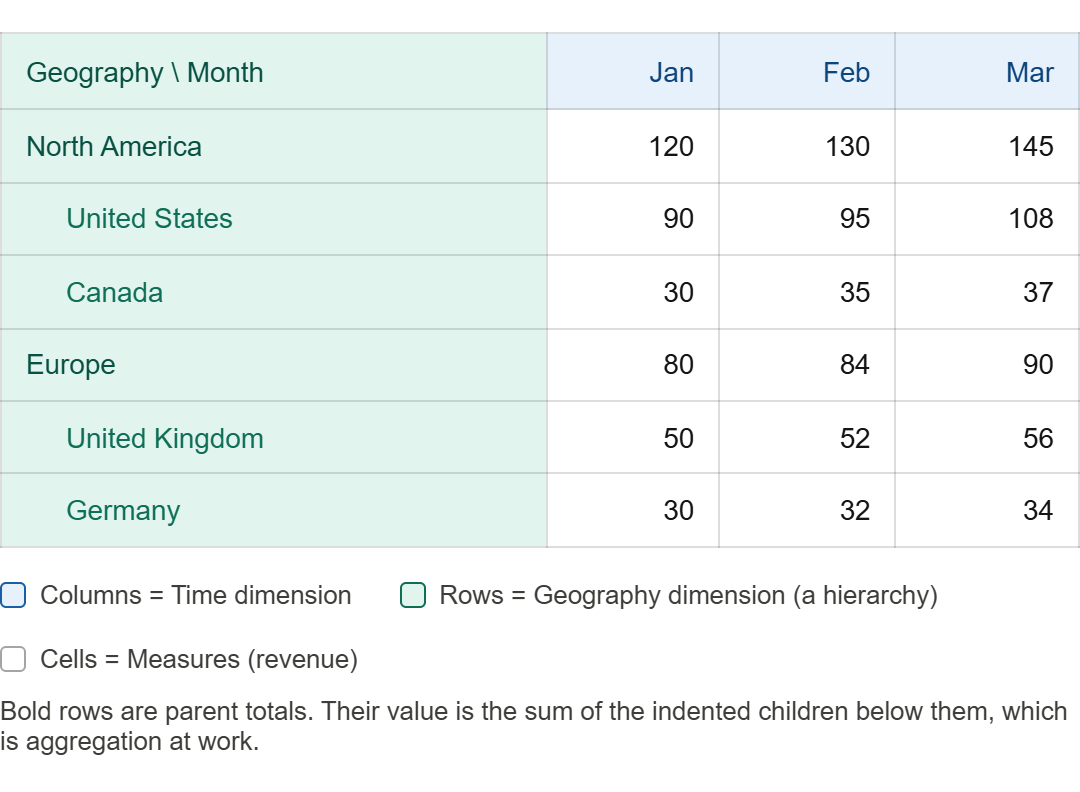
In a spreadsheet, your dimensions usually show up as the row labels and column headers around the edge of a pivot table. Months across the top, products down the side. Those edges are your dimensions.
Here is why dimensions matter. The way you define them decides what questions you can answer later. If you never set up a “Channel” dimension, you can never split revenue by online versus retail without rebuilding the whole thing. Good FP&A models think about dimensions up front, before a single number goes in.
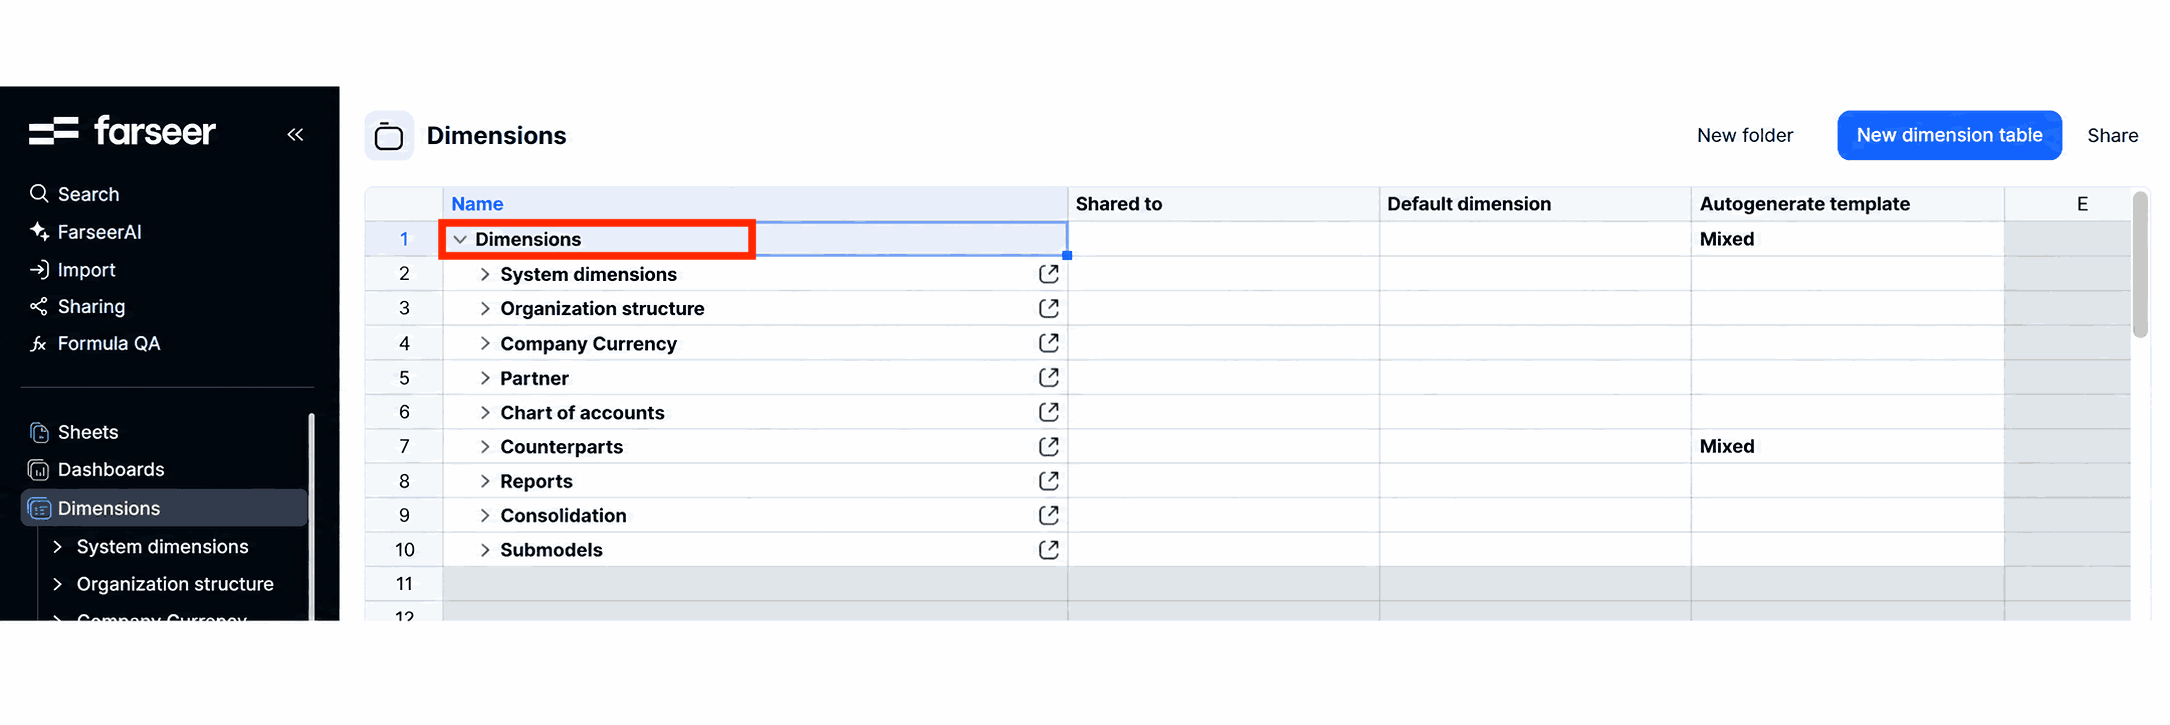
Modern planning tools make this very visible.
Read: The 7 Core Components of a Financial Model Every FP&A Professional Should Master
In Farseer, for example, Dimensions sit right there in the sidebar as a core object you manage on purpose. You define them once, and every report, dashboard, and forecast then uses the same agreed structure. That single shared definition is what stops two analysts pulling “regional revenue” and getting two different answers.
2. Measures
If dimensions tell you how to slice the data, measures tell you what to count.
A measure is the actual number you are reporting. Revenue is a measure. Cost is a measure. Headcount, units sold, gross margin, cash balance, and operating expense are all measures. These are the values that fill the inside of your table, not the labels around the edge.
Read: What Is Margin Analysis and How to Conduct It Step by Step
Quick test. Look at any management report. The dimensions are the things you read along the top and down the side. The measures are the numbers sitting in the cells in the middle. Revenue of 4.2 million for the North region in March is a measure value, sliced by two dimensions (Region and Time).
There is one nuance worth knowing, because it trips people up. Measures come in three types, and the system needs to know which is which.
Additive measures sum cleanly in every direction. Revenue is the classic one. Add January, February, and March and you get a sensible quarter. Add the regions and you get the company total. Cost, units sold, and order count behave the same way.
Semi-additive measures sum across some dimensions but not across time. A closing cash balance is the obvious example. You can add the balances of three entities to get a group balance. But you cannot add three monthly closing balances to get a quarter figure. For time, you take the last value in the period instead. Headcount and inventory behave the same way.
Non-additive measures cannot be summed in any direction at all. A margin percentage is the classic case. You cannot add three monthly margin percentages and get the quarterly margin. The only correct way is to recalculate it at the higher level, from the aggregated revenue and aggregated cost beneath it.
Why this matters for FP&A. A huge number of reporting errors come from a measure being aggregated the wrong way. A ratio that gets summed instead of recalculated. A headcount that gets added across months instead of taken as an end-of-period figure. Knowing which of the three types each measure belongs to saves you from quietly publishing nonsense.
Read: FP&A Monthly Calendar
3. Cubes
A cube is just a way of storing data across several dimensions at once.
Picture a Rubik’s cube. It has three axes. Now imagine that one axis is Time, one is Product, and one is Region. Every little square inside the cube sits at the crossing point of those three axes. That crossing point holds one measure value. So one cell might mean “Revenue, for Product A, in the North region, in March.” Another cell next to it means “Revenue, for Product A, in the South region, in March.”
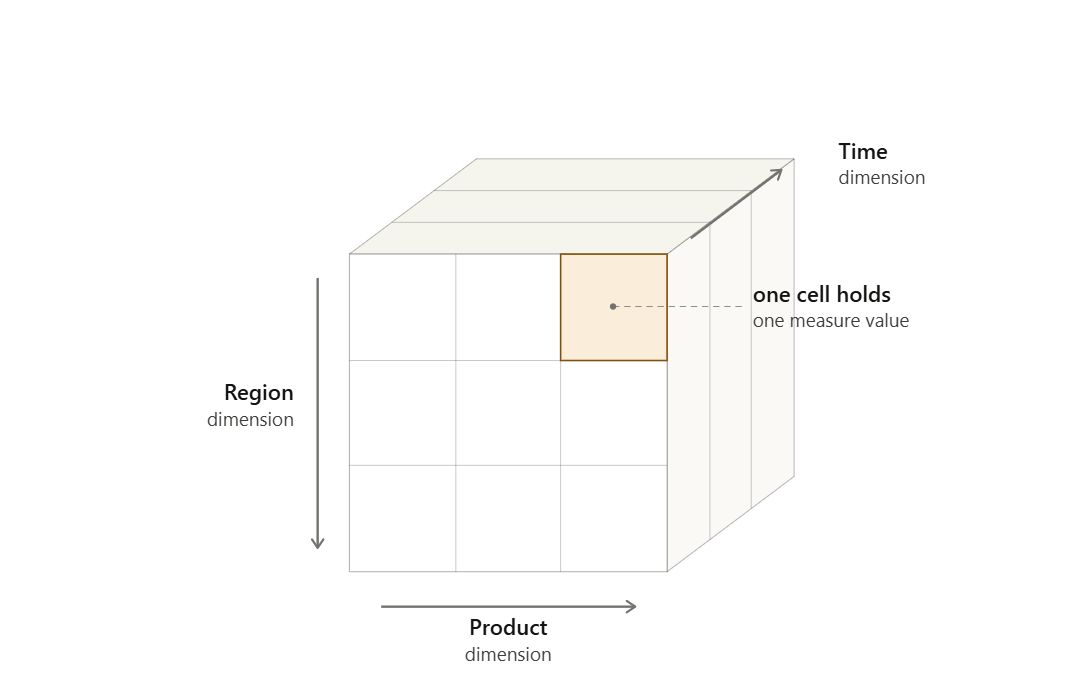
A real planning cube usually has more than three dimensions. You might have Time, Product, Region, Scenario, Account, and Department all at once. You cannot really picture six axes at once, but the idea still holds. A cube is a grid where every dimension is an axis, and every value lives at the intersection of all of them.
Why do tools store data this way instead of in flat tables?
Speed and flexibility. Because the cube already knows how every dimension relates to every other, you can ask it almost any question and get an answer back fast. Show me revenue by region. Now switch it to by product. Now show only the Budget scenario. The cube reshuffles instantly because the structure was built for exactly that.
For FP&A, the practical takeaway is this. When a tool is “cube-based,” it means your data is designed for analysis from many angles, not just for one fixed report. That is the engine behind the fast slicing you will read about further down.
4. Hierarchy
A hierarchy is a parent-and-child structure inside a single dimension. It is how small things roll up into bigger things.
Take the Time dimension. Days roll up into months. Months roll up into quarters. Quarters roll up into a year. That is a hierarchy. Year is the parent, quarters are its children, months are the children of quarters, and so on down.
Geography works the same way. A Total company figure splits into Regions. Each Region splits into Countries. Each Country splits into Cities. Your chart of accounts is a hierarchy too. Total operating expense breaks into categories like Payroll, Travel, and Marketing. Each of those breaks into individual accounts.
In Excel you fake hierarchies with grouping, subtotals, and a lot of manual care. In a proper reporting tool, the hierarchy is built into the dimension itself. The system knows that March belongs inside Q1, which belongs inside the full year. So when you change a number at the bottom, everything above it updates automatically.
This matters more than it first appears. Hierarchies are what let you move between the helicopter view and the detail without rebuilding anything. A CFO wants the one-line total. A regional manager wants their slice. A category owner wants the account-level detail. One well-built hierarchy serves all three from the same source. No copy-paste, no version drift, no “which file is the latest one” panic.
5. Variables
A variable is a single value or assumption that you set once and reuse across your whole model.
Think about the assumptions that drive your plan. A tax rate. An inflation percentage. An FX rate. A headcount growth factor. A standard salary increase. A commission percentage. Each of these is a variable. You hold it in one place, and every calculation that needs it reads from that one place.
Most analysts have done a painful version of this in Excel. You hard-code the tax rate into forty different formulas. Then the rate changes. Now you are hunting through forty cells, hoping you do not miss one. A variable fixes that. You store the rate once, point every formula at it, and when the assumption changes you update a single cell. Everything downstream follows.
The power of variables shows up most during scenario work. What happens to operating profit if inflation runs at six percent instead of four? With a proper variable, you change one number and watch the entire plan respond. Without it, you are rebuilding the model by hand and praying you caught every link.
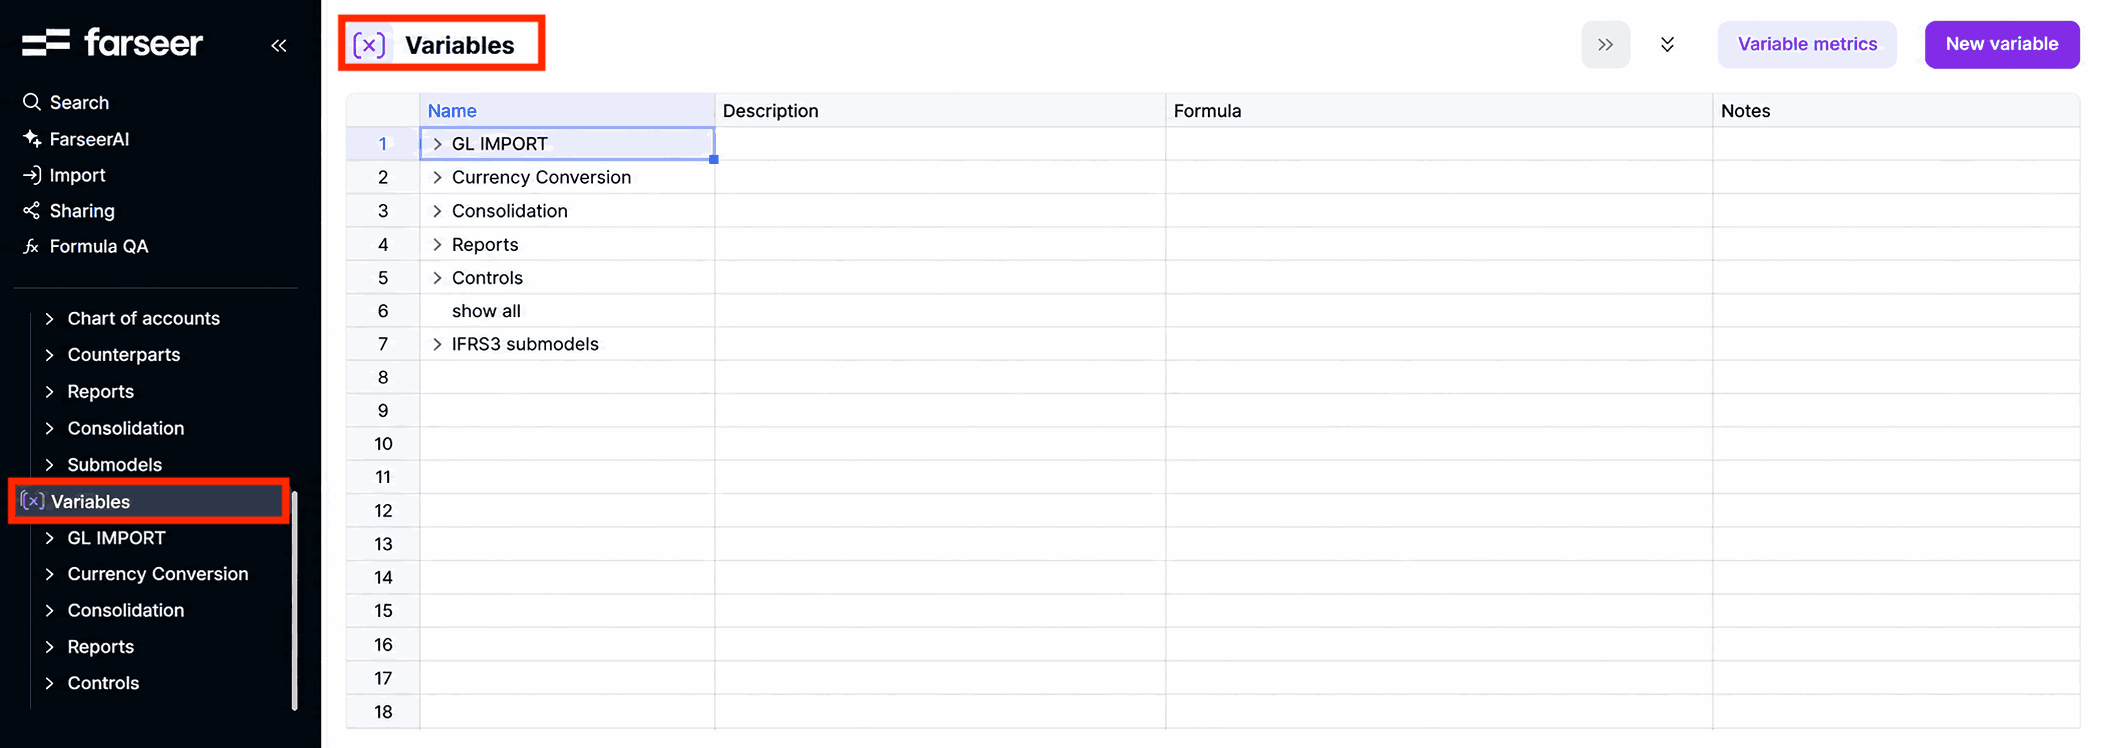
In Farseer, Variables appear as their own object in the sidebar, right alongside Dimensions and Sheets. Your assumptions are not buried inside random formulas. They are named, stored centrally, and managed on purpose, so the logic stays clean and anyone can see what is driving the numbers.
6. OLAP
OLAP stands for Online Analytical Processing. The idea is straightforward once you contrast it with its cousin.
There are broadly two ways software handles data. The first is OLTP, which stands for Online Transaction Processing. That is the world of systems that record transactions one at a time. The second is OLAP, and this is the analysis world. OLAP is built to read huge amounts of data and summarise it across many dimensions in an instant. It is the technology that sits behind the cubes we talked about earlier. When you click a button and a tool sums millions of rows by region, then re-sums them by product a second later, that is OLAP doing its job.
So why should an FP&A professional care about a database term? Because it explains a frustration you have probably felt. Pulling a big report straight out of a transactional ERP can be slow and clunky, because that system was designed to record transactions, not to slice and total them every which way. An OLAP layer sits on top and is designed for exactly the kind of fast, flexible analysis FP&A lives on.
In short, OLTP captures the data and OLAP makes sense of it. When a planning tool is described as OLAP-based or cube-based, it is telling you that it was built for analysis from the ground up. That is why the reporting feels responsive instead of treacly.
It is worth seeing what actually powers that speed in a modern tool.
Farseer runs on a proprietary in-memory calculation engine called Rama. Rama is the core foundation of the platform, built to process large financial datasets and complex models in real time. It calculates fast and stays consistent across products, entities, accounts, currencies, and time, without the performance limits you hit once a spreadsheet model gets heavy. Think of Rama as the modern engine doing the OLAP-style heavy lifting. When you slice a big model by one dimension, then re-slice it by another, the answer comes back at once rather than after a long, frozen wait.
7. Leaf and Grain
These two go together, so we will cover them as a pair. Both describe the most detailed level of your data.
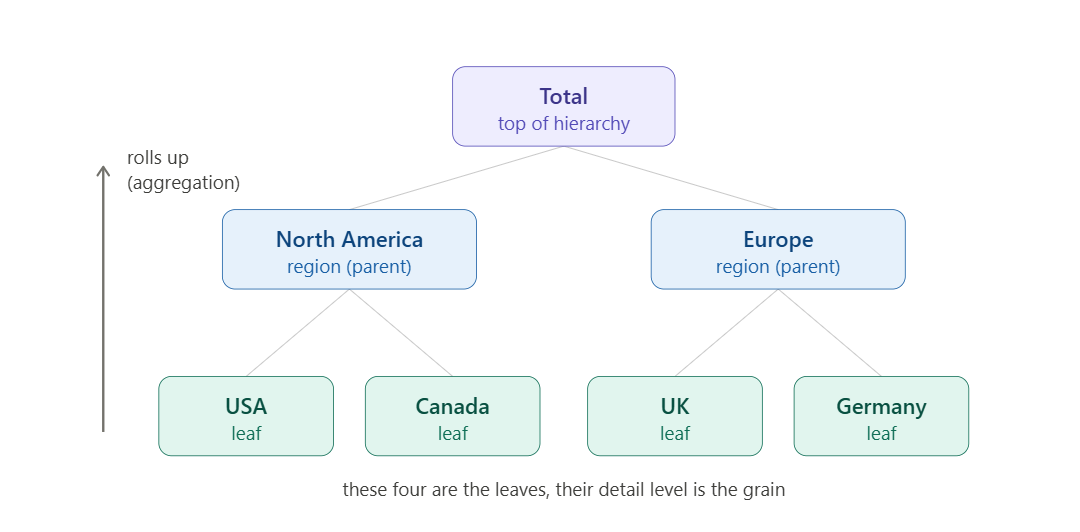
A leaf is the lowest point in a hierarchy. It is the level with no children below it. Stick with the geography example. Total rolls down to Region, Region to Country, Country to City. If a city is at the bottom, then each individual city is a leaf. There is nothing more detailed beneath it. The name comes from the family tree picture. The trunk is the top total, the branches split out, and the leaves hang at the very ends.
Grain is a closely related idea, but it describes the level of detail of a single record or fact. The grain answers the question, “what does one row of this data actually represent?” If one row holds the sales for a single product, in a single store, on a single day, then that is your grain. A finer grain means more detail and more rows. A coarser grain means more summarised data and fewer rows.
Why does this matter to FP&A? Because the grain you choose sets a ceiling on everything you can do later. If you load your sales data at the monthly level, you can never report a weekly trend, because the detail simply is not there. You cannot drill into a level that was never captured. On the other hand, storing everything at the most granular level forever can make a model heavy and slow.
Choosing the right grain is a genuine judgement call. It is the trade-off between detail and performance, and it is one of the most important early decisions in any reporting build. Get it wrong and you either drown in data or hit a wall when someone asks a perfectly reasonable question.
8. Aggregation
Aggregation is the act of rolling detailed data up into bigger, summarised numbers. If the grain and the leaves are the bottom, aggregation is the journey upward.
You aggregate every time you turn daily figures into a monthly total, or monthly figures into a quarter, or city numbers into a regional total. The most common form is a simple sum. Add up the parts to get the whole. But aggregation can also mean an average, a minimum, a maximum, or a count, depending on the measure.
This connects straight back to the point we made about measures. Not everything should be summed. When you aggregate revenue, you add it up, and that is correct. When you aggregate a margin percentage, you must not add the percentages together. Instead the system should recalculate the margin at the higher level, using the aggregated revenue and aggregated cost. When you aggregate a closing headcount or a closing balance, you usually take the last value in the period rather than the sum.
Read: How to Build a Headcount and Salaries Report: Step by Step
A good reporting tool handles all of this for you, quietly and correctly, based on rules you set per measure. A spreadsheet handles it only if you remember to build each rule by hand, every time.
The reason this matters is simple. Aggregation is where reports are silently born wrong. A ratio summed by accident. A balance added across twelve months. The total looks confident and clean, and it is completely false. Understanding aggregation, and checking how each measure rolls up, is one of the most valuable habits an analyst can build. It is the difference between a number you can defend and one that falls apart the moment the CFO probes it.
9. Writeback
Here is the term that separates planning tools from plain reporting tools, and it is one every FP&A professional should understand.
Most business intelligence tools are read-only. They are very good at showing you what happened. You can view, slice, and chart the data, but you cannot change it from inside the report. The data flows one way, from the source into the dashboard, and stops there.
Read: Choosing the Right Financial Reporting Tool: 9 Options Compared
Writeback is the ability to send values back the other way. You type a number into the tool, and it saves into the underlying model or database. That sounds small, but for FP&A it is everything. Forecasting, budgeting, and planning are not about reading history. They are about putting forward numbers that do not exist yet. You need to enter next quarter’s sales target, adjust a hiring plan, or override a driver. Writeback is what lets you do that directly, with the change feeding straight into the rest of the model.
Without writeback, your “planning process” usually means exporting data to Excel, editing it there, then loading it back in. That round trip is where versions multiply and errors creep in. With writeback, the plan lives in one place. You enter a figure, the dependent calculations update, and everyone is looking at the same current truth.
This is exactly the line that planning platforms are built to cross.
A tool like Farseer is designed for two-way work, so you are not just viewing numbers, you are entering and reshaping them. When you change an assumption or type a forecast, it writes back into the model and the connected outputs respond. That two-way flow is the heart of real FP&A software, and it is why “writeback” is worth knowing the next time a vendor uses it as a selling point.
10. Drill-Down and Slice-and-Dice
We finish with two everyday actions that have proper names, and you do both of them constantly without realising.
Drill-down means moving from a summary number to the detail behind it. You start at the company total, click into it, and see the regional split. You click a region and see its countries. You keep going until you reach the leaf level. Drill-up is the reverse, climbing back to the bigger picture. This is the navigation you do whenever a number looks odd and you go hunting for the cause. The total revenue missed plan, so you drill down to find the one region dragging it down, then the one product inside it.
Slice-and-dice is about viewing the same data from different angles. To “slice” is to filter down to one part, like looking only at the Europe region. To “dice” is to rearrange the dimensions, like swapping a report that shows revenue by product into one that shows revenue by channel. Same underlying data, completely different view, no rebuild required.
These two actions are the whole reason cubes and OLAP exist. The structure is built so that drilling and dicing happen in a click. For FP&A, this is where the value lands in practice. The CFO asks “why?” in the meeting, and instead of saying “let me get back to you,” you drill straight into the driver while the conversation is still live. That speed changes how finance is seen, from a team that reports the past to a partner that explains it in real time.
Bringing it all together
Step back and you will see these ten terms are not really ten separate ideas. They describe one connected system.
Your data has a level of detail, called the grain, and the bottom of each dimension holds the leaves. You organise that data by dimensions, and the numbers inside are your measures. Dimensions roll up through hierarchies, and that rolling up is aggregation. Everything is stored in a cube, powered by OLAP, so you can drill down and slice-and-dice at speed. Your assumptions live as variables, and because the tool supports writeback, you do not just read the data, you plan with it.
Once you hold that picture in your head, the vendor demos stop being intimidating. You can ask sharper questions. What grain does it load at? How does it aggregate non-additive measures? Does it actually support writeback, or is it read-only? You move from nodding along to leading the conversation.
This is also why purpose-built FP&A platforms feel so different from a wall of spreadsheets. A tool like Farseer puts these concepts in front of you as real, manageable objects. Dimensions, Variables, Sheets, and Dashboards each have their place, and the cube and writeback engine work underneath so the planning flows both ways. You spend less time wrestling with structure and more time on the analysis that actually moves the business.
You do not need to become a data engineer. You just need to speak enough of the language to make better decisions about your data, your tools, and your reporting. Learn these ten terms well, and you will already be ahead of most of the finance function.
Now the next time someone says “we will writeback to the leaf level and let the cube aggregate up the hierarchy,” you can simply nod. Not because you are pretending. Because you genuinely get it.

FAQ
What are management reporting data terminologies?
Management reporting data terminologies are the core data terms used in FP&A, business intelligence, and planning systems to describe how financial and operational data is structured, stored, calculated, and reported. Common examples include dimensions, measures, cubes, hierarchies, variables, OLAP, grain, aggregation, writeback, and drill-down.
Why should FP&A professionals understand data terminology?
FP&A professionals should understand data terminology because modern planning and reporting tools are built around data models, dimensions, measures, hierarchies, and writeback. Knowing these terms helps finance teams design better reports, ask sharper questions during software demos, avoid aggregation errors, and work more effectively with IT, BI, and data teams.
What is the difference between a dimension and a measure?
A dimension is a way to slice or categorise data, such as time, product, region, department, customer, or scenario. A measure is the numeric value being analysed, such as revenue, cost, headcount, gross margin, units sold, or cash balance. In a management report, dimensions usually appear as row and column labels, while measures appear as the numbers inside the report.
What is a cube in management reporting?
A cube is a data structure that stores measures across multiple dimensions at the same time. For example, a cube may store revenue by time, product, region, scenario, and department. Cubes allow FP&A teams to quickly analyse the same data from different angles without rebuilding reports manually.
What is OLAP in FP&A reporting?
OLAP stands for Online Analytical Processing. It is a technology used to analyse large volumes of data across multiple dimensions quickly. In FP&A, OLAP helps teams slice, dice, drill down, and aggregate financial data across time, products, regions, accounts, and scenarios, making reporting faster and more flexible than working directly from transactional systems.
What is the difference between OLAP and OLTP?
OLTP, or Online Transaction Processing, is designed to record transactions such as invoices, payments, sales orders, and journal entries. OLAP, or Online Analytical Processing, is designed to analyse and summarise transactional data for reporting and decision-making. In simple terms, OLTP captures the data, while OLAP helps finance teams analyse it.
What does grain mean in a data model?
Grain refers to the level of detail in a data record. For example, if one row of data represents sales for one product in one store on one day, that is the grain of the dataset. Grain matters because it determines how deeply FP&A teams can analyse or drill into the data later.
What is aggregation in management reporting?
Aggregation is the process of rolling detailed data up into summary numbers. For example, daily sales can be aggregated into monthly sales, product-level revenue can be aggregated into category revenue, and city-level data can be aggregated into regional totals. Correct aggregation rules are critical because not every measure should be summed; ratios, margins, balances, and headcount often need special treatment.
What is writeback in FP&A software?
Writeback is the ability to enter or change values inside a planning tool and save those changes back into the underlying model or database. It is important in FP&A because budgeting, forecasting, and planning require users to input future assumptions, targets, overrides, and scenarios, not just read historical data.
What is the difference between drill-down and slice-and-dice?
Drill-down means moving from a summary number to the detailed data behind it, such as moving from total revenue to region, country, customer, or product-level revenue. Slice-and-dice means viewing the same data from different angles, such as revenue by product, by region, by channel, or by scenario. Both are essential for fast management reporting and variance analysis.

What Great Financial Reporting and Analytics Actually Look Like
Read more
Ad Hoc Reporting for Finance Teams Who Can’t Wait on IT
Read more