Common Size Financial Statement: What Is It and How to Prepare It

If you’ve ever looked at a financial statement and felt like you were drowning in numbers, you’re not alone. But here’s good news – a common size statement may help.
It’s a simple tool that takes all those big numbers and converts them into percentages. In this way, it’s much easier to spot trends, compare performance, and see how your business stacks up against others. For example, instead of just seeing that your operating expenses were $5 million last year, you’d see they made up 40% of your total revenue – which is a far more useful info if you need to make a financial decision.
Read: A Complete Guide to Financial Statement Analysis for Strategy Makers
In this blog, we’ll break down what common size statements are and how they work. We’ll walk you through steps of creating one for both the income statements and the balance sheets, explain why they’re so helpful for analyzing your business, and share some tips on how to use them for strategic financial decisions.
But let’s start from the beginning.
What is a Common Size Statement?
A common size statement is a financial report where every item is shown as a percentage of a key figure – total revenue if we talk about income statements or total assets if we look at balance sheets.
The goal? To make it easier to understand the big picture and identify patterns without getting lost in the raw numbers.
There are two main types of common size statements:
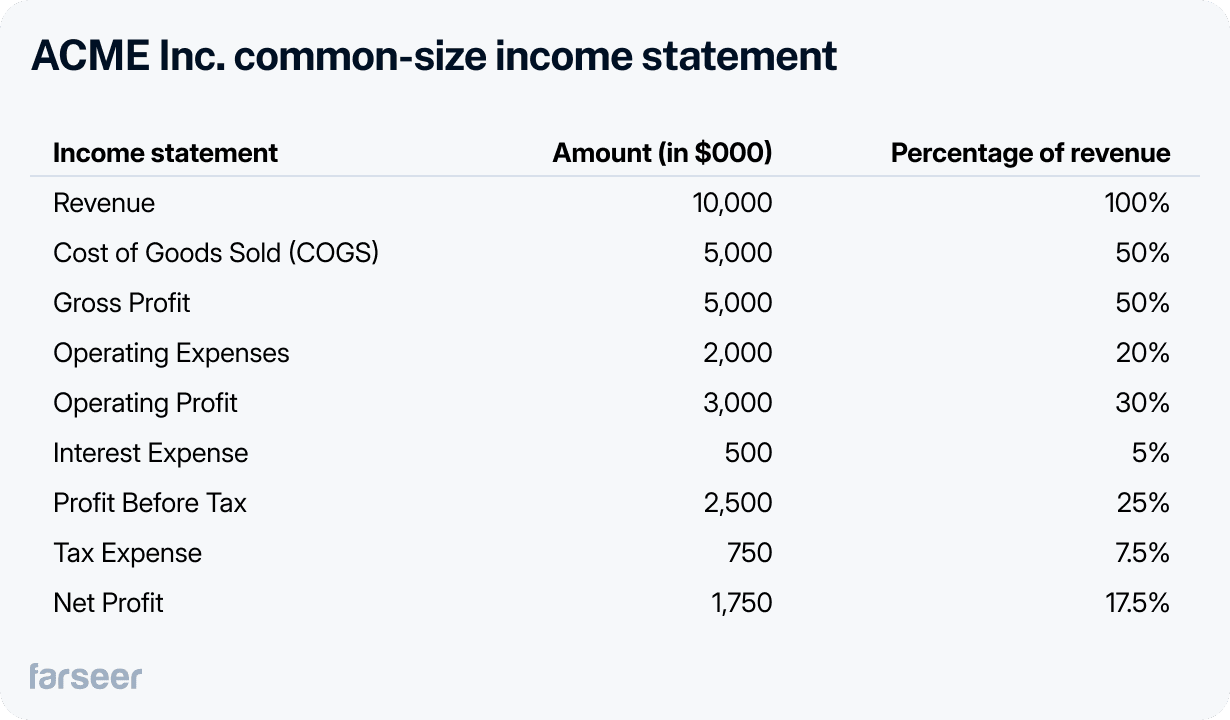
Common Size Income Statement
In this format, every item, like cost of goods sold (COGS), operating expenses, and net profit, is expressed as a percentage of total revenue. For example, instead of just knowing that your gross profit is $10 million, you’ll see it represents, let’s say, 60% of your revenue. This makes it much easier to compare performance across years or even with competitors.
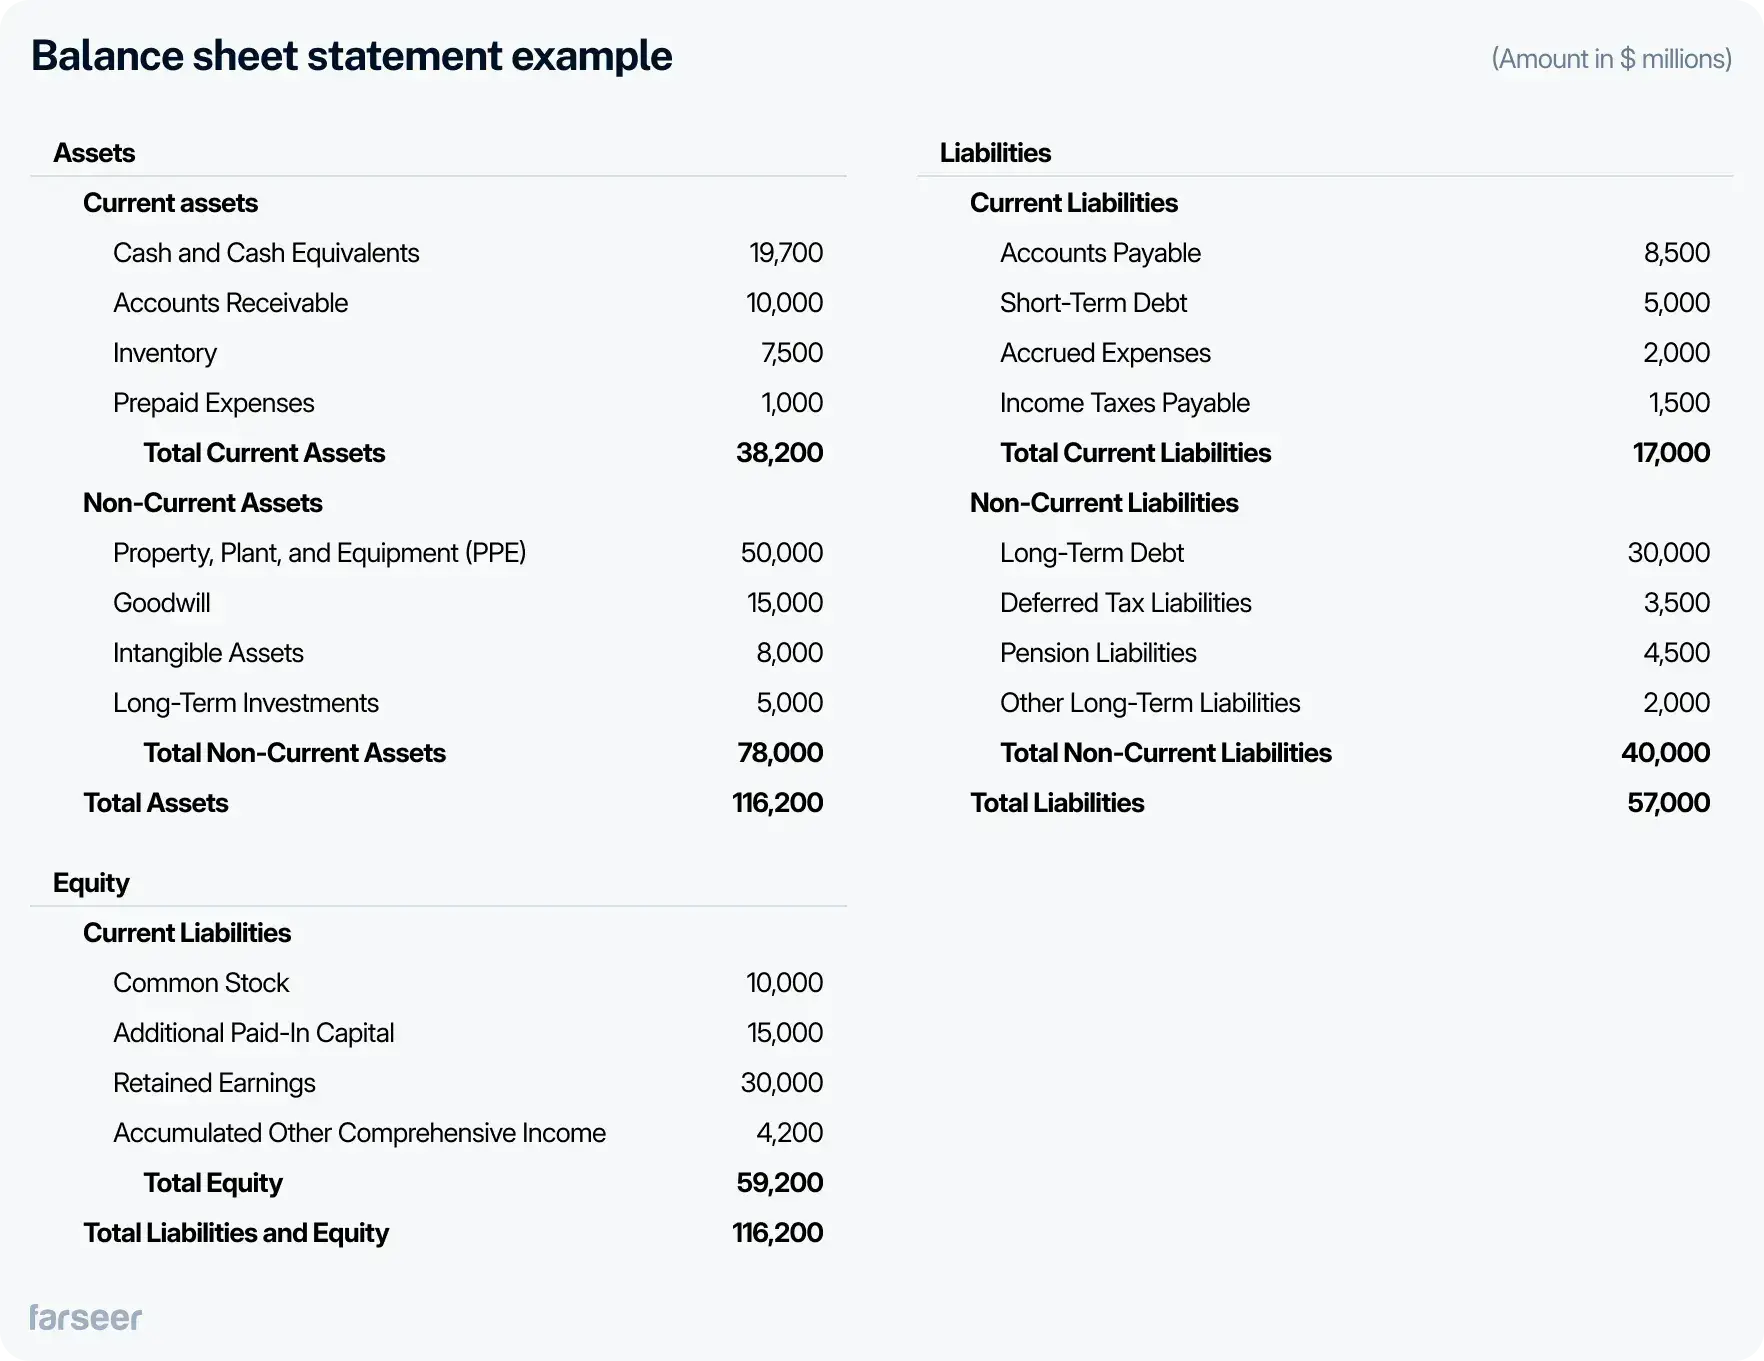
Common Size Balance Sheet
Here, every line item is shown as a percentage of total assets. For example, you can quickly see what percentage of your assets are tied up in inventory, or how much of your business is financed by debt versus equity.
How to Prepare a Common Size Statement
Creating a common size statement is actually really simple. Here’s how you can do it for both income statements and balance sheets:
How to create a common size income statement
In a common size income statement, you express every line item as a percentage of total revenue. Here’s how to prepare it step by step:
- Start with your income statement:
Grab your company’s income statement, which includes revenue, cost of goods sold (COGS), operating expenses, and net income. - Identify total revenue:
This is your “base figure” for the percentages. - Calculate percentages for each line item:
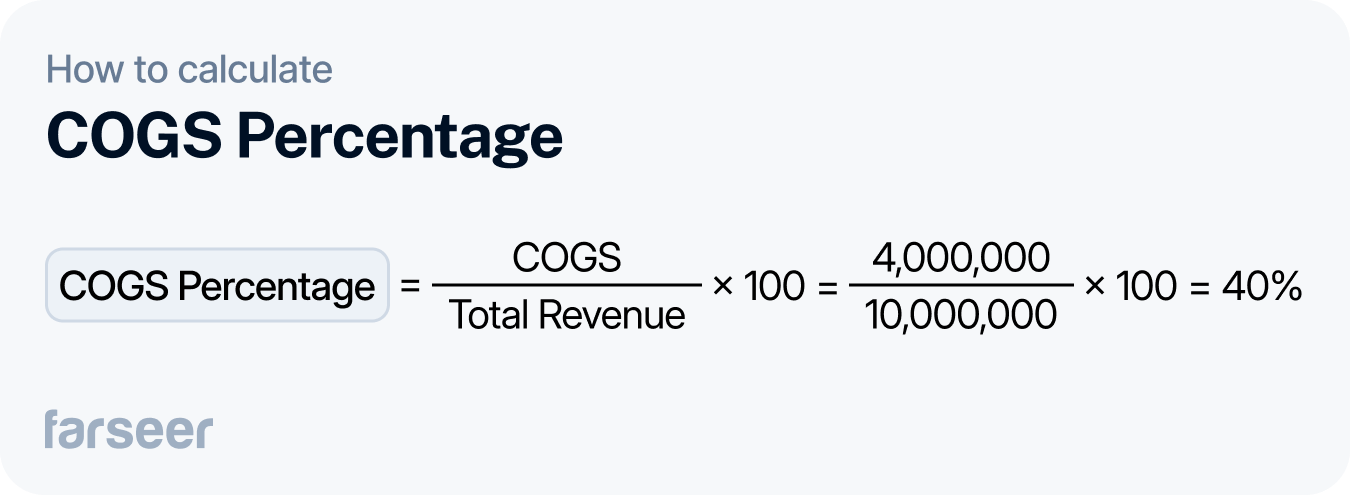
Divide each line item by total revenue, then multiply by 100 to get the percentage.
- For example: If total revenue is $10 million and COGS is $4 million, COGS as a percentage of revenue is:
4. Present the data:
Replace the raw dollar amounts with their respective percentages in the income statement format
How to create a common size balance sheet
For a common size balance sheet, every line item is expressed as a percentage of total assets. Here’s the process:
- Start with your balance sheet:
Use the standard balance sheet format, which lists assets, liabilities, and equity. - Identify total assets:
Total assets serve as the “base figure” for this calculation. - Calculate percentages for each line item:
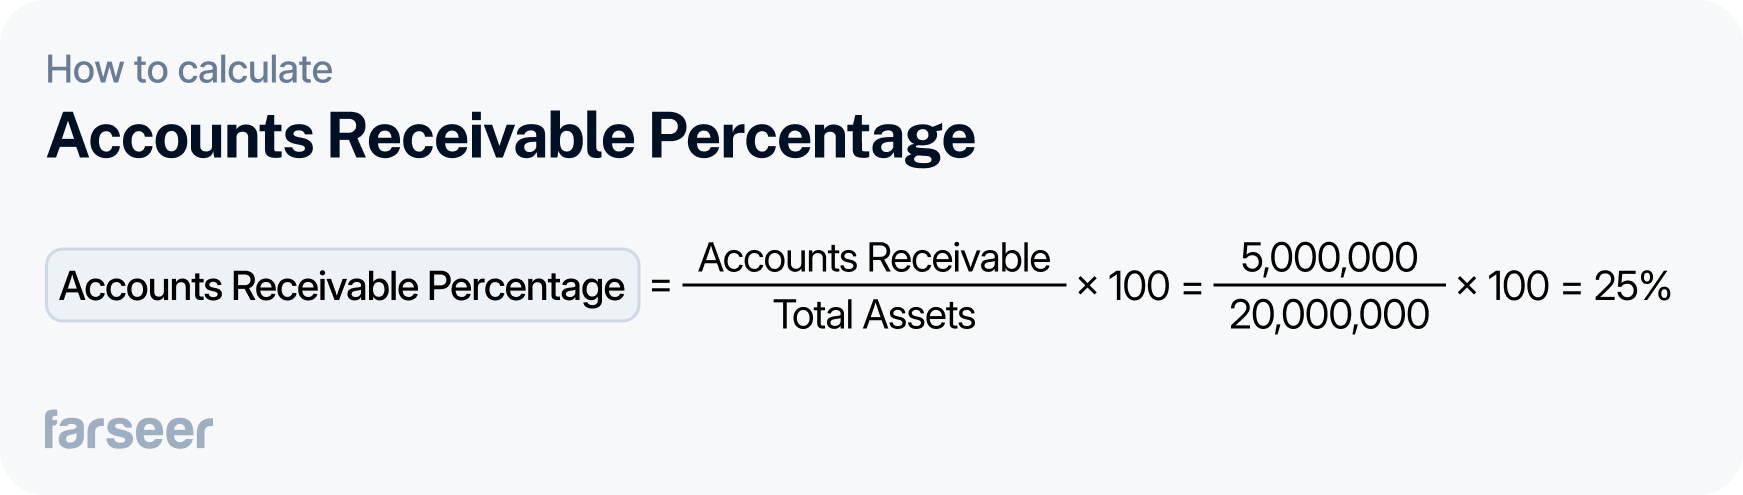
Divide each line item (e.g., cash, inventory, accounts payable) by total assets, then multiply by 100.
- Example: If total assets are $20 million and accounts receivable is $5 million, the percentage is:
4. Format the data:
Just like with the income statement, replace dollar amounts with percentages.
Interpreting a Common Size Statement: Key Ratios to Watch
Once your common size statement is ready, the real value comes from interpreting the data. By looking at percentages instead of raw numbers, you can easily identify trends, spot red flags, and pinpoint areas where your business is doing great or not so much. Here are the key areas to focus on when analyzing common size income statements and balance sheets:
Income statement: key ratios to watch
- Gross Margin
Gross margin is the percentage of revenue left after deducting the cost of goods sold (COGS). It’s the most important metric that shows how efficiently a company is producing or sourcing its products.- Example: If a company’s gross margin drops from 50% to 45% year over year, it could mean that production costs are rising or that there is a pricing issue – both serious issues that will require your attention.

2. Operating Margin
Operating margin is the percentage of revenue left after covering operating expenses (like salaries, rent, marketing, etc.). It shows how efficiently the company manages its day-to-day operations.
- Tip: Watch for fluctuations here – if operating expenses rise disproportionately compared to revenue, it could mean that you’re not efficient in cost management.
3. Net Profit Margin
Net profit margin is the percentage of revenue that remains as profit after all expenses, taxes, and interest are paid. It’s a key measure of overall profitability.
- Example: A retail company like Walmart, which operates on thin margins, might have a net profit margin of around 1-3%. Even a slight decrease in this percentage could signal major issues with cost control or pricing strategy.
Balance sheet: Key areas to focus on
- Asset Structure
Knowing what percentage of your total assets is in cash, inventory, or fixed assets helps you understand your liquidity and how efficiently your business operates.- Example: If a retailer like Walmart shows an increasing percentage of assets in inventory, it could signal overstocking or declining sales, which could hurt cash flow.

2. Liabilities Composition
Check how much of your assets are funded by liabilities like accounts payable or debt. If liabilities make up a large percentage, it might mean the business is taking on too much debt.
- Tip: Compare this with industry benchmarks – what’s normal for a retailer might be different from a SaaS company.
3. Equity Composition
Equity as a percentage of total assets shows how much of the business is funded by shareholders instead of debt. A good balance between equity and liabilities is crucial for a company’s financial stability.
Limitations of Common Size Statements
While common size statements are incredibly useful for simplifying financial analysis, they’re not without their limitations. It’s important to understand them so you can interpret the data accurately and avoid making wrong decisions. Here are some key limitations to keep in mind:
1. They don't account for inflation or currency changes.
Common size statements show percentages but ignore factors like inflation or currency changes, which can make comparisons over time or across regions inaccurate.
- Example: If a company operates in high-inflation markets like Argentina or Turkey, higher revenue or costs might just reflect inflation, not real growth or problems. Without adjusting for this, the percentages can be misleading.
2. A context is required for an accurate analysis.
Percentages alone don’t tell the whole story. To get useful insights, you need to understand the business, industry, and operations.
- Example: A company with a higher gross margin than competitors isn’t always outperforming – it might just be in a higher-priced niche. Similarly, e-commerce companies like Amazon often have lower margins in Q4 due to holiday demand, not inefficiency. Without context, it’s easy to misread the data.

3. Seasonal or cyclical changes can be misleading.
For businesses with strong seasonal trends, common size statements need to be interpreted very carefully. Comparing a single period without considering seasonality or cycles might lead to false conclusions.
- Example: For a retailer like Amazon, the fourth quarter (holiday season) typically shows a surge in revenue, while margins may decrease due to the lower priced products required for high-volume sales. If you compare Q4 with Q1, where margins may be proportionally higher due to lower revenue, you might mistakenly conclude that Q1 performance is weak. Understanding the business cycle is critical to avoid these pitfalls.
How to mitigate these limitations
To overcome these challenges, always pair common size analysis with:
- Trend Analysis: Compare several periods to identify consistent patterns and smooth out short-term fluctuations.
- Industry Benchmarks: Measure against competitors or industry averages to understand whether your percentages are healthy.
- Additional Metrics: Combine common size analysis with other tools like variance analysis, KPI tracking, and scenario modeling to add meaning to your insights.
Common size statements help simplify numbers and highlight financial trends, but they’re just one piece of the puzzle. They need to be combined with other tools and a clear understanding of your business to provide valuable insights.
Conclusion
Common size statements are a valuable tool for turning financial data into useful percentages, making it easier to analyze trends, compare performance, and benchmark against industry standards. They help you focus on what matters most, whether you’re looking at profitability or financial structure.
By adding common size analysis to your FP&A processes, you can gain a clearer picture of your company’s financial health, identify inefficiencies, and make more informed decisions. Though not perfect, they provide a solid foundation for building a more actionable financial overview.
If you haven’t yet, consider incorporating common size statements into your reports. With tools like FP&A software such as Farseer, you can simplify the process and gain the insights needed to improve strategies and outcomes.

FAQ
What is a common size statement?
A common size statement is a financial report where each line item is expressed as a percentage of a base figure, such as total revenue on an income statement or total assets on a balance sheet. It helps simplify financial analysis and makes comparisons easier.
Why are common size statements useful?
Common size statements help businesses identify trends, compare financial performance across periods or competitors, analyze profitability and cost structures, and make more informed financial decisions without getting lost in large numbers.
What is the difference between a common size income statement and a common size balance sheet?
A common size income statement expresses all items as a percentage of total revenue, while a common size balance sheet expresses all items as a percentage of total assets.
What are the key metrics to analyze in a common size statement?
Important metrics include gross margin, operating margin, and net profit margin on the income statement, as well as asset structure, liabilities composition, and equity composition on the balance sheet.
What are the limitations of common size statements?
Common size statements can be misleading if inflation, currency changes, seasonality, or industry context are ignored. They should always be combined with trend analysis, benchmarking, and other financial analysis methods for accurate interpretation.

Financial Statement Analysis: The Complete Guide (With Step-by-Step Process)
Read more
Best Financial Analysis Tools in 2026: Compare Features & Pricing
Read more