15 Key Metrics to Track as KPI for Finance Department

Tracking the right KPI for finance department success is critical. Without the right metrics, finance teams risk focusing on irrelevant data, which can lead to poor decisions, inefficiencies, and missed opportunities.
But not every KPI is useful for every business. How do you know which ones are worth your time?
Read: A Complete Guide to Financial Statement Analysis for Strategy Makers
In this blog, we’ll walk you through the 15 most important KPIs for finance departments, with clear definitions, practical examples, and simple formulas. By focusing on the right metrics, you’ll be able to make better financial decisions and drive measurable results.
Why KPIs for the Finance Department Matter
What Are Finance Department KPIs
KPIs, or Key Performance Indicators, are measurable metrics that help finance departments track progress toward financial and strategic goals. They translate complex financial data into clear, actionable insights, giving your team the tools to make better decisions.
By tracking KPIs, finance teams can monitor the most important areas like profitability, liquidity, efficiency, and expenses. Instead of being overwhelmed by numbers, KPIs for finance departments highlight the metrics that matter most. It can be understanding cash flow, controlling costs, or improving operational performance.
With the right KPIs, finance departments can easily find problems, make informed decisions, and align with broader business goals.
How Finance Department KPIs Help Improve Results
Tracking the right KPIs helps finance teams improve key areas of their work:
- Cash flow management: Metrics like the Cash Conversion Cycle help ensure the business has enough liquidity to meet its obligations.
- Profitability tracking: KPIs like Gross Profit Margin show where the company is generating value – or losing it.
- Efficiency optimization: Metrics like Inventory Turnover and Accounts Receivable Turnover reveal how well resources are being used.
For example, monitoring the Debt-to-Equity Ratio can guide long-term investment decisions, ensuring the company isn’t taking on unnecessary risk. Similarly, analyzing Budget Variance helps teams identify where spending has gone off track, making it easier to stay financially disciplined.
How to Choose the Right KPIs for Your Finance Department
To get the most out of your data, you need to focus on the metrics that actually matter to your business. Here’s how to pick the right ones:
- Start with Your Goals
Think about what your finance team is trying to achieve. If you want to improve profits, track KPIs like Gross Profit Margin or Net Profit Margin. If you’re focusing on cash flow, look at the Cash Conversion Cycle or Working Capital. Tracking budget vs. actual performance is also a great way to make sure your KPIs align with your financial plans. - Focus on Actionable Metrics
Good KPIs point to something you can fix or improve. For example, Budget Variance can show where spending went over budget, and Accounts Receivable Turnover can help you spot payment delays. Skip vanity metrics that don’t give you useful insights. - Make Sure KPIs Match Your Day-to-Day Work
Your KPIs should reflect what your team actually manages. If you’re responsible for monitoring collections and payments, track Accounts Payable and Accounts Receivable Turnover. If your job involves managing inventory, focus on Inventory Turnover and the Cash Conversion Cycle. The right KPIs will give you a clear view of the numbers that matter most.

When you choose KPIs that match your goals and business type, you’ll spend less time on irrelevant data and more time improving what matters.
In the next section, we’ll break down the 15 essential KPIs every finance department should focus on.
15 Key Finance Department KPIs to Track (With Practical Examples)
The 15 KPIs in this list cover the basics: profitability (Gross Profit Margin, Net Profit Margin, EBITDA), cash flow (Current Ratio, Quick Ratio, Working Capital), efficiency (Inventory Turnover, Accounts Receivable Turnover, Accounts Payable Turnover, Cash Conversion Cycle), expenses (Budget Variance, Cost of Goods Sold, Labor Cost as a Percentage of Revenue), and debt management (Debt-to-Equity Ratio, Return on Equity).
For each KPI, you’ll get a quick explanation, a simple formula, and an example to show how it works. These are the numbers that really matter for running a successful finance department.
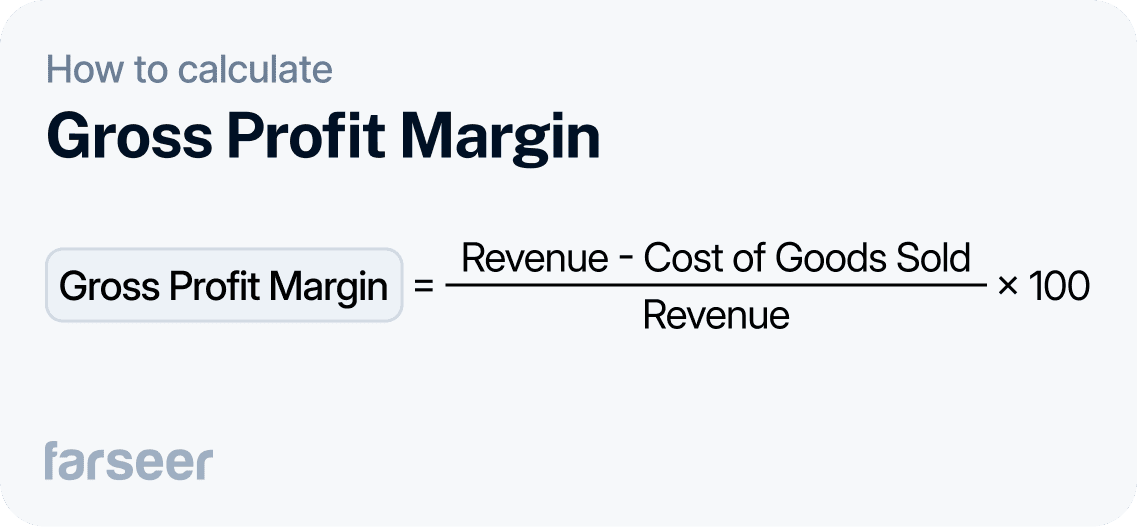
Gross Profit Margin
What it measures
Gross Profit Margin shows how much revenue is left after covering the cost of goods sold (COGS). It tells you how efficiently your business produces and sells its products.
Why it matters
A healthy margin means your business has room to cover operating expenses and grow. If it’s low, it could signal pricing or production issues.
Read: Revenue vs Gross Profit: Understanding the Difference to Avoid Planning Errors
Example:
If your company earns $500,000 in revenue and spends $300,000 on COGS:
Gross Profit Margin = ($500,000 – $300,000) ÷ $500,000 × 100 = 40%
This means 40% of your revenue is left to cover other costs and make a profit.
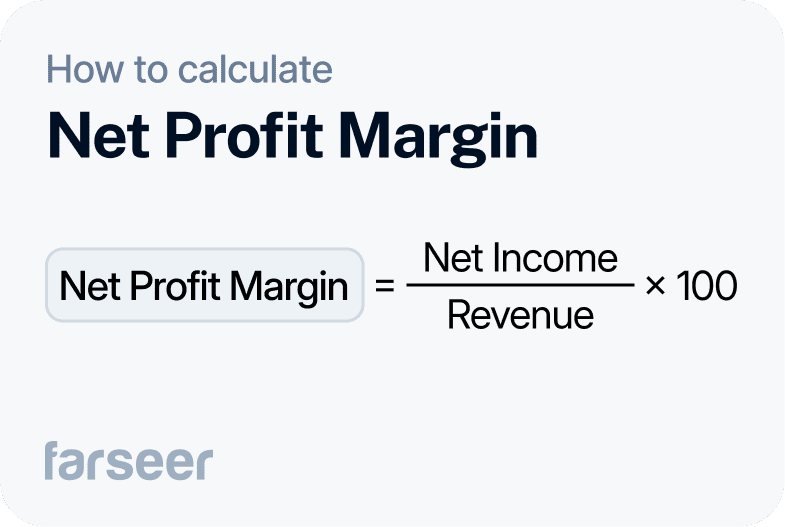
Net Profit Margin
What it measures
Net Profit Margin shows how much profit your company keeps from its total revenue after deducting all expenses, taxes, and interest.
Why it matters
This KPI reveals your company’s overall profitability. A higher margin means the business is running efficiently and generating profit from its operations.
Example:
If your company has a net income of $100,000 and total revenue of $500,000:
Net Profit Margin = ($100,000 ÷ $500,000) × 100 = 20%
This means your company keeps 20% of its revenue as profit after covering all costs.
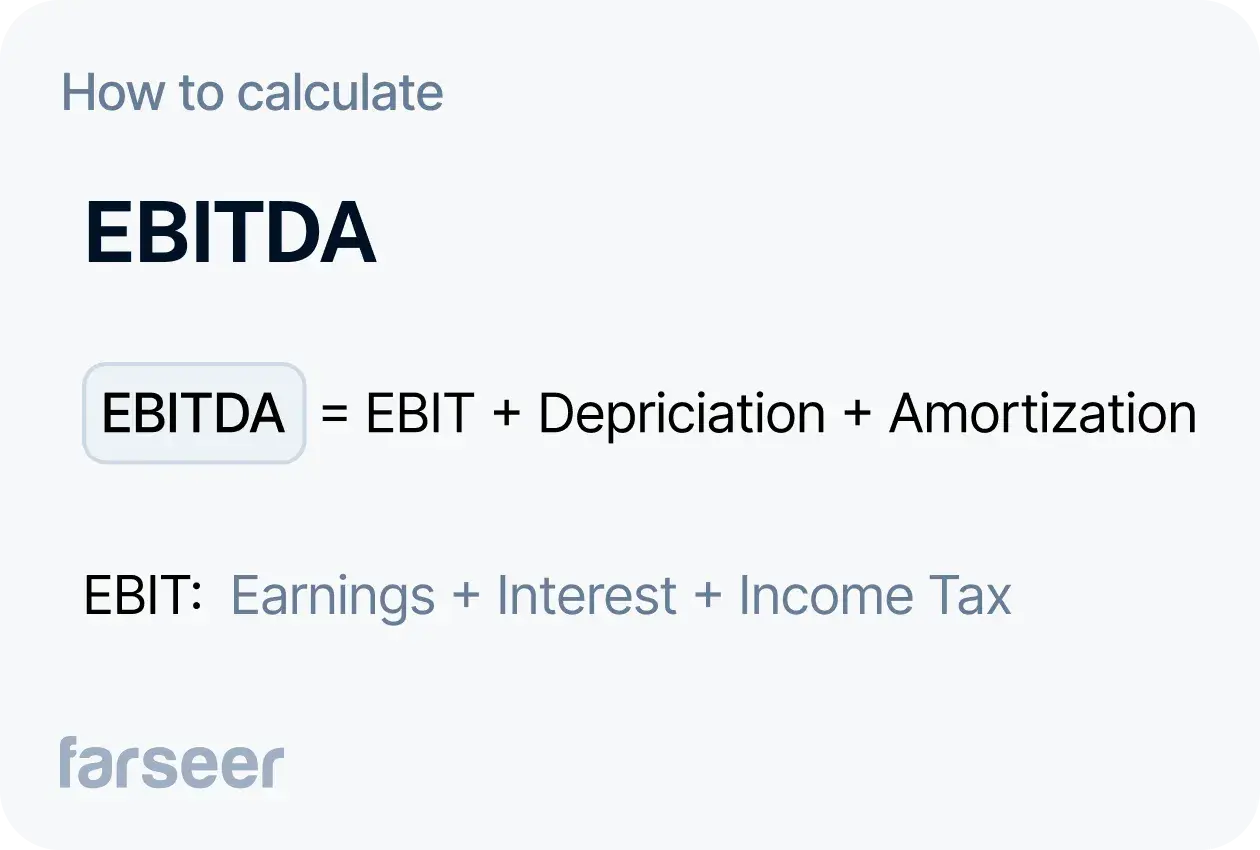
EBITDA
What it measures
EBITDA tracks your company’s operating performance by focusing on earnings before accounting for financing and non-operational expenses like taxes and depreciation.
Read: Revenue vs EBITDA: Which Metric Should Drive Your Strategic Planning
Why it matters
It’s often used to compare your business’s profitability with others, regardless of differences in capital structure or tax environments. A higher EBITDA indicates strong operational efficiency.
Example:
If your company has an operating income of $200,000 and depreciation and amortization expenses total $50,000:
EBITDA = $200,000 + $50,000 = $250,000
This means your business generates $250,000 from its core operations before external expenses like interest or taxes are considered.
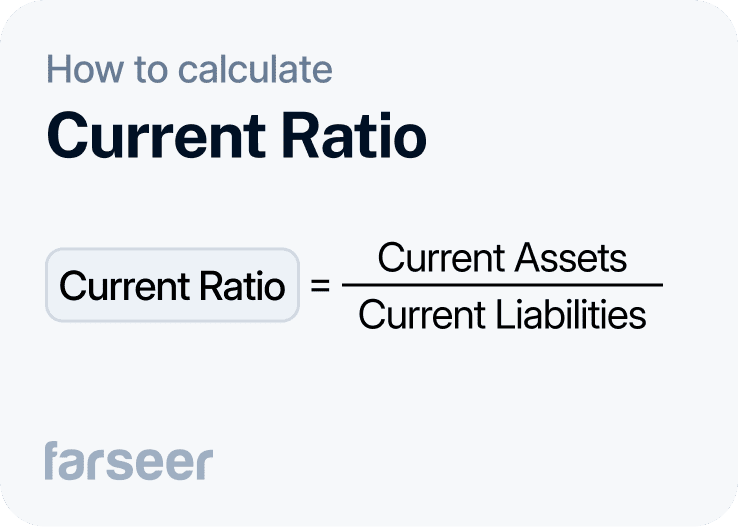
Current Ratio
What it measures
The Current Ratio shows your company’s ability to pay short-term liabilities using short-term assets.
Why it matters
A ratio above 1 means your business has enough assets to meet obligations. If it’s below 1, it may signal liquidity issues.
Example:
If your company has $500,000 in short-term assets and $250,000 in short-term liabilities:
Current Ratio = $500,000 ÷ $250,000 = 2.0
This means your business has $2 in assets for every $1 in liabilities.
To learn more about optimizing this metric, check out How to Improve Current Ratio.
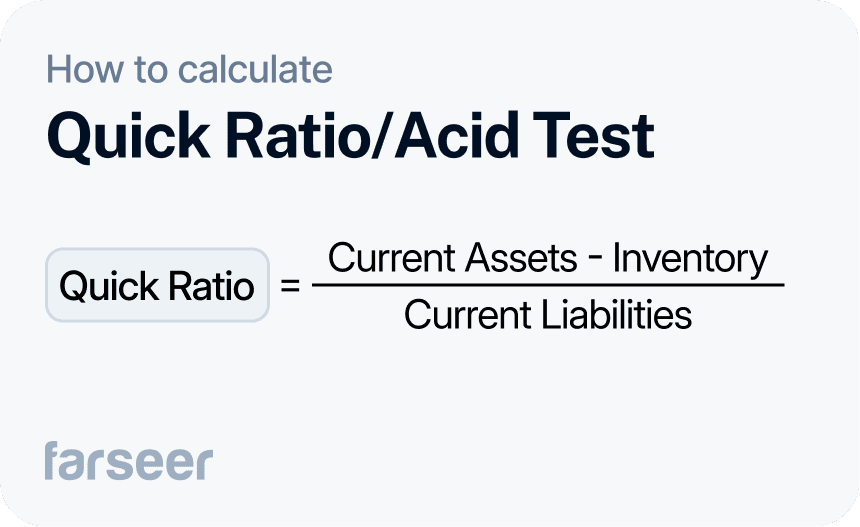
Quick Ratio (Acid Test)
What it measures
The quick ratio shows your company’s ability to cover short-term liabilities without relying on inventory.
Why it matters
This stricter liquidity metric is especially important for businesses with slow-moving inventory, which can take time to convert into cash.
Example:
If your business has $500,000 in current assets, $100,000 in inventory, and $250,000 in current liabilities:
Quick Ratio = ($500,000 – $100,000) ÷ $250,000 = 1.6
This means your business has $1.60 in liquid assets for every $1 of liabilities.
For more on liquidity metrics, check out Liquidity and Solvency Ratios.
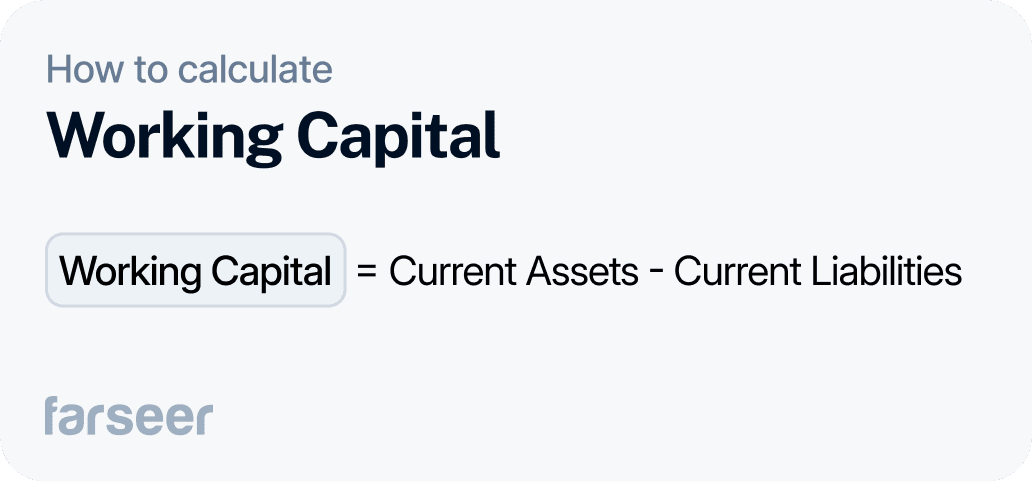
Working Capital
What it measures
Working capital measures the difference between your current assets and current liabilities, showing how much liquidity is available for daily operations.
Why it matters
Positive working capital means your business can cover short-term obligations and fund its operations. Negative working capital may signal financial trouble.
Example:
If your company has $700,000 in current assets and $500,000 in current liabilities:
Working Capital = $700,000 – $500,000 = $200,000
This means your business has $200,000 available to cover short-term expenses and keep operations running smoothly.
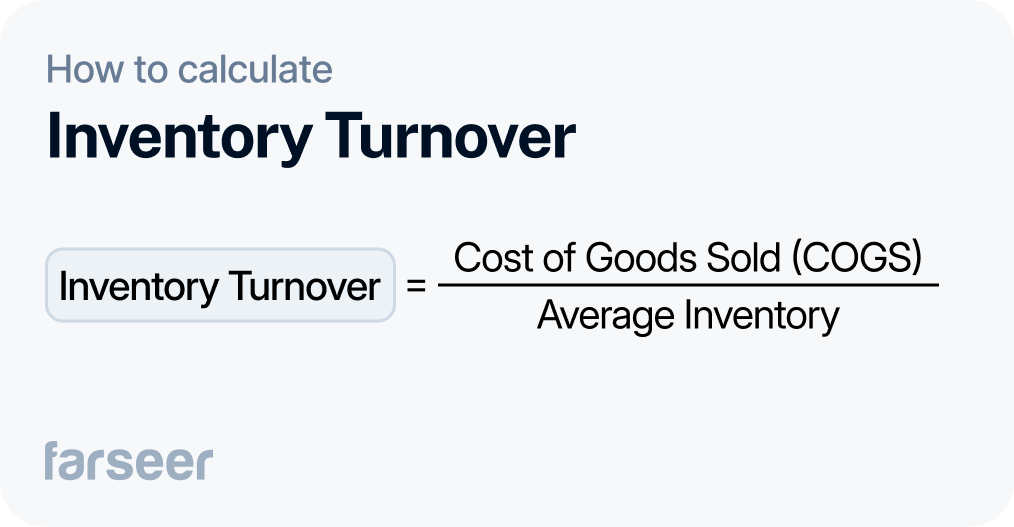
Inventory Turnover
What it measures
Inventory Turnover shows how often your business sells and replaces inventory within a given period.
Why it matters
A high turnover rate means your inventory is selling quickly, while a low rate may indicate overstocking or weak demand.
Example:
If your COGS is $300,000 and your average inventory is $100,000:
Inventory Turnover = $300,000 ÷ $100,000 = 3
This means your inventory turns over three times per period, meaning the company is efficient in stock management.
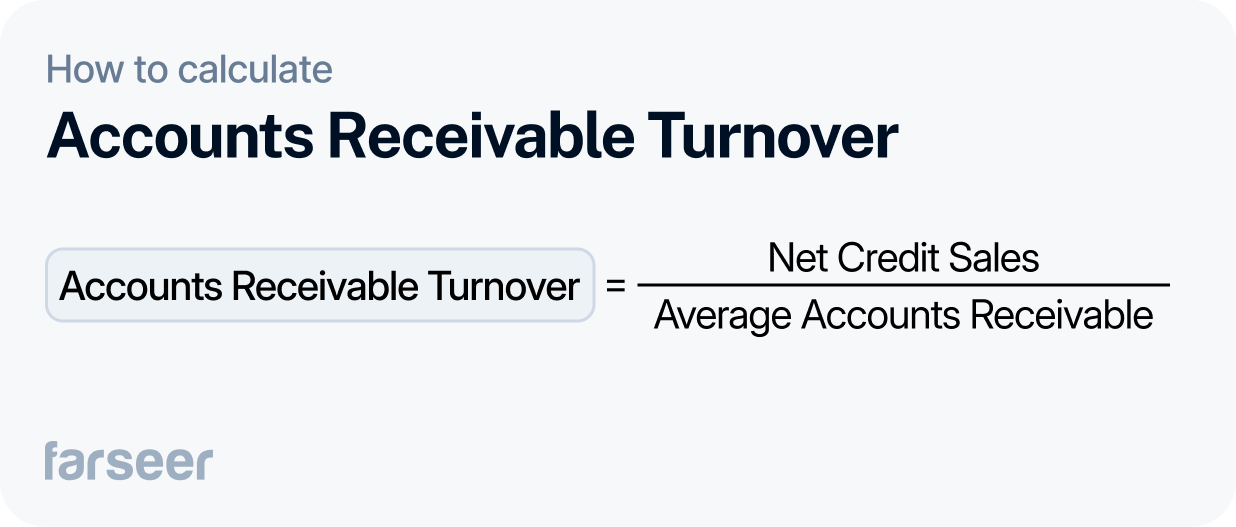
Accounts Receivable Turnover
What it measures
Accounts Receivable Turnover tracks how efficiently your business collects payments from customers.
Why it matters
A higher turnover means customers are paying quickly, improving cash flow. A lower turnover may signal delays in collections.
Example:
If your net credit sales are $500,000 and average accounts receivable is $100,000:
Accounts Receivable Turnover = $500,000 ÷ $100,000 = 5
This means you collect payments five times per period.
Accounts Payable Turnover
What it measures
Accounts Payable Turnover shows how quickly your company pays its suppliers.
Why it matters
A high turnover indicates timely payments, while a low turnover may signal cash flow challenges or strained supplier relationships.
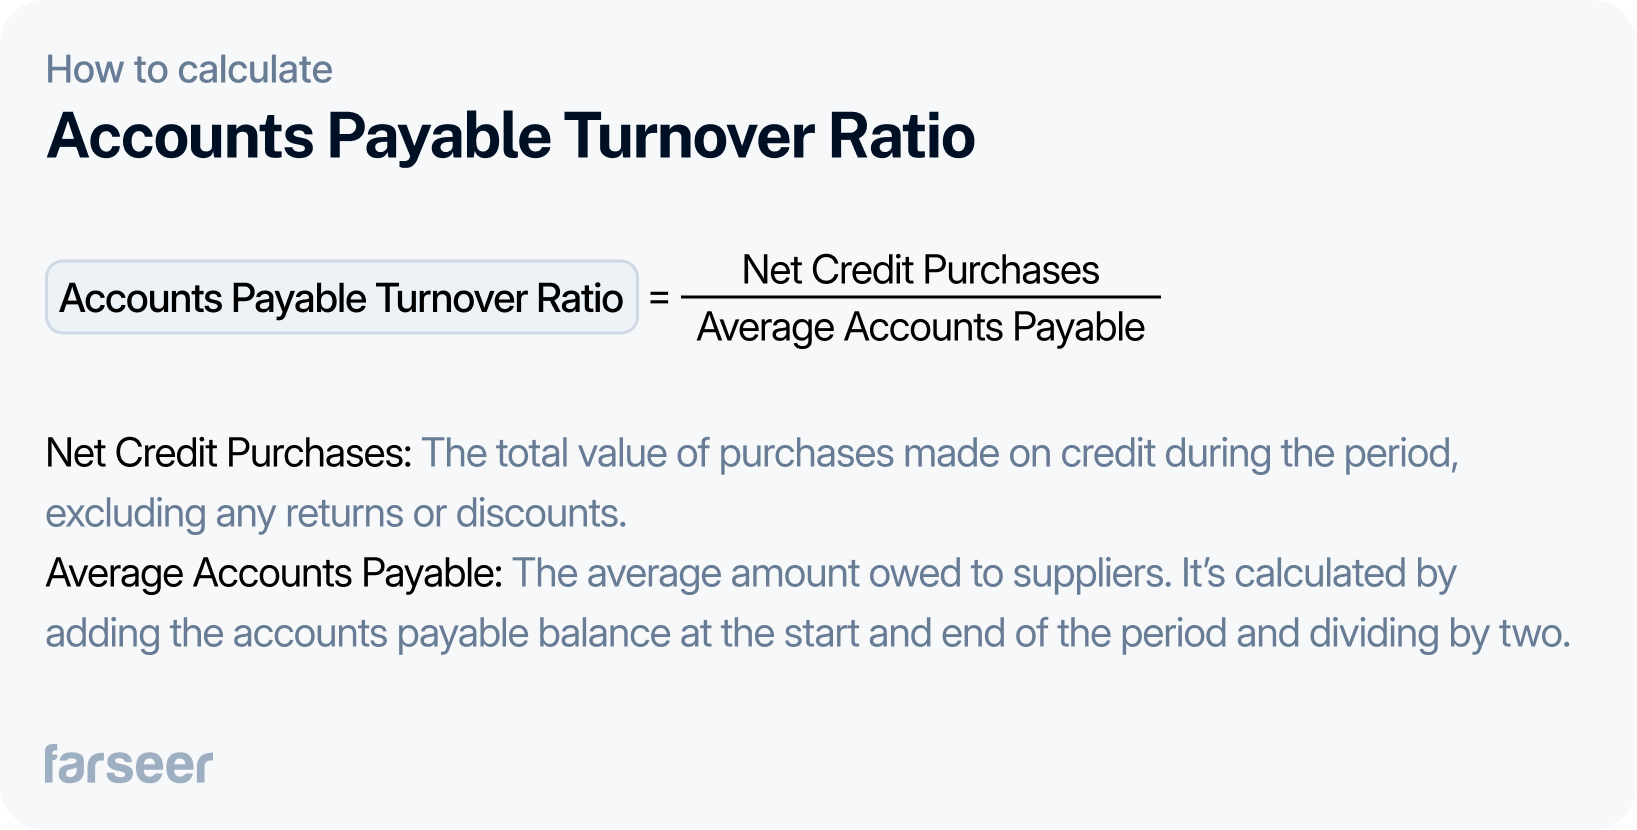
Example:
If your net credit purchases are $400,000 and your average accounts payable is $100,000:
Accounts Payable Turnover = $400,000 ÷ $100,000 = 4
This means your business pays its suppliers four times per period, which is very efficient.
For a deeper dive into this metric, check out our Accounts Payable Turnover Ratio blog.
Cash Conversion Cycle (CCC)
What it measures
The Cash Conversion Cycle tracks how long it takes your company to turn inventory into cash by factoring in receivables, payables, and inventory turnover.
Why it matters
It shows how efficiently your business manages cash flow. A shorter cycle means your company can free up cash faster, while a longer cycle may signal delays.
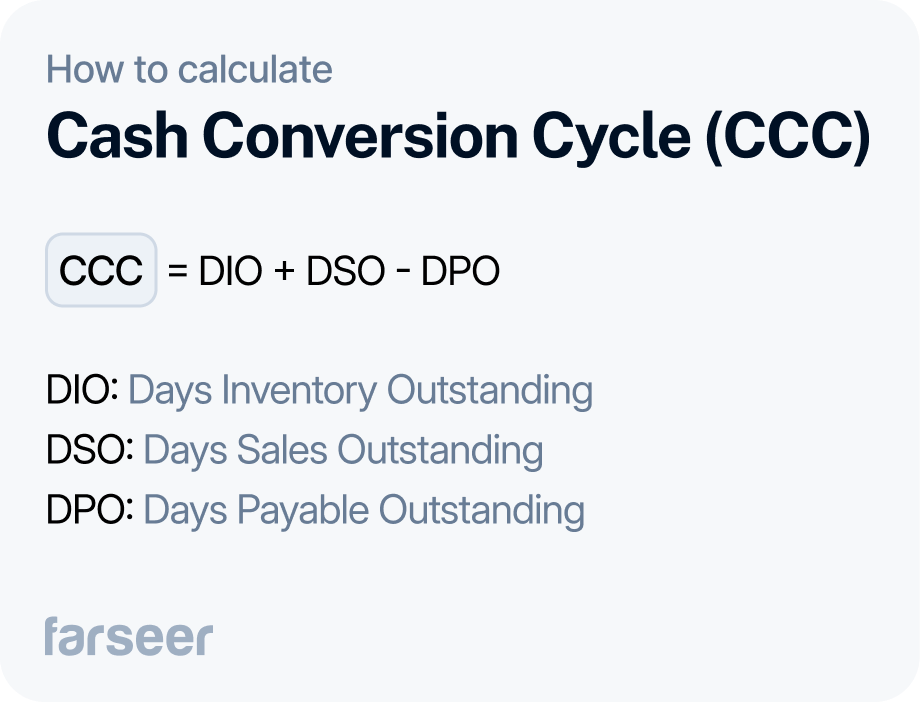
Example:
If DIO is 40 days, DSO is 30 days, and DPO is 20 days:
CCC = 40 + 30 – 20 = 50 days
This means it takes 50 days to convert inventory and receivables into cash.
To learn more about CCC, check out Cash Conversion Cycle blog.
Budget Variance
What it measures
Budget Variance shows the difference between your actual spending and your planned budget.
Why it matters
It helps identify where spending is off track, so you can adjust plans and improve cost management. A positive variance means you’re under budget, while a negative variance indicates overspending.
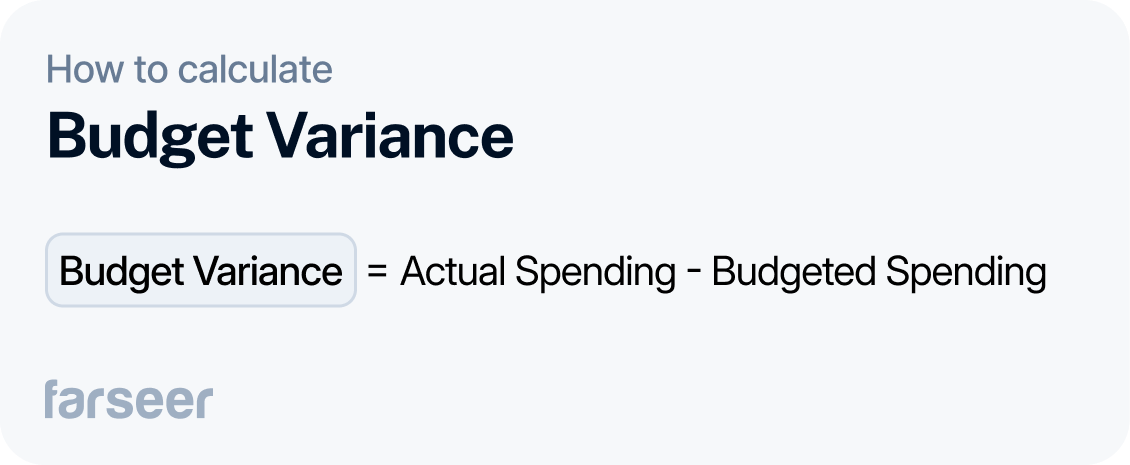
Example:
If your budgeted spending was $200,000 but actual spending was $220,000:
Budget Variance = $220,000 – $200,000 = -$20,000
This means you overspent by $20,000. Monitoring this metric helps keep your financial plans on track.
Cost of Goods Sold (COGS)
What it measures
COGS tracks the direct costs of producing goods sold during a specific period, including materials and labor.
Why it matters
This metric is essential for calculating profitability. Lowering COGS can improve gross profit margins, while rising COGS may signal inefficiencies or increasing supplier prices.
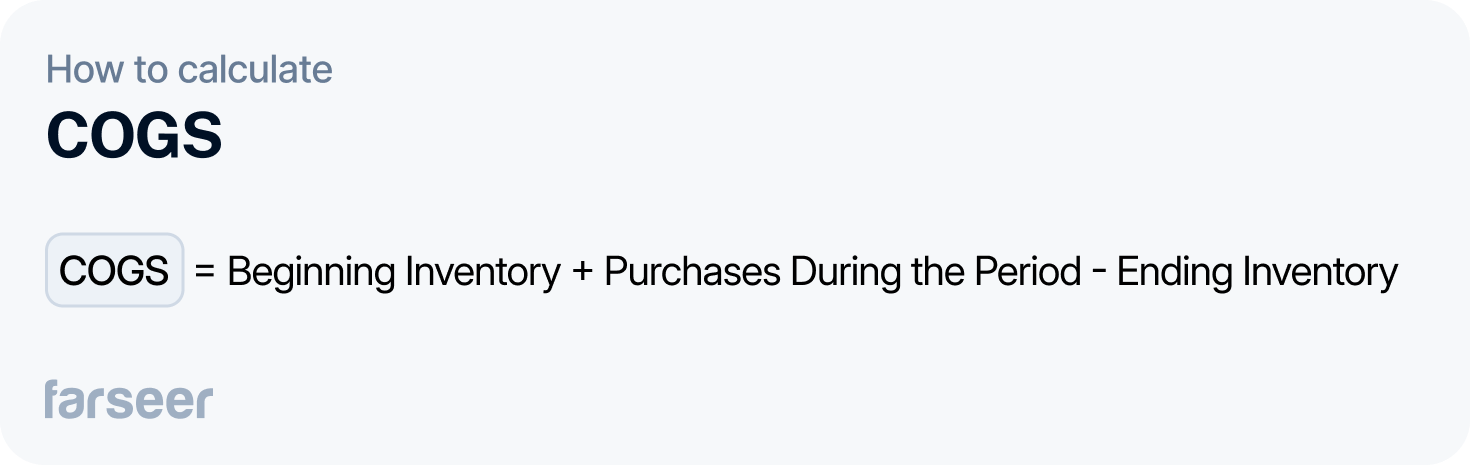
Example:
If your beginning inventory is $50,000, purchases are $150,000, and ending inventory is $40,000:
COGS = $50,000 + $150,000 – $40,000 = $160,000
This means your business spent $160,000 on producing goods sold during the period.
Labor Cost as a Percentage of Revenue
What it measures
It calculates the percentage of revenue spent on employee wages and related labor costs.
Why it matters
It helps you monitor workforce efficiency. A lower percentage indicates better cost control, while a higher percentage might suggest inefficiencies or overstaffing.
Example:
If your total labor costs are $500,000 and your revenue is $2,000,000:
Labor Cost as a Percentage of Revenue = ($500,000 ÷ $2,000,000) × 100 = 25%
This means 25% of your revenue is spent on labor.
How to Solve Finance Department KPI Tracking Challenges
Tracking KPIs isn’t always easy. Finance teams often face these common issues:
- Scattered data: KPIs are spread across systems like ERP, CRM, and accounting tools, making it hard to get a full picture.
- Inaccurate numbers: Manual data entry errors or delays lead to unreliable insights.
- Tracking too many KPIs: Monitoring too many metrics can overwhelm your team and make it harder to focus on what matters.
How to Fix It
- Centralize your data: Tools like Farseer bring all your metrics into one place for accurate, real-time tracking.
- Focus on fewer KPIs: Stick to 5–10 key metrics that align with your goals.
- Use dashboards: Dashboards help you track trends, set alerts, and ensure everyone has access to the same information.
By addressing these challenges, your team can save time, improve accuracy, and focus on delivering results.
Conclusion
Tracking the right KPIs makes it easier to keep your business on track. The 15 metrics in this blog cover the most important areas—profits, cash flow, efficiency, expenses, and debt. By focusing on just a few KPIs that match your goals, you can spend less time on irrelevant data and more time improving results.
Use tools like Farseer to bring your data together and make tracking simple. Start with 5–10 KPIs that matter most to your business, and build from there. With the right approach, your finance team can make smarter, faster decisions.

FAQ
What are the most important KPIs for a finance department to track?
Key finance KPIs include Gross Profit Margin, EBITDA, Current Ratio, Working Capital, Cash Conversion Cycle, and Budget Variance. They help track profitability, liquidity, and efficiency.
How do finance KPIs improve decision-making?
KPIs help finance teams spot problems early, improve cash flow, control costs, and make better strategic decisions based on real data.
Which KPIs measure cash flow and liquidity?
The most common liquidity KPIs are Current Ratio, Quick Ratio, Working Capital, and Cash Conversion Cycle (CCC).
How should finance teams choose the right KPIs?
Teams should choose KPIs that match their business goals, daily responsibilities, and the financial areas they want to improve.
What are the biggest challenges in tracking finance KPIs?
Common challenges include scattered data, manual reporting errors, and tracking too many metrics. Automation and centralized dashboards help solve these issues.

A Complete Guide to Financial Statement Analysis for Strategy Makers
Read more
Best Financial Analysis Tools in 2026: Compare Features & Pricing
Read more