How to Get Started With Spend Analysis

You think you have a handle on spending, but spend analysis often tells a different story.
It breaks down expenses, spots inefficiencies, and reveals opportunities to cut costs-giving finance teams the clarity they need to make better decisions.
Read: Strategic Financial Planning: How to Plan for Success
This is particularly important for mid-to-large companies, where spending is spread across many departments and vendors. In fact, research shows that companies using spend analysis can cut procurement costs by up to 15%.
In this blog, we’ll break down the key components of spend analysis, the common challenges finance teams face, and best practices to maximize cost savings. Let’s get into it.
4 Key Components of Spend Analysis
A strong spend analysis process starts with clean, organized data. But with expenses coming from different departments, vendors, and systems, getting that clarity can be a challenge. Here’s how finance teams can break it down step by step.
1. Data collection: bring all your spend data together
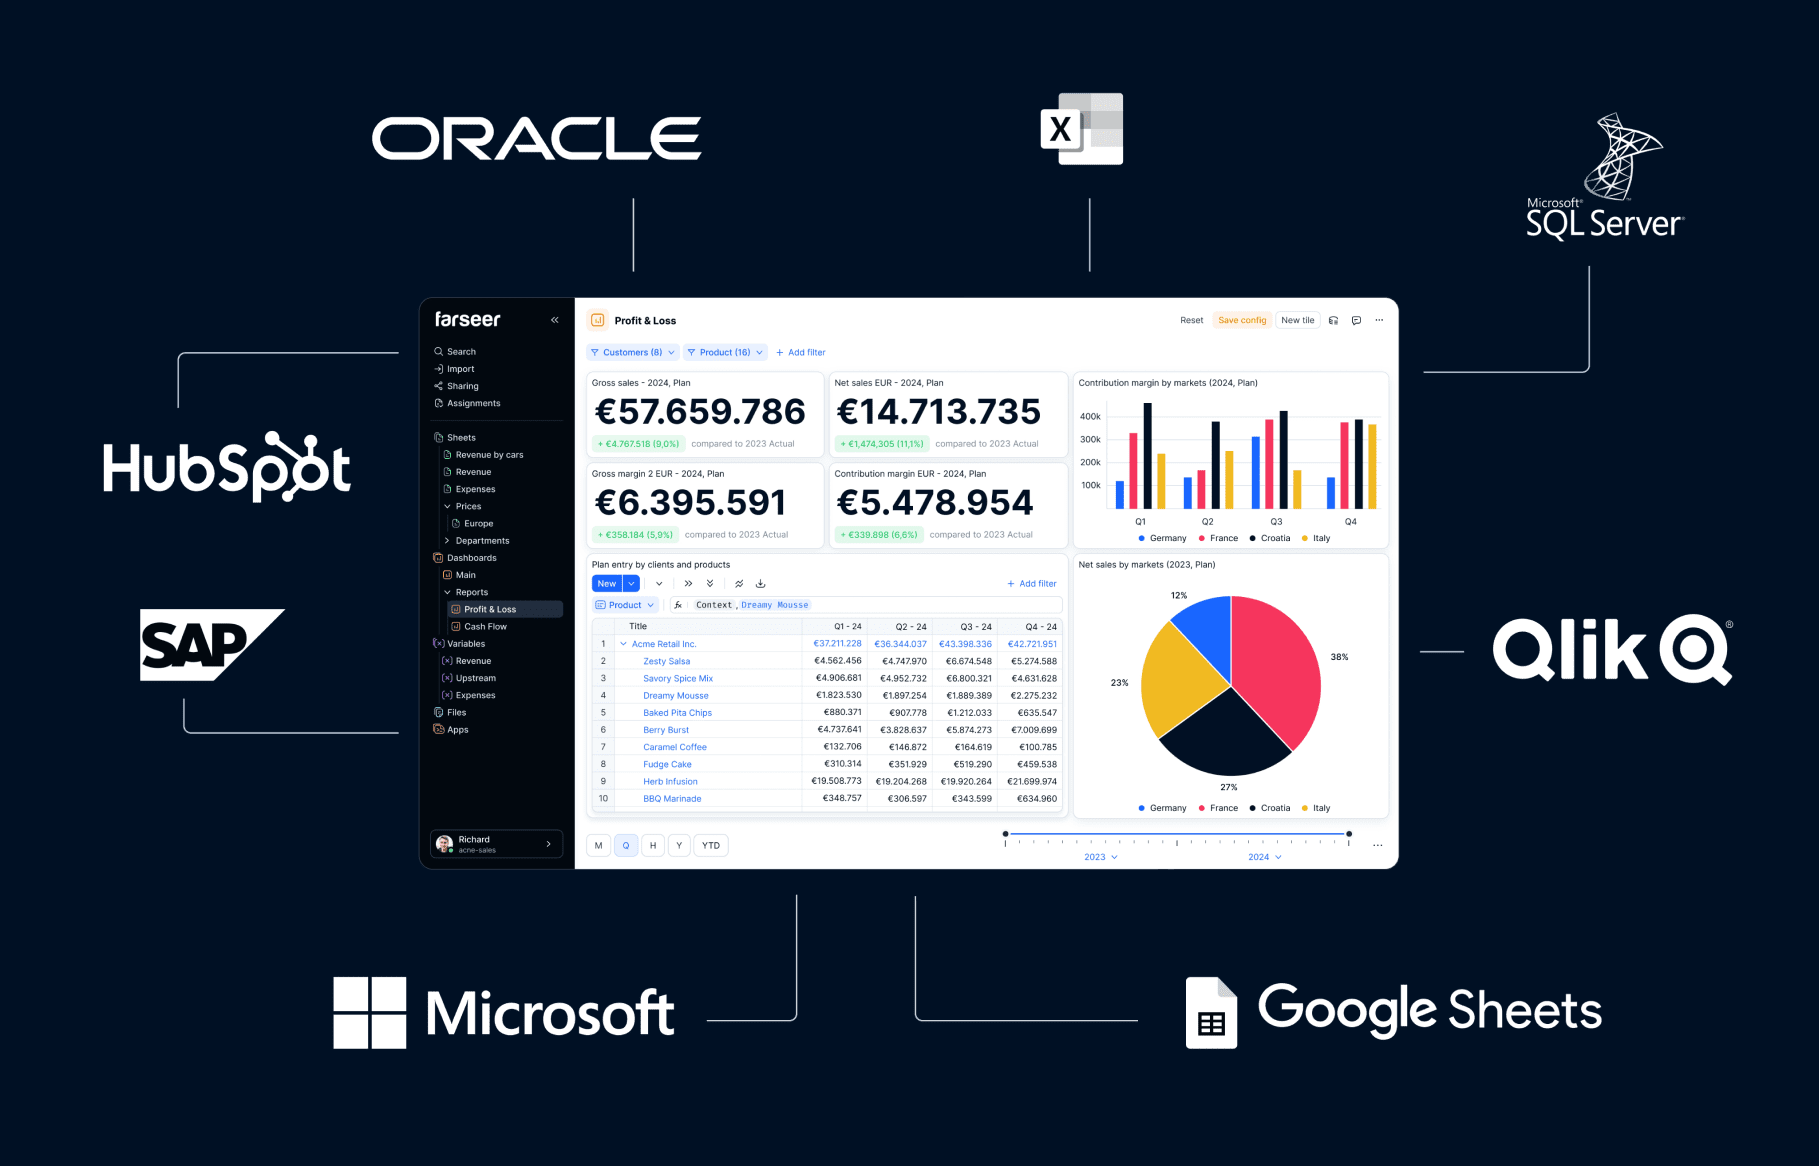
The first step in spend analysis is to always centralize all your spend data in one place. Now this may sound extremely simple if you work in a small company. But with the size and the number of departments – the situation gets a bit more complicated. Spend data is often spread across different ERP systems, procurement platforms, invoices, and, of course, spreadsheets. So collecting all of these in one place is your starting point. Without a complete dataset, identifying inefficiencies or cost-saving opportunities becomes nearly impossible.
Bonus tip: Set up integrations between your ERP, procurement, and accounting systems to automate data collection. This ensures real-time updates and reduces the risk of missing critical spend data.
2. Data classification: organize expenses
Once you’ve collected all spend data, the next step is to categorize expenses properly – including classifying them as CapEx or OpEx, since they’re handled differently in financial planning. Understanding the difference helps finance allocate budgets more effectively and align spending with business goals.
Standardizing classifications is key – when all departments follow the same expense structure, it’s easier to compare costs, track trends, and spot inefficiencies.
Bonus tip: To avoid confusion create a standardized expense taxonomy that all departments follow. Whether you use UNSPSC codes, custom categories, or industry standards, keeping classifications consistent ensures accurate comparisons and better insights across the organization.
3. Spend Analysis Cleanup: Fix Errors and Remove Duplicates
Raw spend data is rarely perfect. Duplicate transactions, missing supplier details, or inconsistent categorizations can lead to misleading analysis. So your next step should be to clean and normalize the data. In this way you make sure you ensure that finance teams will make decisions based on reliable numbers.
Bonus tip: Use AI-powered tools to automatically detect duplicates, standardize supplier names, and flag inconsistencies. This speeds up the process and ensures cleaner, more reliable spend data.
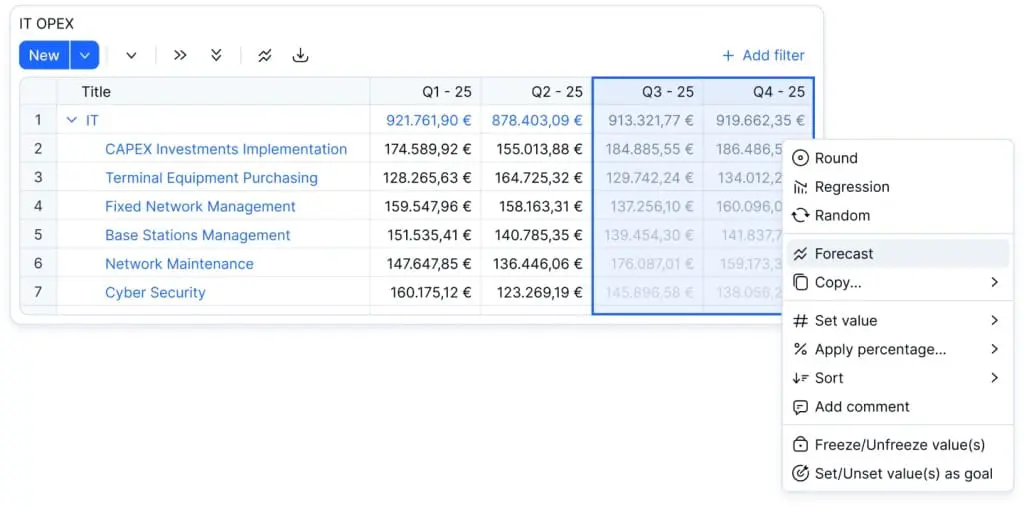
4. Analysis & insights: identify cost-saving opportunities
Once the data is cleaned up, finance teams can easily spot ways to save – like picking the best vendors for discounts, cutting unnecessary costs, or tweaking payment terms to keep cash flowing.
Bonus tip: Use dashboards and visual reports to spot trends, compare vendor costs, and identify savings opportunities in a matter of seconds. A clear visual representation makes it easier to communicate insights and take action quickly.

Common Challenges in Spend Analysis
Spend analysis can help cut costs, but it’s not always easy. Many finance teams deal with messy data, lack of visibility, and errors that make it hard to get the right insights. Here are some common challenges and how they affect decision-making.
Difficulties in tracking indirect spend
While direct costs (like raw materials or production expenses) are easy to track, indirect spend (such as software subscriptions, office supplies, and travel expenses) often slips through the cracks simply because teams don’t collaborate well enough. Since these expenses are spread across multiple teams, they’re harder to monitor and optimize without a clear spend analysis process.
Let’s say your various departments are in need of project management tools. If communication is poor and teams don’t work in sync, different departments might end up purchasing duplicate tools, increasing overall spend. Shifting from a top-down budgeting model to a more dynamic bottom-up approach allows teams to take ownership of their budgets, improving visibility into these costs. With more accurate forecasting and spending accountability, companies can catch these inefficiencies early and consolidate expenses before unnecessary costs pile up.
And it’s not such a rare occurrence. Many companies miss out on savings because they don’t have full visibility into their spending. A structured spend analysis process ensures that businesses catch these inefficiencies early and make better financial decisions.
Lack of real-time data
Many companies rely on quarterly or annual reports to review spending, which means they only catch problems after they’ve already happened. Without real-time insights, finance teams can’t act proactively and adjust budgets or spending strategies on the go.
Sometimes it’s your internal processes that get changed (like a different policy on reimbursing employees for business trips) or it can be a change in the market (e.g. different cost of raw materials), either way, if you’re not tracking spending in real-time, you lose a lot of opportunities for saving.
Best Practices for Effective Spend Analysis
Getting spend analysis right is both about collecting data and making it actionable.
To avoid wasted time and inaccurate insights, companies need the right strategies and tools in place. Here are four best practices to improve spend analysis and drive better financial decisions.
Use FP&A Tools to Automate Spend Analysis
Let’s be real for a second – manually gathering spend data from all over the place is like trying to juggle while blindfolded. You’re pulling information from different systems, spreadsheets, emails, even sticky notes. It’s super time-consuming, and guess what? A tiny mistake in one of those entries could snowball into big problems later on.
But here’s where modern FP&A tools come to the rescue. These tools are like the superheroes of finance. Instead of getting stuck in the data mess, they automate the whole process. Data gets collected from your procurement systems, ERPs, and accounting software with zero manual effort. And the best part: the data gets cleaned up. The tool makes sure everything matches, eliminates inconsistencies, and ensures you have accurate information in real-time.
What does this mean for you? Your finance team is always equipped with the freshest, most reliable insights, ready to make informed decisions without stress.
Establish clear spend control policies
Alright, imagine this: you’ve got a budget, you’ve got spending limits, and you’ve got a team that’s trying to keep everything on track. Now, without clear rules and boundaries, things can get a little… off. And before you know it, your spend is all over the place.
That’s why you need well-defined rules for approvals, budgets, and spending limits to keep everyone aligned with company goals. These policies show your teams exactly what they can and can’t do, helping them avoid accidental (or intentional) overspending.
Think of it this way: When everyone knows where the line is, they’re less likely to cross it. Clear policies help pinpoint areas where teams make unauthorized purchases or overspend – before it becomes a big problem.
Create spend forecasts for better budget planning
Let’s say you’re planning for the year ahead, and you want to make sure your budget is solid. By digging into your past spending habits and factoring in market trends, you can project what your future expenses will look like. It’s like making an educated guess, but with data and insights as your superpower – especially when using a bottom-up approach to ensure forecasts are built from real numbers rather than top-down estimates.
For example, let’s say last year you noticed a pattern where you spend more on marketing during the holiday season. With that knowledge, you can forecast for it and increase your marketing budget accordingly – avoiding any last-minute panic when the bills start rolling in. Plus, it helps you balance your spend analysis across different areas, ensuring you’re not overspending in one place and leaving other important projects in the dust.
Read: CFO Budget Planning: Is Your Current Process Slowing You Down
Use benchmarking to compare spending trends
Comparing your spending trends against industry benchmarks or your own past data gives you a sense of where you might be overspending or missing out on cost-saving opportunities. It’s like holding up your budget against a side-by-side comparison of others in your field – suddenly, those hidden inefficiencies become extremely obvious. Maybe you’re paying too much for a certain supplier, or perhaps there’s a smarter way to allocate your marketing dollars.
Once you spot these trends, you can jump into action: renegotiate supplier contracts, adjust budgets to align with more realistic expectations, or tweak your procurement strategy to get better value.
Turn Spend Data into Smarter Decisions
Effective spend analysis is primarily about one thing: making better financial decisions. By collecting and standardizing data, leveraging automation, and using AI-driven insights, companies can cut costs, improve procurement efficiency, and gain a clearer view of their financial health.
Key takeaways from this blog:
- Clean, categorized data is the foundation of accurate spend analysis.
- Automation reduces manual work and ensures real-time visibility.
- AI-powered tools help eliminate errors and improve spend classification.
- Benchmarking spending trends helps uncover inefficiencies and savings opportunities.
Without a structured spend analysis process, companies risk wasted resources, missed savings, and poor financial planning. But when done right, it becomes a strategic advantage – helping finance teams optimize budgets, negotiate smarter, and improve overall profitability.
Now the question is again: Does your company truly know where its money is going? If not, it’s time to take spend analysis seriously.