For most mid-sized organizations, the close takes three to five business days. Highly automated companies may close in one to three days, while complex multi-entity businesses may require five to ten days. The goal is not just speed, but accuracy and consistency.
Inside FP&A
FP&A Monthly Calendar

Introduction
Financial Planning and Analysis (FP&A) is the strategic finance function responsible for budgeting, forecasting, financial modelling, and performance reporting within an organization. While accounting tells you what happened, FP&A tells you why it happened, what it means, and what the business should do next. It sits at the crossroads of data and strategy, making it one of the most influential functions in any company.
At the heart of every effective FP&A function lies a disciplined monthly cadence. Think of it as the operational rhythm that keeps the entire finance engine running on time. Without it, teams drown in ad-hoc requests, miss deadlines, and spend most of their energy firefighting rather than advising the business. With it, FP&A becomes a predictable, high-impact machine that stakeholders trust and rely on.
Before most FP&A teams improve their cadence, they have to confront a hard truth. The monthly cycle rarely breaks because of effort. It breaks because processes scale faster than systems. As companies grow, transaction volumes increase, stakeholders multiply, and manual workarounds quietly become structural bottlenecks. What once felt manageable turns into constant firefighting. Without intentional design, the monthly cadence becomes reactive by default.
If you are a new FP&A analyst stepping into the role for the first time, understanding this monthly cadence is arguably the single most important thing you can learn in your first ninety days. It will shape how you prioritize your work, manage your calendar, interact with business partners, and ultimately deliver value. This article walks you through the structure, activities, best practices, and common pitfalls of a world-class FP&A monthly calendar so you can hit the ground running.
Download the Free FP&A Monthly Calendar Excel Template
Understanding the FP&A Monthly Calendar
An FP&A monthly calendar is a structured schedule that maps every major finance activity to specific business days within the month. Its purpose is straightforward: create predictability. When every stakeholder knows exactly when the books close, when variance reports are due, when forecasts are updated, and when business reviews happen, the entire organization operates more efficiently.
What Governs the Calendar
The calendar is primarily anchored to the month-end accounting close. Once the accounting team finishes recording transactions, reconciling accounts, and locking the trial balance, FP&A takes over to analyse results, prepare reports, update forecasts, and communicate insights to leadership. Quarters and year-end add additional layers, including board reporting, audit preparation, and annual planning.
Read: What Great Financial Reporting and Analytics Actually Look Like
Core Components
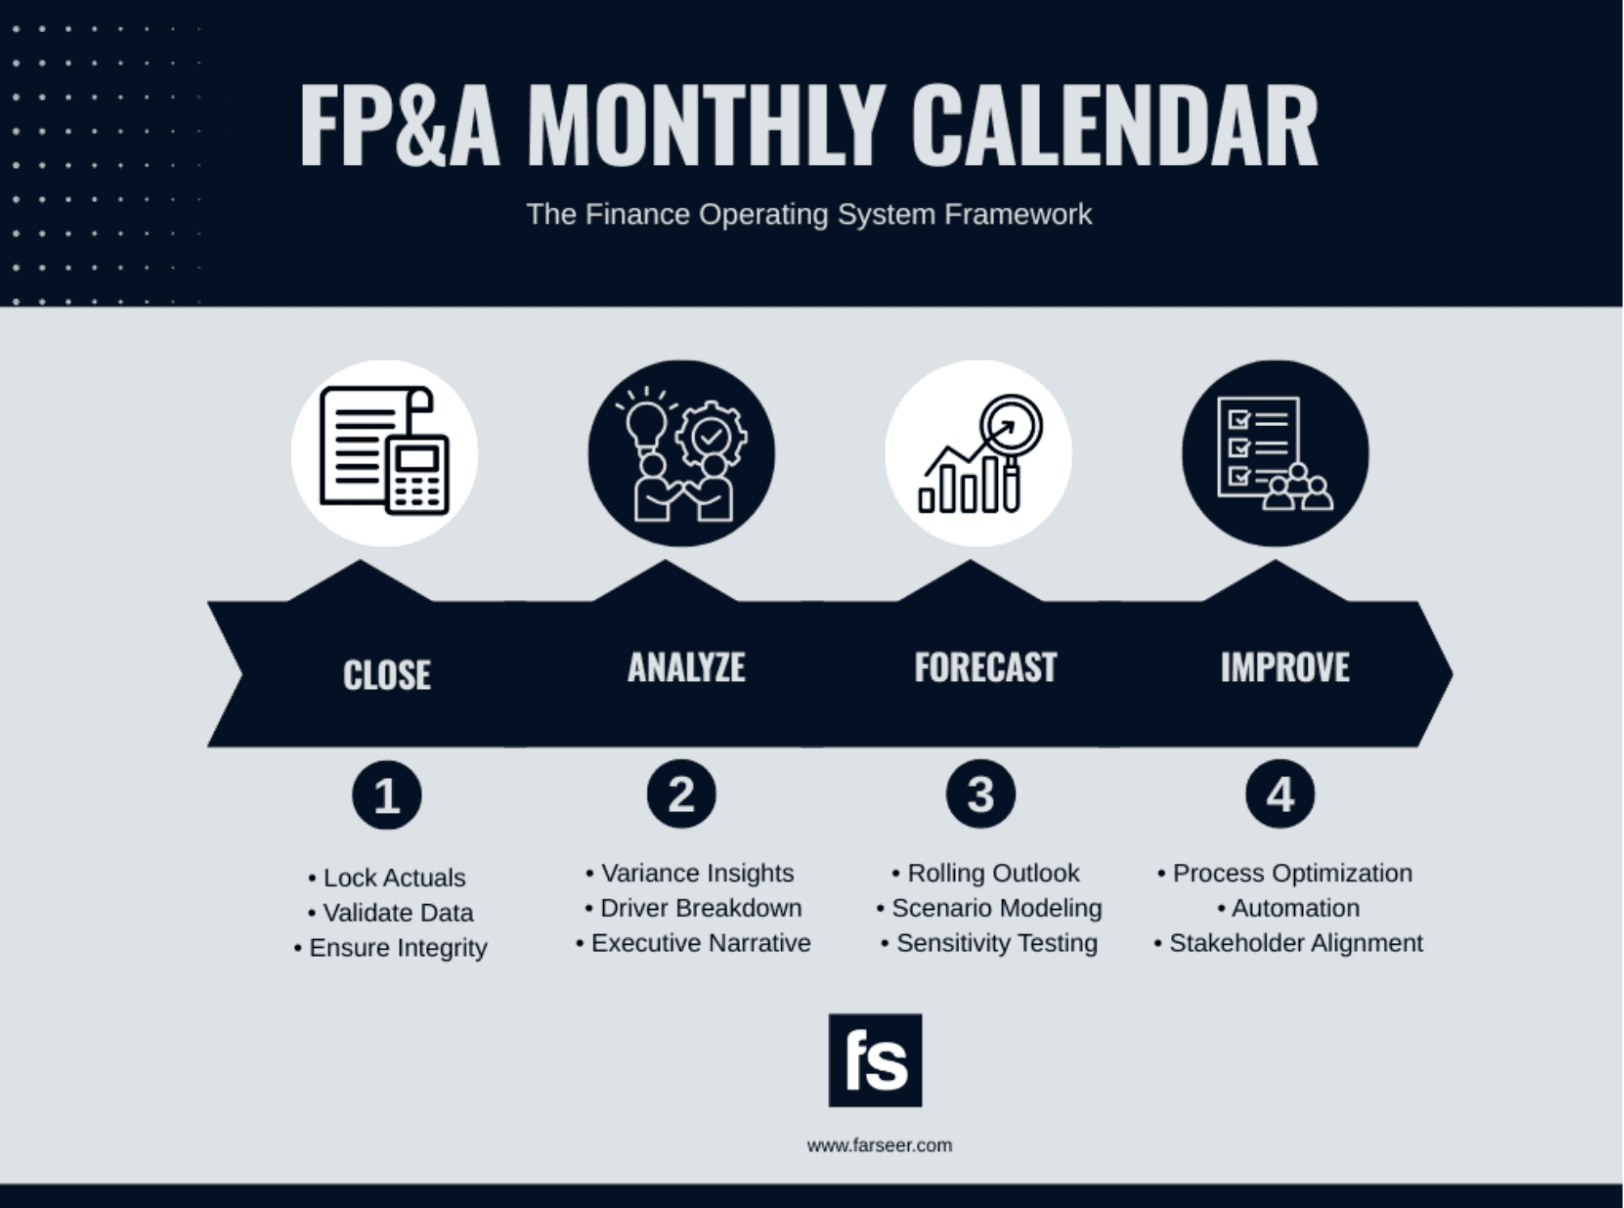
A typical FP&A monthly calendar is divided into four distinct phases, each spanning roughly one week of business days.
- Phase one covers the month-end close and data collection, which usually runs from business day one through day five.
- Phase two encompasses analysis and reporting, spanning days six through ten.
- Phase three is dedicated to forecasting and planning, running from days eleven through eighteen.
- Phase four, covering the remaining days of the month, focuses on strategic projects, process improvement, and preparation for the next cycle.
The exact timeline varies depending on company size, industry complexity, team maturity, and technology stack. Larger, multi-entity organizations may need longer close periods, while well-automated teams at leading companies can close their books in as few as one to three business days. For a new analyst, the key takeaway is this: know your company’s specific calendar, understand where each phase starts and ends, and plan your work accordingly.
Read: Financial Reporting Automation – What It Actually Fixes (And Doesn’t)
New Analyst Tip
Build a close checklist in your first month. List every data source, every deadline, and every person you need to follow up with. This single document will save you hours of confusion in subsequent months.
Key Phases of the Monthly Cadence
Phase 1: Data Collection and Month-End Close (Days 1–5)
The monthly cycle begins the moment the calendar flips to a new month. The accounting team records final transactions from the prior month, including sales, payroll, accounts payable, and inventory adjustments. They post manual accruals, complete intercompany eliminations, and reconcile key balance sheet accounts such as cash, accounts receivable, and accounts payable.
As an FP&A analyst, your role during this phase is not passive. Proactive teams communicate expense-report deadlines to business partners before month-end, review contracts to support accrual entries, and run preliminary reports to identify anomalies early.
During the close itself, you should monitor progress, flag delays, review preliminary data for obvious errors, and validate accruals with department heads. By the end of day five, the trial balance is usually locked by accounting and preliminary financials submitted to FP&A for analysis.
Phase 2: Analysis and Reporting (Days 6–10)
This is where FP&A transforms numbers into actionable insights. The core activity is variance analysis: comparing actual results against budget, the latest forecast, the prior period, and the prior year. You will examine revenue drivers such as volume, price, and mix; dissect the cost structure and operating leverage; analyse margins by product or segment; track operating expense trends; review cash flow movements; and evaluate key performance indicators.
Once the analysis is complete, you build the monthly financial package. A standard package typically includes a one-page executive summary, an income statement with variance commentary, balance sheet highlights, a cash flow statement, a KPI dashboard, and segment-level performance detail. Department-specific reports with budget-versus-actual analysis, headcount metrics, and project spend tracking round out the deliverables.
The phase closes with stakeholder review meetings. These typically follow a structured format: a financial performance summary lasting ten to fifteen minutes, a variance deep-dive of twenty to thirty minutes, a business driver discussion, a forward outlook, and a question-and-answer session with documented action items. For quarter-ends, this phase also includes board materials preparation.
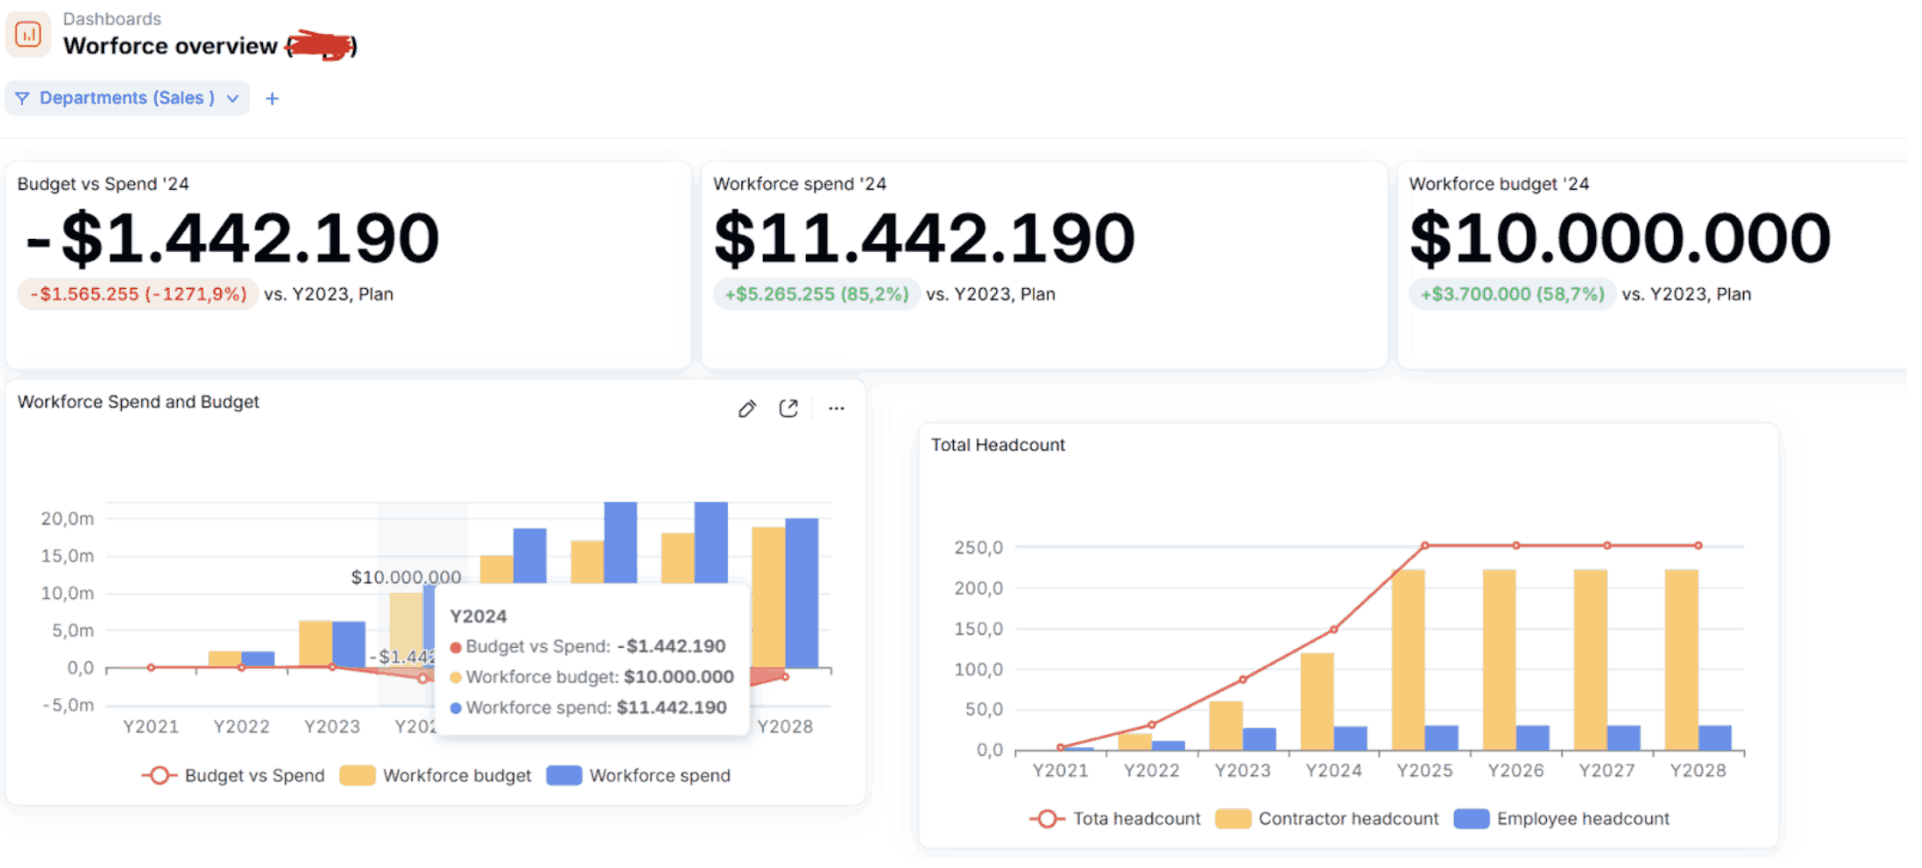
Farseer in Action
Once actuals are loaded, Farseer’s no-code dashboards allow analysts to compare actuals against budget, prior forecast, prior period, and prior year all within a single interactive view. Because the calculation engine operates across entire tables rather than individual cells, variance analysis that once required dozens of spreadsheet tabs can be performed in a unified model.
The platform generates real-time reports segmented by product, region, cost centre, or any dimension the team has defined. Analysts can drill down from a consolidated P&L to individual line items in seconds, and the results automatically feed into shareable dashboard views that stakeholders can access without waiting for a static PDF to be distributed.
Phase 3: Forecasting and Planning (Days 11–18)
With the backward-looking work complete, FP&A shifts its focus forward. World-class teams maintain rolling forecasts, most commonly a twelve-month rolling horizon updated monthly, that provide continuous visibility into the future. The process begins with gathering the latest intelligence: sales pipeline updates, market trend analysis, competitive intelligence, operational changes like new hires or project launches, and external factors such as economic conditions or regulatory shifts.
Next, you update the forecast drivers. Revenue assumptions around volume, price, and timing are refreshed. Cost drivers including headcount plans, vendor contracts, and inflation expectations are revisited. Working capital requirements, capital expenditure plans, and cash flow projections are all recalibrated. Leading teams then build scenarios: a base case representing the most likely outcome, an upside case, a downside case, and sometimes a management case adjusted for strategic initiatives.
The phase wraps up with cross-functional validation. Department heads review and sign off on their respective forecasts, sensitivity analysis is performed on key assumptions, and the updated outlook is compared against budget and prior forecasts before being presented to executive leadership.
Farseer in Action
This is where Farseer’s modelling capabilities deliver the greatest leverage.
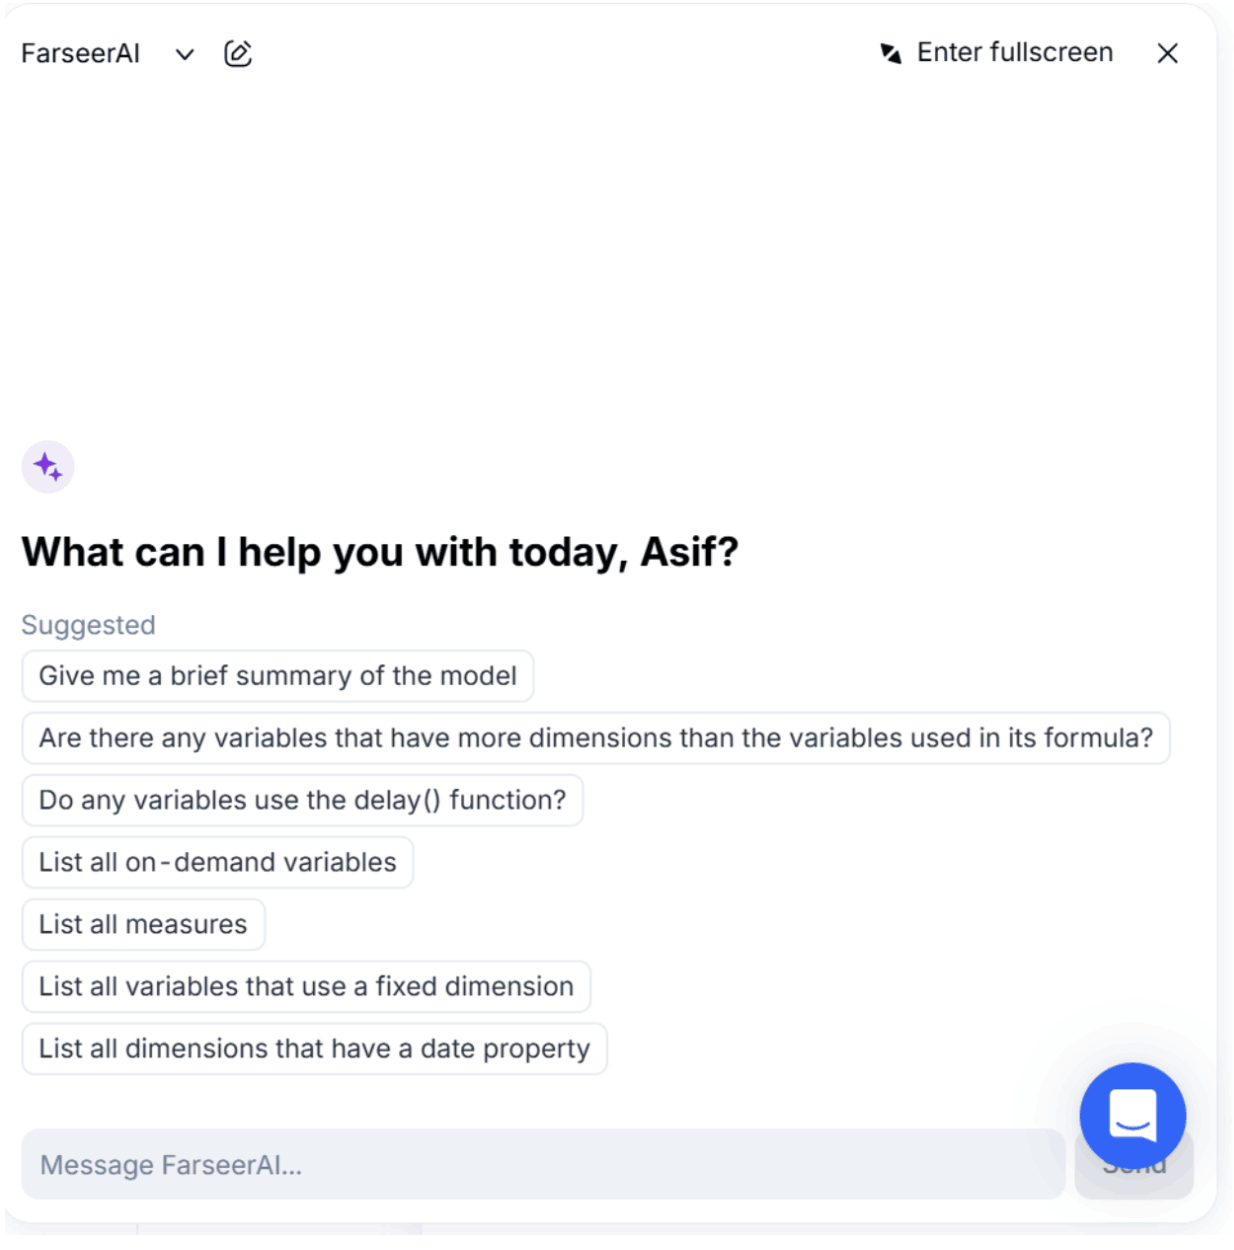
The platform supports driver-based forecasting natively: revenue models can be built from operational inputs like customer acquisition rates, pricing tiers, and churn, while cost models flow from headcount plans, vendor contracts, and utilization rates. Formulas are written in natural language rather than cell references, making models easier to build, audit, and maintain.
The scenario planning module lets teams create and compare base, upside, and downside cases side by side adjusting key assumptions and seeing the full financial impact recalculate instantly across all statements.
FarseerAI further accelerates this phase by generating forecasts in seconds based on historical patterns, giving analysts a data-driven starting point to refine with business judgement.
Cross-functional input collection is also streamlined. Farseer’s public assignments feature allows the FP&A team to generate temporary, pre-filled data collection forms that department heads can review, edit, and approve all of which automatically integrate back into the central model without manual consolidation.
This eliminates the version-control chaos that plagues spreadsheet-based forecasting processes.
Phase 4: Strategic Projects and Next-Month Preparation (Days 19–End of Month)
With the core monthly deliverables complete, world-class FP&A teams dedicate the final week to high-value strategic work. This includes process improvement initiatives such as analysing the close timeline for bottlenecks and implementing automation, long-range planning activities like annual budget preparation and three-to-five-year strategic modelling, and deep-dive business partnering such as ad-hoc analysis, department consultations, and profitability studies by customer or product.
Read: Why Finance Teams Are Moving to Continuous Budgeting
The last few days are reserved for preparing for the next cycle: publishing the upcoming close calendar, scheduling key meetings, communicating deadlines to stakeholders, and updating task assignments.
A post-close retrospective meeting captures lessons learned and identifies opportunities for improvement. This continuous learning loop is what separates good teams from great ones.
Best Practices of World-Class FP&A Teams
Publish a Clear, Consistent Calendar
Top-performing teams publish an annual FP&A calendar with all key dates and distribute monthly close calendars two to three weeks in advance.
Every deadline has a clear owner, and adherence is tracked and discussed openly. For a new analyst, this means one thing: get the calendar into your personal workflow system immediately and set reminders for every critical milestone.
Separate the Close from the Analysis
Accounting closes the books; FP&A analyses the results.
Blurring these roles creates confusion and delays. The best teams maintain daily touchpoints with accounting during close weeks but respect the division of labour. Some FP&A teams wait until close completion before starting analysis; others provide feedback during the close to catch errors early. Understand which model your organization follows and calibrate your workflow accordingly.
Lead with Insights, Not Just Data
The difference between a junior analyst and a trusted business partner often comes down to the ability to move beyond data to insight.
Raw numbers tell stakeholders what happened. Information organizes and contextualizes those numbers. Insights explain why something happened and what it means. Recommendations tell leadership what to do about it. World-class teams train every analyst to climb this hierarchy with every report they produce.
Embrace Driver-Based Forecasting
Rather than forecasting line items in isolation, leading teams link operational metrics directly to financial outcomes. Revenue forecasts are built from customer acquisition rates, retention percentages, pricing, and volume.
Cost forecasts flow from headcount plans, vendor contracts, and utilization rates. This approach makes forecasts more accurate, more defensible, and easier to update when assumptions change.
Invest in the Right Technology
The modern FP&A tech stack typically includes an ERP system like NetSuite or SAP as the system of record, a corporate performance management platform such as Anaplan, Adaptive Insights, or Planful for planning and forecasting, a business intelligence tool like Tableau or Power BI for visualization, and collaboration tools for task tracking and process documentation.
However, the cardinal rule is process before technology. A well-designed process amplified by good tools will always outperform expensive software layered on top of a broken workflow.
Technology alone does not fix a broken process. But the absence of the right architecture almost guarantees inefficiency. Many FP&A teams operate across a fragmented stack:
- ERP for actuals.
- Spreadsheets for forecasting.
- Email for version control.
- BI tools for dashboards.
On paper, each tool works. In practice, the handoffs create friction. Data has to be exported, adjusted, re-uploaded, reconciled, and validated repeatedly.
Version control becomes manual. Scenario modelling takes hours instead of minutes.
And collaboration turns into attachment management. World-class FP&A teams design their technology around integration, not accumulation.
The goal is simple: One connected planning environment where actuals, forecasts, drivers, and scenarios live in the same system — updated in real time and visible to the right stakeholders.
When this happens: The close shortens because data flows automatically. Forecasts update faster because drivers are connected. Scenario modelling becomes practical instead of theoretical. Finance spends more time advising and less time reconciling.
The modern finance stack typically includes:
- An ERP system as the system of record.
- A planning platform that connects operational drivers to financial models.
- Visualization tools for executive reporting.
- Workflow systems for task management and collaboration.
But the most important principle is this: Process discipline first. Integrated architecture second. Automation third. When those elements align, the monthly cadence transforms from a reactive reporting cycle into a decision engine.
This is precisely why modern planning platforms have emerged as a critical layer in the finance stack. Rather than stitching together spreadsheets, emails, and disconnected tools, leading organizations are moving toward integrated planning environments that unify actuals, drivers, forecasts, and collaboration in one system.
Platforms like Farseer are designed around this principle: connecting financial models to operational reality so finance teams can focus less on reconciliation and more on decision support.
Build Strong Business Partnerships
FP&A’s ultimate value comes not from the reports it produces but from the influence it has on business decisions. The best teams embed finance partners within key functions, attend department meetings, speak the language of the business rather than just finance jargon, and proactively deliver insights instead of waiting to be asked.
For a new analyst, this means investing time in understanding what your business partners care about, what pressures they face, and how finance can help them succeed.

Challenges and Solutions
Long Close Cycles
One of the most common pain points in FP&A is a month-end close that stretches beyond ten business days, leaving little time for analysis and strategic work. The root causes are usually manual data entry, delayed submissions from business partners, and complex multi-entity consolidations.
Solutions include automating reconciliations with tools like BlackLine or FloQast, implementing a continuous close approach where certain activities are completed throughout the month rather than at month-end, setting hard submission deadlines with accountability, and running weekly flash reports to build the close muscle.
Inaccurate Forecasts
Forecasts that consistently miss the mark erode credibility and lead to poor decision-making. This often stems from relying on static annual budgets, being disconnected from operational reality, or using overly complex models.
The remedy is to implement rolling forecasts with driver-based models, engage business partners regularly for forecast inputs, track forecast accuracy as a formal metric, and focus precision on the near-term horizon of three to six months while acknowledging greater uncertainty further out.
Read: How to Create a Monthly Financial Report in 7 Easy Steps

Manual, Time-Consuming Processes
When the majority of an analyst’s time is spent aggregating data rather than analyzing it, the team cannot deliver strategic value. The path forward involves investing in a centralized planning platform, automating data feeds from the ERP and other source systems, standardizing templates for data collection, and enabling self-service business intelligence so stakeholders can pull their own routine reports.
Weak Business Partnerships
If finance is viewed as a back-office function of order-takers, its influence on strategy will be minimal. Overcoming this requires assigning dedicated FP&A partners to major functions, establishing regular business review cadences, learning the operational details of each department, providing proactive insights rather than just reactive reports, and building trust through consistent, reliable delivery.
Putting It into Practice: Illustrative Examples
A High-Growth SaaS Company
Consider a mid-market software-as-a-service company with two hundred employees and annual recurring revenue of fifty million dollars.
The FP&A team consists of a director, two senior analysts, and one junior analyst. They run a tight four-week cadence: the accounting team closes the books by business day three using NetSuite with automated reconciliations. FP&A delivers flash results to the CFO by day four, a full financial package by day eight, and an updated rolling forecast by day fourteen. The remaining week is split between strategic projects such as pricing analysis and new-market modelling, and preparation for the next cycle.
What makes this cadence effective is the speed of the close, enabled by automation, and the clear separation between reporting and strategic work.
The junior analyst owns the variance commentary and departmental reports, which provides excellent learning exposure, while senior analysts focus on the forecast and strategic analysis.
The team holds a thirty-minute retrospective on the last Friday of every month, tracking metrics like days to close, report timeliness, and forecast accuracy.
A Multi-Division Manufacturing Company
Now consider a manufacturing firm with one billion dollars in revenue across four business units and operations in twelve countries.
The FP&A team is larger: a VP of FP&A, four business unit finance partners, a corporate FP&A manager, and three analysts. The close takes five business days due to multi-entity consolidation and intercompany eliminations. Analysis and reporting run through day twelve, with staggered business unit reviews. The rolling forecast is updated quarterly rather than monthly, but a monthly re-forecast of the current quarter keeps projections fresh.
The distinguishing feature here is the embedded finance partner model.
Each business unit partner attends weekly operations meetings, understands production schedules and supply chain dynamics intimately, and translates that operational knowledge into more accurate financial forecasts.
The corporate FP&A team consolidates the picture and manages board reporting. This structure ensures that financial insights are grounded in operational reality, which is the hallmark of a mature FP&A function.

Conclusion
The FP&A monthly cadence is far more than a scheduling exercise.
It is the operating system of the finance function. In high-performing organizations, cadence is what separates reactive reporting from proactive leadership. A disciplined rhythm of close, analyse, forecast, and partner creates consistency. Consistency builds credibility. And credibility earns finance a seat at the strategic table.
But cadence alone is not enough. Without integrated systems, clear ownership, and connected data flows, even the best-designed calendar eventually breaks under scale. Growth increases transaction volume, cross-functional dependencies multiply, and manual workarounds become structural bottlenecks. What once felt manageable becomes friction.
The organizations that outperform do not simply work harder at month-end. They build architecture that supports the rhythm. They shorten feedback loops. They connect operational drivers directly to financial models. They reduce reconciliation work and increase decision velocity.
For new analysts, mastering the monthly cadence is your foundation. For finance leaders, designing the architecture behind that cadence is the multiplier.
The ultimate goal is not faster reporting.
It is better decisions, made earlier, with greater confidence.
And that is what transforms FP&A from a reporting function into a true strategic engine for the business.
| Your First 90-Day Priority List As a new analyst
Month 1: Document the current cadence, build your close checklist, and learn the chart of accounts. Month 2: Own a deliverable end-to-end, such as a departmental variance report, and build relationships with two to three business partners. Month 3: Propose one process improvement, contribute to the forecast, and present your first insight to leadership. |
FAQ
What is an FP&A monthly calendar?
An FP&A monthly calendar is a structured schedule that outlines the key finance activities completed each month, including month-end close support, variance analysis, forecasting updates, and stakeholder reviews. It creates predictability and ensures finance operates on a disciplined cadence.
How long should a month-end close take?
What is the difference between accounting close and FP&A analysis?
What tools do FP&A teams use for monthly planning?
What is a rolling forecast in FP&A?
A rolling forecast is a continuously updated financial projection, usually covering the next twelve months. Instead of relying solely on an annual budget, teams update assumptions monthly to reflect new business conditions.
How can FP&A improve forecast accuracy?
Forecast accuracy improves when teams adopt driver-based models, collaborate closely with business partners, monitor leading indicators, track forecast variance formally, and shorten feedback loops between actual results and updated projections.
What should a new FP&A analyst focus on in the first 90 days?

Inside FP&A

How Finance Teams Break Out Of Digital Planning Purgatory With Small, Stackable AI Moves
Read more
Inside FP&A

Farseer raises $7.2M Series A to build the Enterprise Operating System for Finance
Read more
Inside FP&A