Top 7 Forecasting Techniques: Every FP&A Professional Should Know

Financial Planning and Analysis (FP&A) professionals occupy a critical position in every organization, serving as the bridge between raw financial data and the strategic decisions that shape a company’s future.
Their mandate extends far beyond routine number-crunching; FP&A teams are responsible for budgeting, financial modelling, variance analysis, and perhaps most importantly forecasting. A reliable forecast can mean the difference between capitalizing on an emerging market opportunity and being blindsided by a downturn.
Forecasting is the engine that drives proactive decision-making. When done well, it enables leadership to allocate resources with precision, manage cash flow with confidence, and set performance targets grounded in reality rather than aspiration.
When done poorly, it creates a cascade of misaligned expectations, missed targets, and eroded trust between finance and the broader business.
In today’s volatile economic landscape marked by supply chain disruptions, rapid technological change, and shifting consumer behaviour, the need for sophisticated forecasting has never been greater. FP&A professionals must draw on a blend of quantitative rigor and business intuition, leveraging multiple techniques to build forecasts that are both accurate and adaptable.
Modern FP&A platforms like Farseer have made it easier than ever to implement and iterate on these techniques, democratizing access to tools that were once the exclusive domain of data science teams.
This article explores seven essential forecasting techniques that every FP&A practitioner should have in their toolkit, examining each through the lens of real-world application, practical benefits, and inherent limitations.
Straight-Line Forecasting
Straight-line forecasting is the simplest and most intuitive method available to FP&A professionals.
It operates on a single, powerful assumption: that the historical growth rate of a given financial metric will continue unchanged into the future. In practice, this means calculating the average percentage change over a defined period and projecting that rate forward. If revenue has grown at an average of 8% annually over the past five years, straight-line forecasting projects that it will continue growing at 8% in subsequent years.
This technique is best suited for stable, mature businesses operating in predictable markets. It provides an excellent baseline for top-line revenue projections, headcount planning, and operational expense budgeting in environments where dramatic shifts are unlikely.
FP&A teams frequently use straight-line projections as the starting point for their annual budget cycle, layering in more nuanced adjustments once the baseline is established.
Practical Example
Consider a mid-market SaaS company with subscription revenue that has grown steadily at 12% year-over-year for the past four years. An FP&A analyst building the initial revenue forecast for the upcoming fiscal year would apply that 12% growth rate to the current revenue base as a starting point.
This baseline forecast then becomes the foundation for discussions with sales leadership about pipeline assumptions, potential upsell opportunities, and churn risks that might cause the actual trajectory to diverge from the straight-line projection. The strength of this approach lies in its transparency. Every stakeholder understands the underlying assumption, making it easy to identify and debate where reality might differ.
Regression Analysis
Regression analysis is a statistical technique that models the relationship between a dependent variable such as revenue, cost, or demand and one or more independent variables that are believed to influence it. Simple linear regression examines the relationship between two variables, while multiple regression incorporates several predictors simultaneously.
The output is a mathematical equation that quantifies how changes in the independent variables are expected to affect the outcome being forecast.
Regression is invaluable when financial outcomes are clearly driven by identifiable factors. Unlike straight-line forecasting, which ignores causation entirely, regression allows FP&A teams to build forecasts that explicitly account for the drivers of performance.
This makes forecasts more defensible in boardroom discussions and more responsive to changing business conditions, because adjusting an input variable automatically recalculates the projected outcome.
Practical Example
A retail FP&A team might build a multiple regression model that forecasts monthly store revenue as a function of foot traffic, average transaction value, marketing spend, and local unemployment rates.
By analyzing three years of historical data, they can quantify the marginal impact of each driver.
For instance, the model might reveal that a 10% increase in digital marketing spend historically correlates with a 3.2% lift in foot traffic, which in turn drives a 2.1% increase in revenue.
After running the regression, suppose the model produces the following fitted equation:
Revenue = β₀ + β₁(X)
Where:
- Revenue = Projected monthly revenue
- β₀ = Base revenue (revenue when marketing spend change is zero)
- β₁ = 0.21 (the elasticity coefficient for every 1% increase in marketing spend, revenue increases by 0.21%)
- X = % change in digital marketing spend
Armed with this information, the team can model the financial impact of proposed marketing budget changes with far greater precision than a simple trend extrapolation would allow.
Read: How to Choose the Right Revenue Forecasting Model for Your Company

Moving Averages
Moving averages smooth out short-term fluctuations in time-series data by calculating the average of a metric over a rolling window of time periods.
- A simple moving average (SMA) assigns equal weight to each period
- A weighted moving average (WMA) gives greater emphasis to more recent observations.
- The exponential moving average (EMA) takes this further by applying exponentially decreasing weights to older data points, making it particularly responsive to recent trends.
The primary advantage of moving averages is their ability to cut through the noise of volatile data to reveal underlying trends. For FP&A teams dealing with businesses that have significant seasonal or cyclical fluctuations such as retail, hospitality, or agriculture. Moving averages provide a clearer picture of the true trajectory. They are also computationally simple and easy to explain to non-technical stakeholders.
However, moving averages are inherently backward-looking; they lag behind sudden shifts in trend direction and cannot anticipate structural breaks or one-time events. They work best as a complement to other techniques rather than as a standalone forecasting method.
Practical Example
An FP&A analyst at a consumer packaged goods company might use a 12-month moving average to forecast monthly sales, thereby neutralizing the impact of holiday spikes, promotional periods, and seasonal lulls.
Suppose raw monthly sales data shows dramatic swings between $2 million in January and $5 million in December. The 12-month moving average smooths these into a trend line that more accurately reflects the company’s underlying growth trajectory, say, steady growth from $3.2 million to $3.6 million in average monthly sales over two years.
This smoothed trend is far more useful for capacity planning, inventory management, and headcount decisions than the raw data.
Scenario Analysis
Scenario analysis is a forecasting technique that involves constructing multiple plausible versions of the future, each based on a different set of assumptions about key variables.
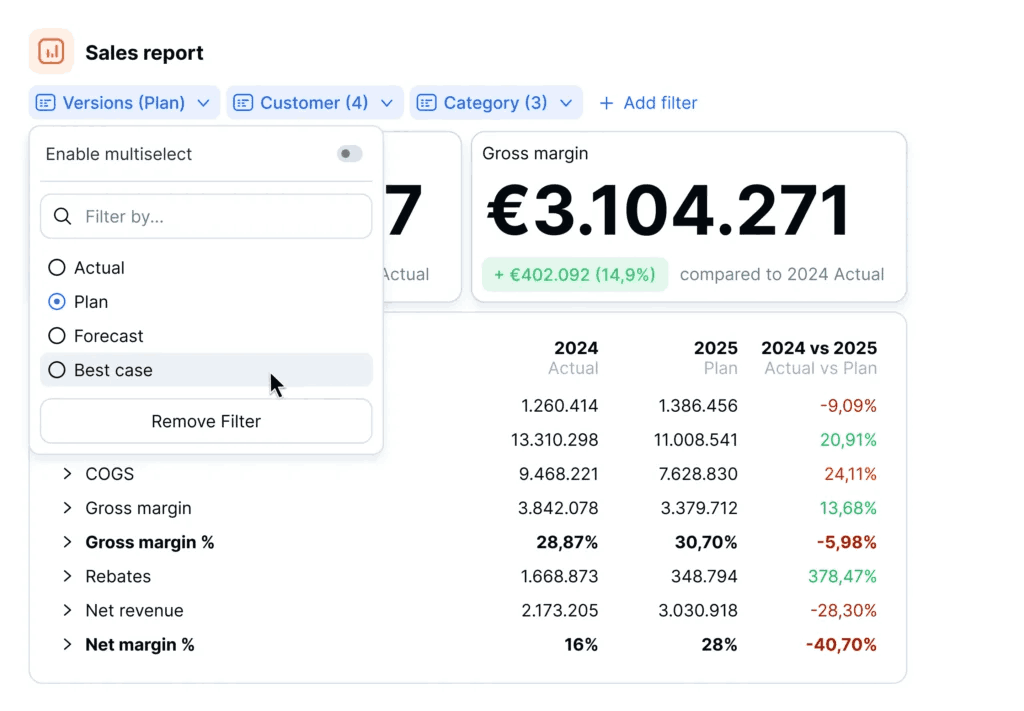
Rather than producing a single-point forecast, scenario analysis generates a range of outcomes. Typically a base case, an optimistic (upside/best) case, and a pessimistic (downside/worse) case allowing decision-makers to understand the spectrum of possibilities and prepare accordingly.
In an era of heightened uncertainty, scenario analysis has arguably become the most strategically important tool in the FP&A practitioner’s arsenal.
It shifts the conversation from “what will happen” to “what could happen, and how prepared we are.” This framing is enormously valuable for executive decision-making because it acknowledges uncertainty rather than pretending it away.
Scenario analysis also facilitates contingency planning: by modeling the financial impact of adverse scenarios, companies can pre-identify trigger points at which they would implement cost-reduction measures, accelerate fundraising, or adjust strategic priorities.
Practical Example
Consider an FP&A team at a manufacturing company entering a year of significant macroeconomic uncertainty. They might construct three scenarios.
- The base case assumes current market conditions persist, with moderate demand growth of 5% and stable input costs.
- The upside case models a scenario where a competitor exits the market, driving demand growth to 12%, while raw material costs decline 8% due to supply chain normalization.
- The downside case envisions a mild recession where demand contracts by 3%, customers extend payment terms, and commodity prices spike 15%.
Each scenario produces a distinct P&L, cash flow projection, and balance sheet forecast. The FP&A team then identifies the key decisions that hinge on which scenario materializes: at what point would they freeze hiring, delay capital expenditure, or draw on their credit facility?
This kind of analysis transforms forecasting from a passive prediction exercise into an active strategic planning tool.
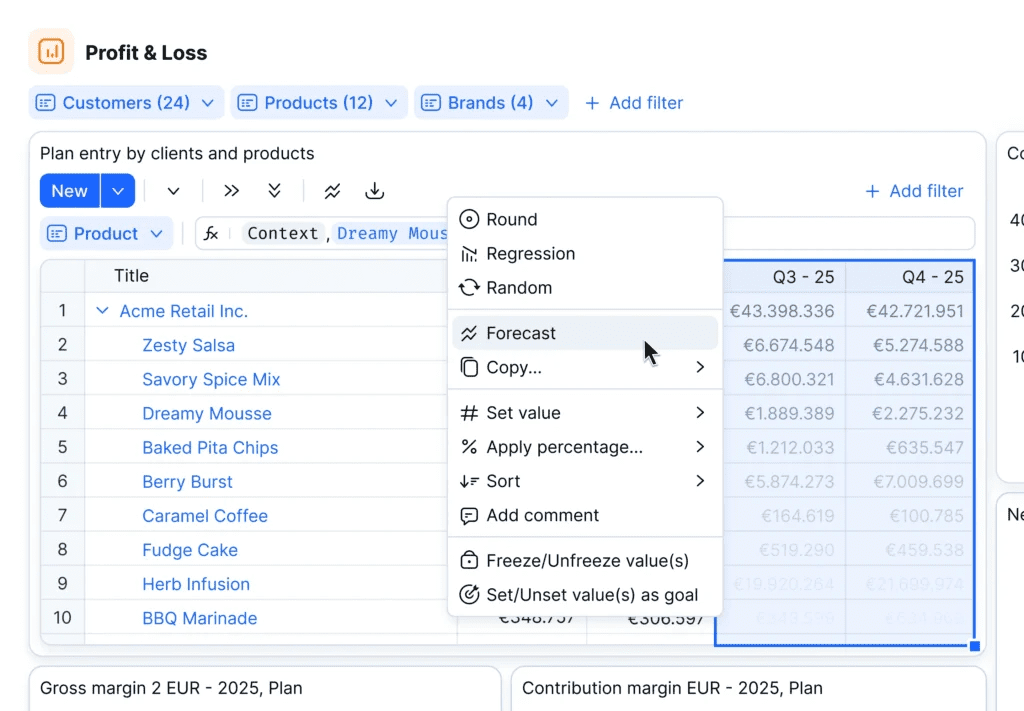
Platforms like Farseer are particularly well-suited for scenario analysis, as they allow FP&A teams to build interconnected financial models where changing a handful of input assumptions instantly cascades through the entire P&L, balance sheet, and cash flow statement, eliminating the manual, error-prone process of maintaining multiple spreadsheet versions.
Driver-Based Forecasting
Driver-based forecasting builds financial projections from the ground up by identifying the key operational and financial drivers that most significantly influence business outcomes. Rather than forecasting revenue or expenses as a single top-level number, this approach decomposes each line item into its constituent drivers.
Revenue, for example, might be modeled as a function of the number of sales representatives, average deals closed per rep per quarter, and average deal size. Each driver is forecast individually, and the financial outcome is calculated as the product of its component drivers.
Driver-based forecasting represents the gold standard for FP&A maturity. It creates an explicit, auditable link between operational activity and financial performance, making forecasts more transparent, more actionable, and easier to update. When actual results deviate from forecast, driver-based models make it immediately clear which driver is responsible—was it lower-than-expected deal volume, smaller deal sizes, or longer sales cycles?
This diagnostic capability accelerates the variance analysis process and enables faster course correction. It also fosters deeper collaboration between FP&A and operational leaders, because the model speaks the language of the business rather than the language of accounting.
Practical Example
A technology company’s FP&A team might construct a driver-based revenue model structured as follows: beginning-of-period customers, plus new customer acquisitions (driven by marketing spend and conversion rates), minus churned customers (driven by net promoter score trends and competitive dynamics), multiplied by average revenue per customer (driven by pricing tier mix and upsell penetration). Each driver is forecast separately based on its own trend data and planned initiatives.
If the marketing team plans to increase paid acquisition spend by 25%, the model can estimate the resulting lift in new customer acquisitions based on historical cost-per-acquisition data, and then calculate the downstream revenue impact. Similarly, if the product team launches a new premium tier, the model can incorporate assumptions about adoption rates and their effect on average revenue per customer.
This granularity makes the forecast a living, breathing tool that evolves in lockstep with operational reality, rather than a static artifact that becomes stale within weeks of being published.
Judgmental / Qualitative Forecasting
Judgmental forecasting, also known as qualitative forecasting, relies on the informed opinions, expertise, and intuition of individuals or groups rather than purely on historical data or statistical models.
This technique is particularly critical in situations where historical data is either unavailable, unreliable, or irrelevant such as launching a new product, entering an uncharted market, or navigating unprecedented disruptions. Common methods within this category include the Delphi method (structured expert consensus through iterative rounds), executive opinion panels, sales force composites, and market research surveys.
While quantitative techniques form the backbone of most FP&A forecasting, there are moments when numbers alone cannot tell the full story.
Judgmental forecasting fills this gap by capturing insights that live outside spreadsheets, knowledge about regulatory changes on the horizon, competitive moves that haven’t yet hit the data, shifts in customer sentiment, or macroeconomic turning points that statistical models are slow to detect.
The best FP&A teams treat judgmental forecasting not as a fallback when data is missing, but as a complementary layer that enriches and challenges their quantitative models. A well-structured qualitative process can surface blind spots, correct overconfident model assumptions, and inject real-world nuance into what might otherwise be a mechanistic projection.
The key advantage of judgmental forecasting is its flexibility: it can be deployed in any situation, regardless of data availability, and can incorporate the latest qualitative intelligence faster than any model recalibration.
However, it is inherently susceptible to cognitive biases: anchoring, groupthink, overconfidence, and recency bias can all distort expert opinions. Structured approaches like the Delphi method mitigate these risks by anonymizing contributions and iterating toward consensus, but FP&A teams must remain vigilant about the quality and diversity of the expert panel.

Practical Example
Imagine a consumer electronics company preparing to launch an entirely new product category, say, a wearable health device with no historical sales data to rely on.
The FP&A team decides to use the Judgemental forecast for the first-year demand. They assemble a panel of eight experts: two product managers, two sales directors, a market research analyst, a supply chain lead, and two external industry consultants.
In Round 1, each expert independently submits their demand estimate along with supporting rationale. The responses range from 50,000 units to 200,000 units. The FP&A team anonymizes the results and shares the range, median, and key arguments back to the panel.
In Round 2, experts revise their estimates in light of peer reasoning; several adjust upward after reading a compelling argument about the addressable market size, while others moderate downward after considering manufacturing constraints.
By Round 3, the panel converges on a consensus range of 90,000 to 130,000 units, with a central estimate of 110,000. The FP&A team uses this consensus as the demand assumption in their financial model, pairing it with scenario analysis to stress-test the upside and downside boundaries.
Rolling Forecasts
A rolling forecast is a continuously updated financial projection that extends a fixed number of periods into the future typically 12 to 18 months regardless of the fiscal year boundary.
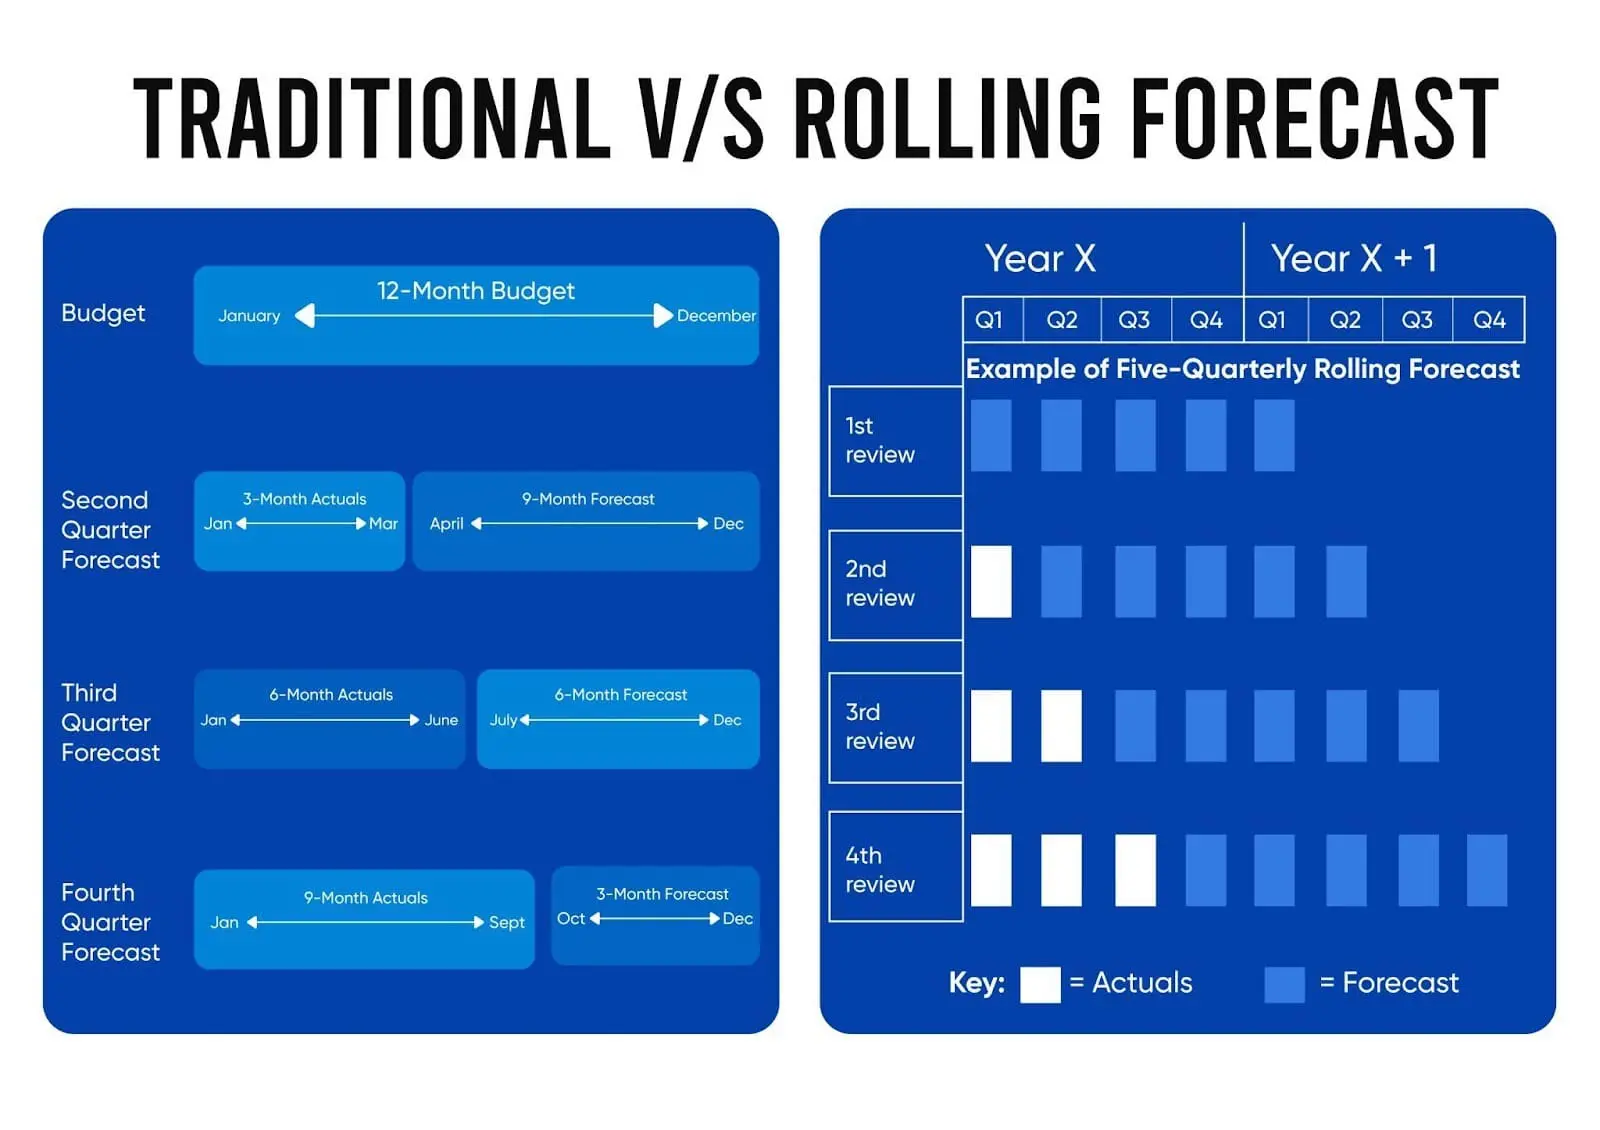
Unlike a traditional static annual budget that is set once and becomes increasingly stale as the year progresses, a rolling forecast is refreshed at regular intervals (monthly or quarterly). Each time a period closes, it drops off the back end and a new period is added to the front, ensuring that leadership always has visibility into a consistent planning horizon.
Read: How Top FP&A Teams Use Rolling Forecasts to Stay Ahead
Traditional budget (Left) vs Rolling Forecast (Right)
Rolling forecasts address one of the most persistent frustrations in corporate finance: the annual budget becoming obsolete within weeks of approval. In fast-moving industries, a forecast built in October for the following calendar year may bear little resemblance to reality by March.
Rolling forecasts solve this by institutionalizing a culture of continuous re-forecasting, forcing FP&A teams and business partners to regularly revisit assumptions and incorporate the latest actuals, market intelligence, and operational developments. This keeps the organization agile and forward-looking rather than anchored to outdated plans.
Practical Example
A global logistics company operating on a rolling 18-month forecast updates its projections at the close of every quarter. In Q1, the FP&A team reviews actual performance against the prior forecast, adjusts assumptions for fuel costs, shipping volumes, and labor rates based on the latest data, and extends the forecast horizon out by one additional quarter. When a major port disruption occurs mid-year, the team does not wait until the next annual budgeting cycle to recalibrate.
Read: Why Finance Teams Are Moving to Continuous Budgeting
They incorporate the impact into the very next rolling forecast update, giving leadership an immediate view of the revised revenue, cost, and cash flow outlook. This continuous feedback loop transforms the forecast from a point-in-time snapshot into a dynamic navigation tool that keeps pace with the business.
Conclusion
The seven techniques explored in this article—straight-line forecasting, regression analysis, moving averages, scenario analysis, and driver-based forecasting represent a continuum of sophistication that every FP&A professional should understand and be prepared to deploy.
No single technique is universally superior; the best approach depends on the nature of the business, the quality of available data, the time horizon of the forecast, and the specific decision the forecast is intended to inform.
- Straight-line forecasting provides speed and simplicity when the business environment is stable.
- Regression analysis introduces causal reasoning, enabling forecasts that respond to changes in underlying drivers.
- Moving averages cut through volatility to reveal true trends.
- Scenario analysis equips leadership to plan for uncertainty rather than be paralyzed by it.
- Driver-based forecasting connects financial projections to operational reality, creating forecasts that are both more accurate and more actionable.
- Judgmental forecasting captures expert insights and qualitative intelligence that no dataset can fully encode, making it indispensable when historical data is absent or unreliable.
- Rolling forecasts ensure projections never grow stale, replacing the rigid annual budget with a continuously refreshed planning horizon that keeps pace with the business.
In practice, the most effective FP&A teams combine multiple techniques, using each where it adds the most value.
They might start with a driver-based model as their primary forecast, overlay scenario analysis to stress-test assumptions, use moving averages to establish trend baselines for key inputs, and apply regression to quantify the relationships between marketing spend and customer acquisition or between macroeconomic indicators and demand.
Perhaps most importantly, the best FP&A practitioners recognize that forecasting is not a one-and-done exercise.
It is an iterative process that demands continuous learning, refinement, and adaptation. As new data becomes available, assumptions should be challenged and models should be recalibrated. As new tools and technologies emerge from advanced analytics platforms to machine learning algorithms FP&A professionals must remain curious and willing to expand their methodological repertoire.
The organizations that invest in building forecasting excellence within their FP&A functions will be the ones best positioned to navigate uncertainty, capitalize on opportunity, and deliver sustained financial performance.
The techniques described here are not merely academic constructs; they are practical, proven tools that, when mastered and thoughtfully applied, can transform the FP&A function from a backward-looking reporting team into a forward-looking strategic partner.
FAQ
What is the most important forecasting technique for FP&A professionals?
There is no single “most important” technique. The best approach depends on your business context, data availability, and the decision at hand. However, driver-based forecasting is widely regarded as the gold standard for FP&A maturity because it explicitly links operational activity to financial outcomes, making forecasts more transparent and actionable.
In practice, the most effective FP&A teams combine multiple techniques: a driver-based model as the primary forecast, scenario analysis to stress-test assumptions, and moving averages or regression to establish trend baselines for key inputs.
When should I use judgmental forecasting instead of quantitative methods?
Judgmental forecasting is most valuable when historical data is unavailable, unreliable, or irrelevant such as when launching a new product, entering an uncharted market, or navigating unprecedented disruptions like a pandemic. It is also useful as a complementary layer to quantitative models, helping to capture insights about regulatory changes, competitive moves, or shifts in customer sentiment that statistical models are slow to detect. Structured approaches like the Delphi method reduce the risk of cognitive biases that can distort purely opinion-based forecasts.
How does a rolling forecast differ from a traditional annual budget?
A traditional annual budget is set once typically during Q4 and remains static for the entire fiscal year, becoming increasingly stale as conditions change. A rolling forecast, by contrast, is continuously updated at regular intervals (monthly or quarterly) and always extends a fixed number of periods into the future (typically 12–18 months), regardless of fiscal year boundaries. This means the organization always has a fresh, forward-looking view of expected performance. Rolling forecasts encourage a culture of continuous re-forecasting, forcing teams to regularly revisit assumptions rather than anchoring to an outdated plan.
What is the difference between regression analysis and driver-based forecasting?
While both techniques model the relationship between inputs and financial outcomes, they differ in approach. Regression analysis is a statistical method that uses historical data to quantify the mathematical relationship between variables (e.g., how marketing spend correlates with revenue). Driver-based forecasting is a broader modeling philosophy that decomposes financial line items into their operational drivers (e.g., revenue = number of reps × deals per rep × average deal size) and forecasts each driver individually. Regression can be used within a driver-based model to estimate how specific drivers behave, making the two techniques highly complementary.
How do I choose the right moving average window for my forecast?
The choice of window length depends on the volatility and seasonality of your data. A shorter window (e.g., 3-month) is more responsive to recent changes but also more sensitive to noise and one-off fluctuations. A longer window (e.g., 12-month) smooths out seasonality and volatility but lags further behind trend shifts. For businesses with strong seasonal patterns, a 12-month window is a common starting point because it captures a full cycle.
How can scenario analysis improve my forecast accuracy?
Scenario analysis does not aim to improve single-point forecast accuracy—instead, it improves decision-making by acknowledging uncertainty. By constructing a base case, an optimistic case, and a pessimistic case, FP&A teams give leadership a range of plausible outcomes rather than a false sense of precision.
This enables contingency planning: the organization can pre-identify trigger points and corresponding actions (e.g., freeze hiring if revenue drops below a certain threshold). The real value lies not in predicting which scenario will materialize, but in ensuring the organization is prepared regardless of which one does.
What tools and technologies are FP&A teams using for modern forecasting?
FP&A teams are increasingly moving beyond spreadsheets toward purpose-built financial planning platforms. Tools like Farseer provide integrated financial modeling environments where assumptions cascade automatically through interconnected P&L, balance sheet, and cash flow statements, eliminating the manual, error-prone process of maintaining multiple spreadsheet versions.
How often should FP&A teams update their forecasts?
The optimal frequency depends on industry dynamics and organizational needs, but the trend is clearly toward more frequent updates. Companies in fast-moving sectors (technology, retail, logistics) often benefit from monthly forecast refreshes, while more stable industries may find quarterly updates sufficient.
Many organizations adopt a hybrid approach: a full rolling forecast refresh quarterly, with lighter monthly updates focused on the most volatile drivers (e.g., revenue pipeline, cash flow). The goal is to strike a balance between forecast freshness and the time investment required from FP&A and business partners. Whatever the cadence, the critical principle is that forecasts should never be treated as a one-and-done exercise.


Digital Transformation in Finance: How Finance Teams Break Out Of Digital Planning Purgatory With AI
Read more
Farseer raises $7.2M Series A to build the Enterprise Operating System for Finance
Read more