How to Build a Headcount and Salaries Report: Step by Step

Payroll is not just an HR expense. For any FP&A team, it is the single most important line item on the operating expense forecast — typically representing between 50 and 70 percent of total operating costs in a SaaS or services business.
And yet, despite its size and its influence on virtually every other planning decision a company makes, the headcount and salaries report is frequently produced as an afterthought: a static roster pasted from an HRIS export, manually updated at the start of each budget cycle, and handed off to whoever is willing to wrestle with it. That approach is not FP&A. It is data administration.
A properly constructed headcount and salaries report is a forward-looking, dynamic planning tool that connects individual employee records to department-level summaries, quarterly budgets, multi-year forecasts, and board-level workforce narratives. It tells the CFO not just how many people are on payroll today, but how many will be next quarter, what the fully-loaded cost of that workforce will be, and what decisions need to be made between now and then to stay within budget.
Read: How to Connect Headcount Planning with Strategic Goals
This article walks through the entire process of building a comprehensive headcount and salaries report from scratch.
It covers the purpose and anatomy of the model, how to collect and organise the data, the step-by-step build process, the analytical insights the finished report enables, and how to present the outputs to the people who need to act on them. The model structure described throughout is grounded in real-world FP&A practice, using a five-component architecture: a central assumptions hub, an employee-level roster, a headcount waterfall summary, a payroll expense summary, and a department drill-down view.
By the end of this article, you will have a clear, repeatable framework for building a headcount and salaries report that goes well beyond a payroll register. One that functions as a genuine decision-support tool for every stakeholder who touches workforce planning.
Understanding the Components
Before you write a single formula, you need to understand what a well-built model actually contains. The common mistake is to think of the headcount report as a single sheet — a table with names in rows and months in columns. That structure exists inside the model, but it is only one layer of a multi-layer architecture. A complete model has five functional components that work together.
1. The Assumptions Hub
The assumptions hub is the control panel of the entire model.
It is where you store every rate that drives the calculations: merit increase percentages by employee level, payroll tax rates by jurisdiction, benefits costs broken down by component (medical, dental, 401(k), miscellaneous), and bonus accrual targets by seniority band. None of these rates should ever be hardcoded into formulas inside the roster. Every single assumption should live in this one place, referenced by cell address throughout the rest of the model.
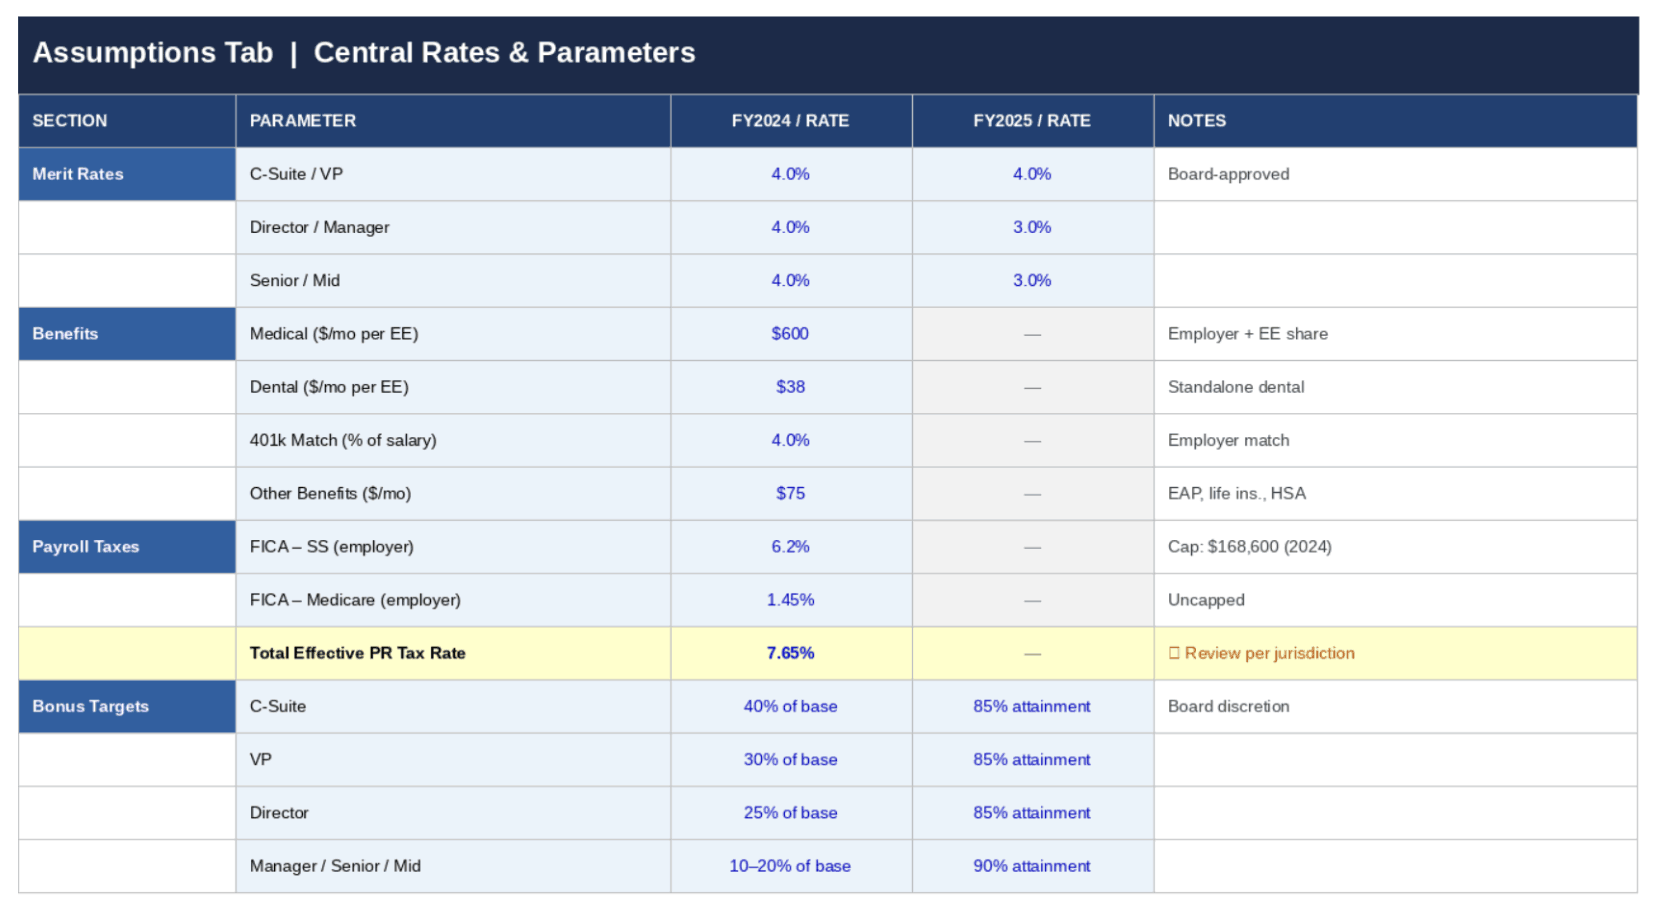
This is what makes the model scenario-capable: to run a hiring freeze scenario, you change one cell. To model a 3% versus 5% merit round, you change one cell. This architecture is the difference between a spreadsheet and a planning model.
2. The Employee Roster
The roster is the granular engine of the model.
It contains one row per employee, and it is far more than a list of names and salaries. Each row carries the employee’s identifying information (name, department, title, level, location, employee type), their temporal data (start date, end date), their compensation inputs (base salary, merit assumption, bonus target, benefits elections, payroll tax rate, FTE percentage). And then — extending across 36 or more columns — a monthly cost calculation driven by the start and end date logic.
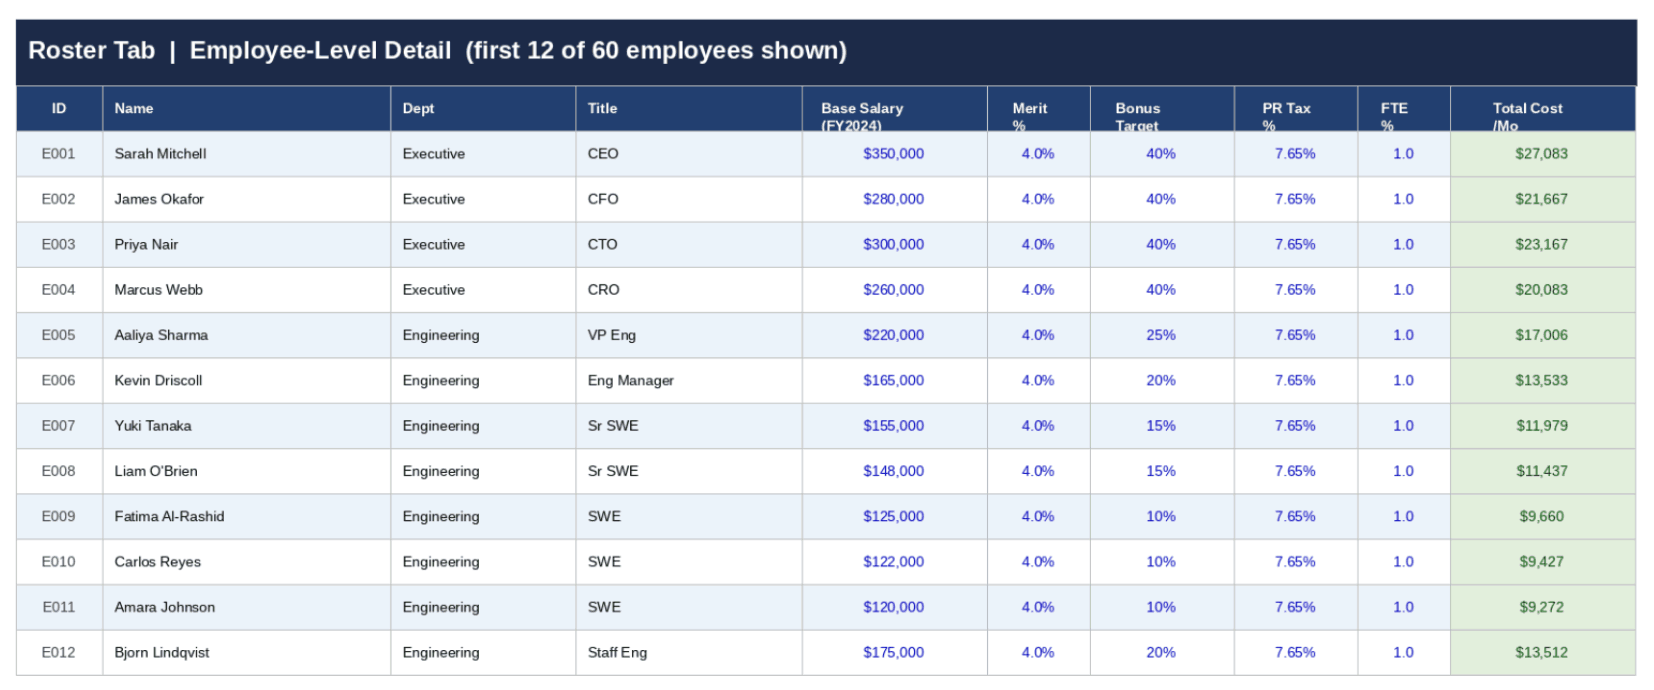
An employee who starts mid-month has their first month’s cost pro-rated based on the number of days worked. An employee who leaves in a given month has their last partial month calculated automatically.
No manual entry, no manual zeroing-out of departed staff. The formulas do it.
3. The Headcount Waterfall Summary
The headcount summary translates the raw roster data into the management reporting format that finance and business leaders actually read.
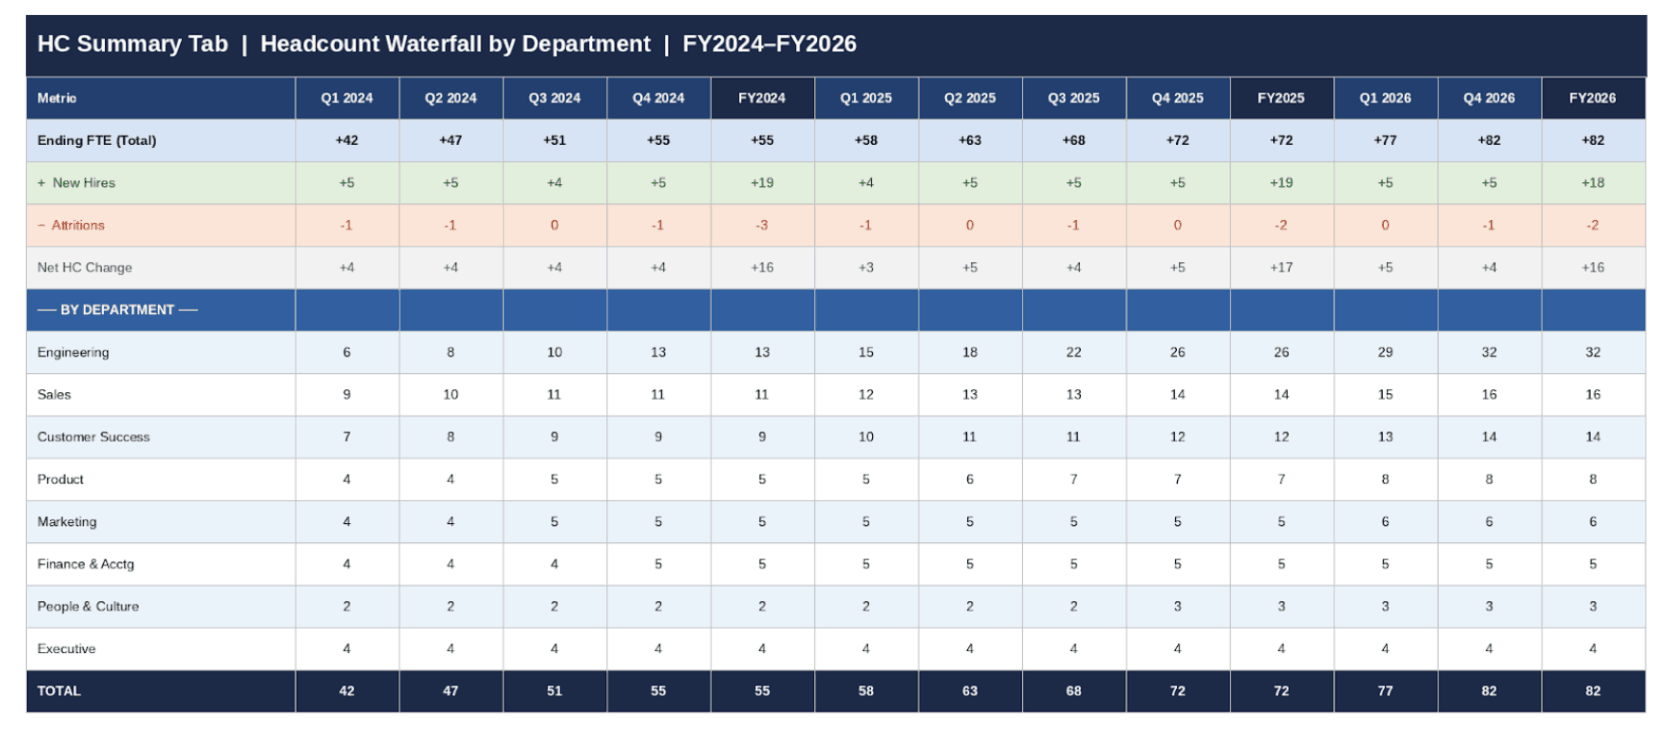
It shows, for each department and for the company in total, the movement of headcount across the forecast horizon: beginning count, plus new hires, minus attritions, equals ending count.
This waterfall structure is essential because it forces intellectual honesty about workforce plans. It is easy to approve 15 new hires in a budget presentation. It is harder to look at a model that shows the hiring ramp, the annualised cost of those hires, and the attrition rate that is quietly working against them. All in the same view.
Read: Top 7 Forecasting Techniques: Every FP&A Professional Should Know
4. The Payroll Expense Summary
The payroll summary aggregates the monthly cost columns from the roster into a departmental view across the full planning horizon.
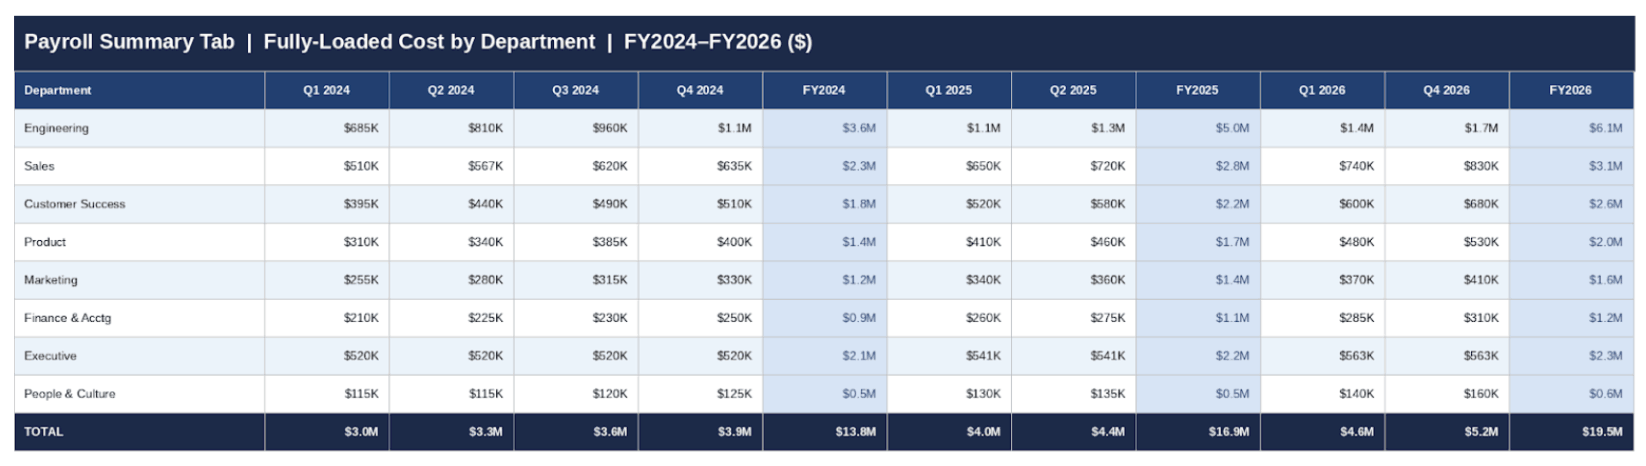
It answers the question every CFO asks: “What are we spending on people, by department, every month, and what does that look like annually?” A strong payroll summary goes beyond base salary to show the fully-loaded cost — base salary, payroll taxes, bonus accrual, and benefits combined. The difference between base salary and fully-loaded cost is typically 25 to 35 percent, depending on the benefits package, and that gap has real P&L consequences. Reporting only base salary understates people costs and creates budget surprises at close.
Read: CFO Budget Planning: Is Your Current Process Slowing You Down?
5. The Department Drill-Down
The department drill-down bridges headcount data and management accountability.
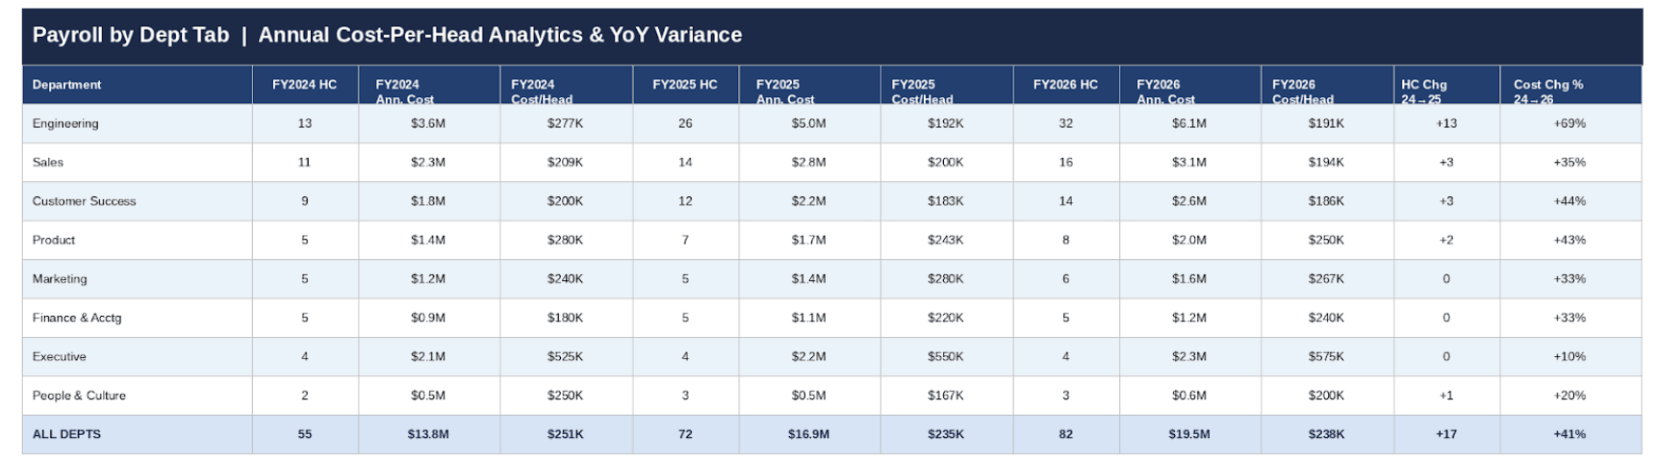
For each department, it shows ending FTE, annual base payroll, annual fully-loaded cost, cost per head, and year-over-year variance in both dollar and percentage terms. This is the view that a department head receives in their business review.
It surfaces questions like:
Why is Engineering’s cost per head growing faster than headcount?
Why is Customer Success carrying more cost than budgeted despite being two heads below plan?
These are the conversations that separate an FP&A team that reports history from one that shapes decisions.
Key principle: The anatomy of the model must be established before data is entered. Retrofitting structure onto a model that already has 50 employees in it is exponentially harder than building the architecture first.
Data Collection
Gathering the right data before building the model prevents the most common failure mode in FP&A: spending two weeks building something and then spending another two weeks reconciling it to four different “source of truth” files that each tell a different story.
There are four data sources you need, and you need to nail down each one before the build begins.
Source 1: The HRIS Export — Existing Employees
Your HR Information System is the source of truth for the current workforce.
Most HRIS platforms like Workday, BambooHR, Rippling, and ADP allow a point-in-time CSV export of the active roster. Request the extract as of your model start date rather than pulling a live feed. You want a snapshot, not a moving target.
The fields you need are: full name, department (exactly as your chart of accounts defines it), title, employee level, employee ID, hire date, base salary, employment status, and FTE percentage for any part-time staff.
Do not forget to include employees who are on leave. They have a cost.
Source 2: The Hiring Plan — Planned New Hires
Planned hires come from two places: the approved budget headcount plan (roles that have been formally signed off) and the current ATS pipeline (roles that are actively being recruited).
Both belong in the model, but they should be tagged differently. A role that has a signed offer is very different, for planning purposes, from a role that is still being sourced. Common ATS platforms like Greenhouse, Lever, Ashby, etc., allow exports of open roles with target start dates.
Treat pipeline hires as your Base Case and unconfirmed roles as your Stretch Case. This distinction will matter every time the CFO asks you to show two scenarios.
Read: Scenario Planning or Sensitivity Analysis? A Practical Guide for Finance and FP&A Teams
Source 3: Compensation and Benefits Assumptions
This is where most models cut corners, and where most payroll surprises originate.
You need three pieces of data:
- The employer payroll tax rate (which in the US is approximately 7.65% for FICA alone, plus state unemployment tax),
- The benefits cost per employee per month broken down by component, and
- The bonus accrual rate by level or role type.
The benefits breakdown matters because different employee populations have different elections, and because healthcare costs, 401(k) match, and ancillary benefits each behave differently as headcount scales.
A VP-level hire carries a materially different benefits burden than a junior analyst.
Source 4: Attrition Data
Attrition is the number most finance teams get wrong because it is simultaneously the hardest to predict and the most consequential for the accuracy of the plan.
You need two types:
- Known terminations (where you have a specific end date, which goes directly into the roster) and
- Statistical attrition (your modelled assumption about involuntary or voluntary turnover in each department).
Historical HRIS data gives you the trailing twelve-month attrition rate by department. That rate becomes your planning assumption, translated into specific placeholder rows in the roster with estimated departure months.
The model should show attrition as a negative line in the headcount waterfall — not hidden, not smoothed away, but explicitly visible so that headcount growth is stated net of the people you expect to lose.
Data quality tip: Run a duplicate employee ID check before building a single formula. HRIS exports frequently contain duplicate records for employees with recent title changes or department transfers. A duplicate will double-count salary cost and overstate headcount — two errors that will surface embarrassingly in a board review.
Data Organisation
With your data sources assembled, the next step is organising them in a way that serves the model architecture. The structural decisions you make at this stage determine how flexible and maintainable the model will be across planning cycles.
1. One Row, One Employee — Always
The roster must follow a strict one-row-per-employee structure with no exceptions.
The temptation to create summary rows, subtotals within the roster, or merged department blocks is understandable but fatal to formula integrity.
Every aggregation (by department, by level, by location) should happen in the Summary sheets using SUMIF and SUMPRODUCT functions referencing the flat roster, never inside the roster itself. This discipline is what allows you to add 20 employees to the roster without touching a single formula in the summary sheets.
2. The FTE Column Logic — The Model's Core Mechanism
The most important structural decision in the roster is how you handle monthly FTE values for employees who are not active for a full month.
The correct approach is a binary-plus-proration system: each monthly column contains either 0 (the employee was not on payroll that month), 1 (the employee was on payroll for the full month), or a decimal between 0 and 1 representing the proportion of the month worked, calculated as days worked divided by total days in the month.
This number drives the cost formula: monthly cost equals FTE value multiplied by the monthly salary, plus the same FTE multiplier applied to fixed benefits, giving you a mathematically precise cost figure even for employees who start on the 15th or leave on the 8th.
The formula that achieves this is an IF-AND date comparison: if the employee’s start date is less than or equal to the last day of the month AND the employee’s end date is greater than or equal to the first day of the month, then calculate the active days as a fraction of the month’s total days; otherwise, return zero. This formula, replicated across every monthly column for every employee, is what transforms a static list into a dynamic cost model.
3. Department List as the Organising Spine
The department master list must live in its own dedicated reference tab, never hardcoded into formulas.
This is a principle of spreadsheet hygiene that pays dividends every time an organisation restructures, renames a cost centre, or splits a department in two.
When the department name in the reference list is the single source of truth referenced by every SUMIF and every dropdown in the model — a department rename is a one-cell edit that propagates everywhere. When department names are scattered across dozens of hardcoded formula strings, a rename is a find-and-replace operation that will inevitably miss something and quietly corrupt your outputs.
4. Version and Scenario Discipline
Before the model goes into active use, establish a naming convention and stick to it.
A sensible format is Company_HeadcountModel_ScenarioName_Version_Date.xlsx.
The scenario name (Base Case, Hiring Freeze, Stretch Plan), version number, and date are not cosmetic. They are operational. When you are presenting to the CFO on a Wednesday and she asks “is this the same model you sent Monday?”, you need to be able to answer that question in three seconds by reading the filename.
Every planning cycle generates multiple versions; without discipline, the “which file is the real one” question will consume hours of your time.
Report Building: Step by Step
The build sequence matters almost as much as the model structure.
Building in the wrong order — for example, starting with the roster before the assumptions are defined, or building the summary before the roster formulas are validated — creates cascading errors. Follow this sequence.
Step 1: Configure the Assumptions Hub
Open the Assumptions tab and enter every rate the model will reference before touching the roster.
Define the model start date (the first month of the planning horizon), the merit increase percentage for each employee level, the employer payroll tax rate, the monthly benefits cost per employee by component (medical, dental, 401(k) match, other), and the bonus target percentage by level. Every one of these values should be clearly labelled, formatted in blue (industry convention for hardcoded inputs), and ideally accompanied by a brief note on the source.
This tab is the first place any reviewer should look when questioning a number, and it should be self-explanatory without context from the builder.
Step 2: Build and Validate the Department List
Before entering a single employee, establish the department taxonomy in the reference tab.
This is also the moment to decide: are you planning by department, by cost centre, by entity, or some combination? The answer drives the structure of the entire summary view. Whatever taxonomy you choose, the spelling and formatting in the department list must be identical to what your HRIS will export. Any mismatch will cause SUMIF formulas to silently miss records, producing understated headcount and payroll figures that are extremely difficult to diagnose after the fact.
Step 3: Populate the Roster with Existing Employees
Paste the HRIS export into the roster, mapping each field to its designated column.
Enter the benefits and payroll tax assumptions for each employee or, if you are using company-wide rates, reference the assumptions tab. Let the formula layer calculate the monthly salary, payroll tax, and benefits columns. Once all existing employees are entered, run the duplicate ID check, then cross-validate ending headcount at the model start date against the HRIS active headcount. They must match exactly. Any discrepancy at this stage indicates a data issue that must be resolved before the model goes forward. Do not proceed past this step with an unreconciled count.
Step 4: Add Planned New Hires and Attrition
New hires go into the same roster, below the existing employees, with their planned start date and a far-future end date (such as December 31, 2099) as a placeholder for open-ended employment.
Attritions are handled in two ways: for known departures, update the end date on the existing employee row and the FTE column logic will automatically zero out their cost from the departure month forward; for statistical attrition, insert placeholder rows with estimated department assignments and departure months, clearly labelled as “Modelled Attrition” in the name field so they can be identified in the outputs.
Step 5: Build the Summary Outputs
With the roster complete and validated, the summary sheets are straightforward to build because they are entirely formula-driven.
The headcount waterfall uses SUMPRODUCT formulas comparing start and end dates to each monthly column to count active employees, new starters, and departures. The payroll summary uses SUMIF formulas to aggregate the monthly cost columns by department. The department drill-down computes cost per head by dividing annual fully-loaded cost by ending headcount. Every summary number should be reconcilable to the roster with a few clicks.
If you cannot trace a number in the summary back to specific employees in the roster, the model has a structural problem.
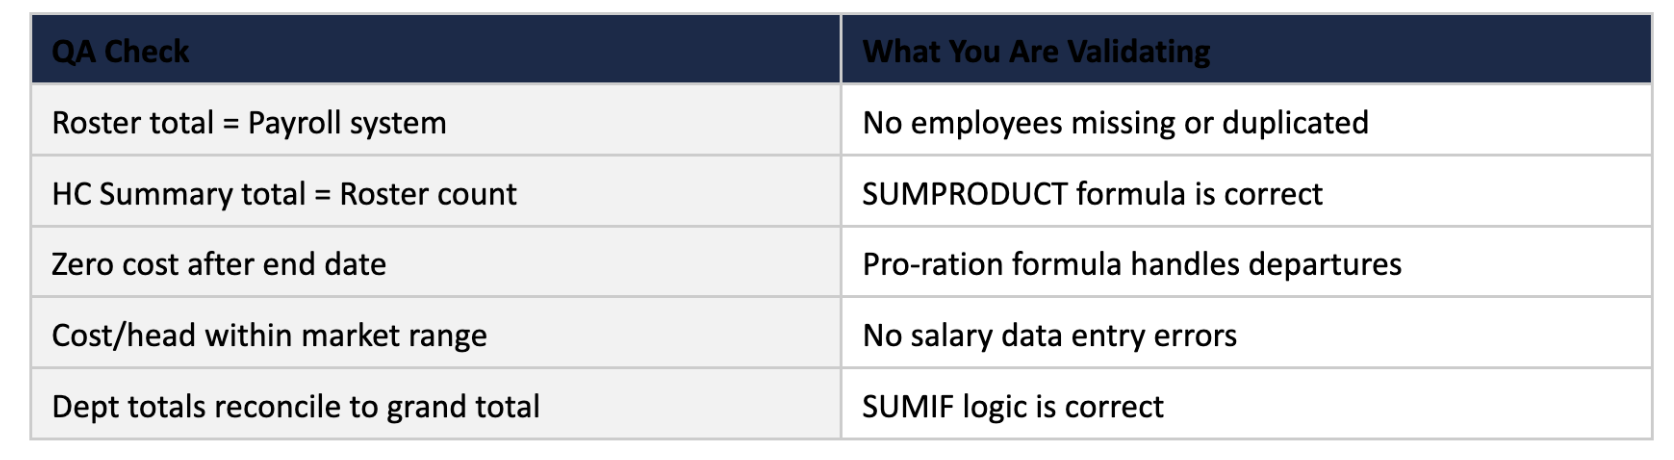
Step 6: Validate Before Distributing
Before sharing the model with anyone, run a structured QA checklist.
Verify that the total payroll at model start matches the most recent payroll run within a reasonable tolerance. Confirm that every department’s headcount in the summary equals the count of active employees with that department assignment in the roster.
Check that no employee has a cost greater than zero after their end date. Sense-check average cost per head by department against market benchmarks. These checks take 30 minutes and prevent the kind of errors that surface in a board meeting at the worst possible moment.
Analysis and Insights
A validated model is an input to analysis, not the end product.
The value FP&A adds is in what the model reveals — and, equally important, what it prompts leadership to do differently. Here are the five categories of insight a well-built headcount and salaries report consistently surfaces.
1. Run-Rate Cost and the Hiring Ramp
The most immediately actionable number in the model is the run-rate payroll cost: the annualised cost of the workforce as it exists at any given month-end.
Comparing the run-rate at the end of Q1 to the run-rate at the end of Q4 gives you the hiring ramp. The hiring ramp is the incremental annual cost that the planned hiring programme will add to the operating expense base before the year is out. This number deserves to be explicitly calculated and presented, because it translates the headcount plan from a count of people into a financial commitment.
A plan to hire 20 engineers over the course of the year does not cost 20 × average engineering salary. It costs the pro-rated sum of each hire’s start-to-year-end tenure, which in a company that front-loads its hiring is considerably less, and in a company that back-loads its hiring is considerably more, than a simple average calculation would suggest.
2. Net Headcount vs. Gross Hiring
One of the most valuable perspectives the headcount waterfall provides is the relationship between gross new hires and net headcount growth.
Companies frequently approve gross hiring plans without adequately accounting for attrition. A department that plans to hire 12 people over the year but has a 20 percent annual attrition rate will end the year with far fewer net additions than the plan implies. And the payroll budget for those 12 hires has already been spent on the replacement hiring that was not in the original plan. The waterfall makes this dynamic visible and unavoidable, forcing the conversation about whether the headcount budget should be gross-hire or net-growth oriented.
3. Fully-Loaded Cost vs. Base Salary
In a typical US SaaS company with a competitive benefits package, the fully-loaded cost of an employee is approximately 25 to 30 percent higher than their base salary.
For a mid-level engineer on a $130,000 base salary, that translates to a fully-loaded annual cost of $162,500 to $169,000 — a difference of $32,000 to $39,000 that disappears entirely from a model that only tracks base salary.
When multiplied across a 100-person workforce, the gap between base payroll and fully-loaded payroll often exceeds $3 million annually. Presenting this distinction clearly — “our budgeted base payroll is $12 million, and our fully-loaded people cost is $15.4 million” — is a basic FP&A responsibility that too many teams neglect.
4. Cost Per Head by Department
Cost per head is the normalising metric that makes cross-department comparisons meaningful.
Engineering cost per head will always be higher than Customer Support cost per head, but the ratio between them — and how that ratio is trending — tells a story about where the organisation is investing.
When Engineering cost per head is rising faster than Engineering headcount, it signals either merit inflation, compensation pressure from the market, or a shift in the seniority mix toward more senior and expensive roles. Any of these is worth investigating. The headcount and salaries report, built with the department drill-down view, surfaces these dynamics automatically without requiring ad hoc analysis.
5. Scenario Sensitivity
Perhaps the most powerful use of a well-built model is scenario analysis.
Because all assumptions are centralised and all calculations are formula-driven, changing the hiring plan by delaying ten hires by one quarter takes seconds and produces an immediate, auditable impact on the full-year payroll forecast. This is the kind of analysis that transforms FP&A from a reporting function into a strategic advisory one.
When the CEO asks “what happens to our runway if we pause hiring in Q3?”, the answer should be available in the room, not emailed tomorrow morning.
FARSEER WORKFORCE PLANNING IN ACTION
The what-if analysis described above is one of the highest-value outputs a headcount model can produce — and also one of the most time-consuming to maintain in Excel as your scenario count grows. Farseer’s workforce planning demo shows what this looks like when it is native to the planning environment itself: departments can see their budget target against their planned costs in real time, adjust hire timing, salary parameters, or contractor FTEs, and watch the gap close or widen instantly — no formula rebuilding required. The demo also covers how GDPR-controlled employee visibility works in practice, with HR seeing named salary records while other departments plan headcount without accessing individual compensation data. Worth fifteen minutes before your next planning cycle:
Farseer Workforce Planning and Budgeting
Watch the Farseer Workforce Planning DemoPresentation and Communication
The best model in the world produces no value if the outputs are not communicated effectively. Different stakeholders need different views of the same underlying data, and FP&A’s role is to curate the right view for each audience rather than dumping the full model on everyone and letting them figure it out.
1. What the Board Needs
Board members and investors typically want three things from the headcount and payroll data:
- The trend line (is headcount growing as planned, faster, or slower?),
- The efficiency metric (what is payroll as a percentage of revenue, and is that ratio improving or deteriorating?), and
- The forward commitment (what is the fully-loaded cost of the current workforce on an annualised basis?).
These three data points should fit on a single slide. The supporting detail lives in the model; the board slide is the narrative. Lead with the headline — “we ended Q2 at 112 FTE, four heads below plan, saving $680,000 in quarterly payroll” — then show the departmental waterfall as supporting context.
2. What the CFO Needs
The CFO needs the full reconciliation: actual versus budget, at department level, with variance explained. Headcount variance (were we above or below plan?) and payroll variance (was the cost above or below plan?) are separate questions that deserve separate answers.
A department can be two heads below plan and still over budget on payroll if the actual hires came in at higher salaries than modelled — that nuance only becomes visible when you separate headcount variance from cost variance.
The CFO also needs to see the forward view: the run-rate trajectory for the remainder of the year, the committed versus uncommitted hiring, and the key risks to the payroll forecast.
3. What Department Heads Need
Department heads need their own view, focused on their own cost centre.
They need to see their headcount versus their approved plan, their payroll spend versus their budget, and the key hiring milestones for the remainder of the year. They do not need to see other departments’ data. In a mature FP&A setup, each department head receives a one-page business review summary generated from the same underlying model, filtered to their cost centre.
The department drill-down view in the model is built precisely to enable this.
Communication Best Practices
Three principles that consistently improve how headcount and payroll data lands with non-finance audiences. First, lead with the implication before the data: say “we are tracking $2.1 million below the payroll budget for the year, primarily because Engineering hiring has lagged plan by 6 weeks” before showing the numbers that support that statement. Second, always footnote your assumptions — every headcount and payroll number in a presentation should be accompanied by a brief note on what is included (are contractors in the headcount? is bonus accrual in the payroll figure?). Third, present one scenario by default and offer the alternative on request. Showing Base Case and Stretch Case side-by-side in every review trains the audience to treat the numbers as ranges rather than commitments, which is the right way to think about a forecast — but it can also paralyse decision-making if overdone.
POWERED BY FARSEER
FP&A teams using Farseer can publish live, self-service department dashboards that pull directly from the same planning model — so department heads always see their current-version headcount and budget without FP&A manually extracting and emailing a filtered report. Version control, audit trails, and approval workflows are built in, eliminating the risk of a department head making decisions from a stale export. This is what ‘one source of truth’ looks like in practice. Visit farseer.com to see the headcount planning module.
A headcount and salaries report built the right way is one of the most valuable assets in an FP&A team’s toolkit.
It is the foundation of the operating expense budget, the primary input to cash flow forecasting, and the analytical backbone of every workforce conversation the business will have over the next twelve months. Done well, it eliminates payroll surprises, creates a common language between Finance and HR, and gives FP&A the credibility to be a genuine partner in workforce strategy rather than a keeper of spreadsheets.
The framework in this guide — a centralised assumptions hub, a formula-driven roster with date-based FTE proration, a headcount waterfall by department, a fully-loaded payroll summary, and a cost-per-head drill-down — is not theoretical. It is the architecture that experienced FP&A teams use in practice, built around the insight that flexibility and accuracy are not competing goals. A model that is well-structured is both more accurate (because it is auditable) and more flexible (because it is assumption-driven).

FAQ
What is a headcount and salaries report in FP&A?
A headcount and salaries report is a financial planning tool that tracks employee data, compensation, and workforce costs over time. It connects individual employee records to departmental budgets and forecasts, helping FP&A teams analyse hiring plans, payroll expenses, and future cost implications.
Why is a headcount and salaries report important?
A headcount and salaries report is important because payroll is typically the largest operating expense for most companies. It enables finance teams to forecast workforce costs, control budgets, and support strategic hiring decisions by providing visibility into both current and future employee-related expenses.
What are the key components of a headcount model?
The key components of a headcount model include an assumptions hub, an employee roster, a headcount waterfall, a payroll expense summary, and a department-level drill-down. Together, these components create a structured model that supports workforce planning and financial analysis.
How do you build a headcount and salaries report?
To build a headcount and salaries report, start by defining assumptions, then create a structured employee roster, add hiring and attrition data, and finally build summary outputs such as headcount waterfalls and payroll reports. Validation checks are essential to ensure accuracy before using the model for decision-making.
What is a fully-loaded employee cost?
A fully-loaded employee cost includes base salary plus additional expenses such as payroll taxes, bonuses, and benefits. This total cost is typically 25–35% higher than base salary and provides a more accurate view of workforce expenses for budgeting and forecasting.
What is FTE in a headcount model?
FTE (Full-Time Equivalent) represents the proportion of time an employee works relative to a full-time schedule. In headcount models, FTE is used to calculate partial-month costs, ensuring accurate payroll calculations for employees who join or leave during a month.
How does attrition impact headcount planning?
Attrition impacts headcount planning by reducing the number of active employees and increasing hiring requirements to maintain or grow workforce levels. Accurately modelling attrition ensures that forecasts reflect realistic staffing levels and prevents underestimating recruitment and payroll costs.
What is a headcount waterfall?
A headcount waterfall is a summary view that shows the movement of employees over time. It tracks beginning headcount, adds new hires, subtracts attrition, and calculates ending headcount, providing a clear view of workforce changes across the planning period.
How does a headcount model support financial planning?
A headcount model supports financial planning by linking workforce decisions to financial outcomes. It helps FP&A teams forecast payroll expenses, analyse hiring plans, evaluate cost per employee, and run scenario analysis to support strategic decision-making.
What are common mistakes in headcount and salary modelling?
Common mistakes in headcount modelling include hardcoding assumptions, ignoring attrition, using inconsistent data sources, and failing to reconcile headcount with payroll systems. These issues can lead to inaccurate forecasts and reduce confidence in financial plans.

How Finance Teams Break Out Of Digital Planning Purgatory With Small, Stackable AI Moves
Read more
Farseer raises $7.2M Series A to build the Enterprise Operating System for Finance
Read more