
Why are financial reporting and analytics crucial? Let’s have a look.
In Q2, a multinational FMCG company saw gross margin drop by 2 percentage points in Europe. The executive team raised the flag and asked Finance for answers: by product, region, and channel.
Finance didn’t have them.
Each local team had sent their numbers. But they were stuck in separate Excel files. No shared structure. No unified view. Moreover, no clear process to tie it all together. The data was there, just not in a way that anyone could use quickly.
It took over a week to build a report. By then, pricing decisions were already made. The team missed the window to adjust – a classic case where ad hoc reporting could have delivered fast, focused answers when time was critical.
Read 10 Best Financial Reporting Software Solutions
This isn’t unusual. And it’s not because people aren’t doing their jobs. It happens when reporting systems can’t answer real business questions. When processes are manual. When Finance spends more time fixing files than analyzing the numbers.
Most companies don’t have a data problem. They have a structure problem. They can’t get to insight fast enough to change the outcome.
This is where financial reporting and analytics, done right, makes a real impact.
What Financial Reporting and Analytics Actually Mean in Practice
Reporting shows performance. Analytics explains performance. You need both to run a finance team that adds value.
Reporting = What Happened
Financial reporting gives you structured outputs: income statement, balance sheet, and cash flow. These reports follow a defined cycle and help stakeholders see where the business stands.
But numbers alone don’t help you act. Without understanding how the three core statements interact, it’s easy to miss what matters. The 3-statement financial model helps connect the dots, showing how shifts in revenue impact cash, or how changes in working capital affect liquidity.
Analytics = Why It Happened
Analytics explains the movement behind the numbers. It helps you figure out why margin dropped or why a region missed target.
For example, reporting might show a 6% drop in EMEA revenue. Analytics breaks that down to a failed promo in one channel or an unexpected shift in product mix.
This is where financial statement analysis becomes essential. It guides how you spot issues early, through trends, ratios, or comparisons, so Finance can support better decisions, not just build reports.
Reporting tells you what happened. Analytics helps you do something about it.
Read more: Financial Analysis Software in 2026: Top Tools & Key Features
Why Financial Reporting and Analytics Break Down in Mid to Large Teams
Finance teams in mid to large companies usually don’t lack tools. The problem is that most tools operate in silos.
ERP systems hold actuals. Excel handles calculations and one-off adjustments. Dashboards live in Power BI. Teams pass files back and forth over email. None of it connects. Reporting takes too long, and no one fully trusts the output.
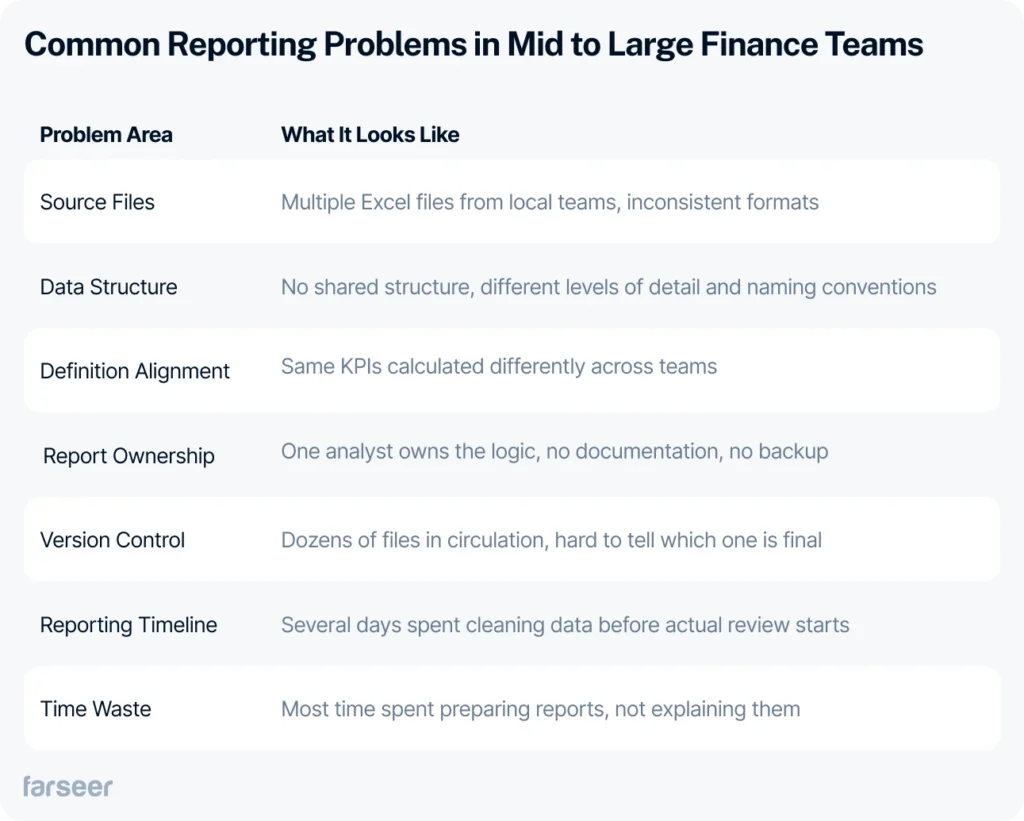
Inconsistent Structures Kill Comparability
Different regions report using different formats. One breaks revenue down by channel, another by product group. Naming conventions vary. Cost centers aren’t aligned. There’s no shared data model across the organization.
Before you can analyze anything, someone has to normalize inputs, remap structures, and manually patch gaps. This process happens every month.
Let’s say three country teams report on the same revenue KPIs. But they use different templates, calendars, and data hierarchies. It takes one central analyst ten hours just to prepare the data for review. That’s ten hours not spent on understanding performance, just making it comparable.
Read Revenue vs EBITDA: Which Metric Should Drive Your Strategic Planning
Definitions Don’t Match
Even when files are structured correctly, the logic behind them often isn’t. One team includes logistics in gross margin. Another doesn’t. What looks like a margin drop is just inconsistent mapping.
You can work around file formats. But if the definitions behind your metrics aren’t aligned, reporting becomes unreliable. Finance ends up spending more time defending the numbers than explaining them.
No Ownership, No Resilience
In many teams, one analyst or controller owns the entire reporting logic. If they’re out, everything stalls. Report versions fall out of sync. Fixes sit in someone’s inbox.
Without defined roles and ownership, reporting becomes fragile. There’s no accountability. Just knowledge stored in people’s heads.
Excel Is Still Doing the Heavy Lifting
Most reporting still depends on Excel. And it works, until it doesn’t, especially in financial reporting and analytics, where complexity and scale break it fast.
Formulas break. Versioning slips. Calculations vary from file to file. Everyone runs their own logic, and when numbers don’t match, it takes days to figure out why.
It’s not a tooling issue. It’s a structural one.
A monthly financial report that’s built around a consistent model and reused every cycle solves this. It removes rework. It gives teams space to focus on actual insights, not data wrangling.
How High-Performing Teams Run Financial Reporting and Analytics
Strong finance teams don’t scramble to fix reports every month. They set up their financial reporting and analytics in a way that works under pressure and doesn’t fall apart when one person is out.
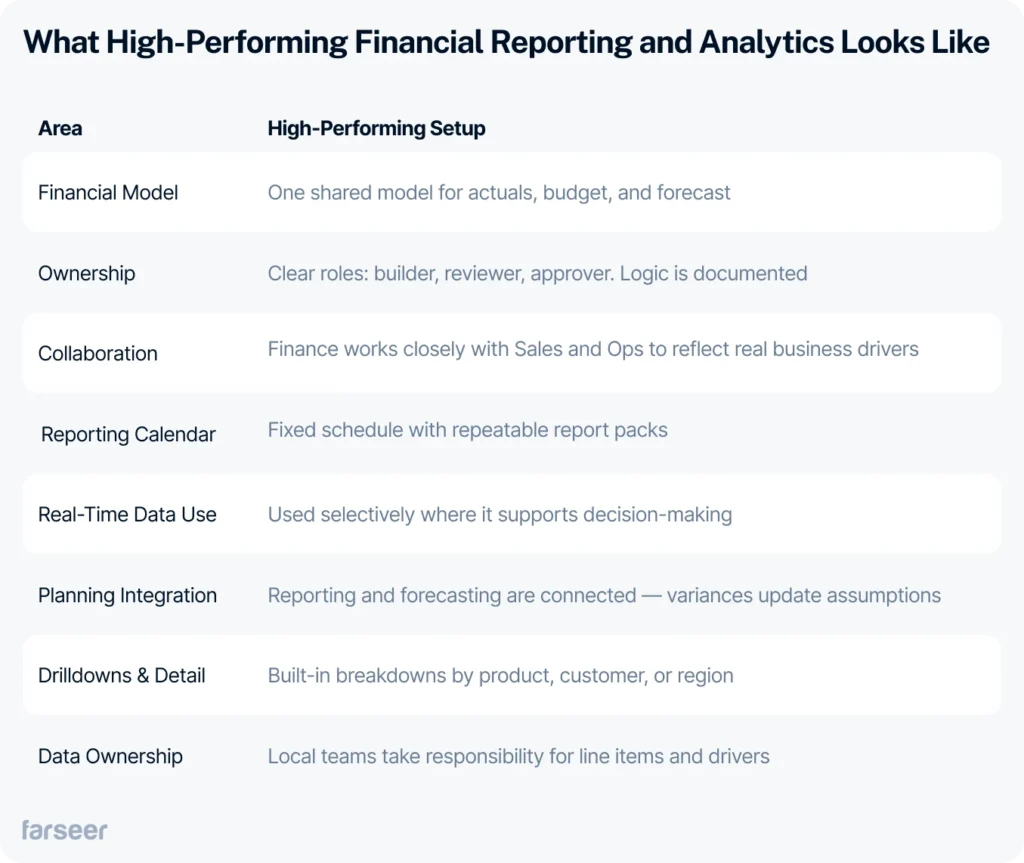
One Model, One Source of Truth
Everything runs on a shared financial model. It includes actuals, budgets, and forecasts. Everyone uses the same logic and the same structure. When something changes, it updates everywhere.
Ownership is clear. One person builds the report. Another reviews it. A third approves it. If something looks off, the right person fixes it. Teams also document key logic, so nothing relies on one spreadsheet or one person’s memory.
Finance doesn’t build reports in a vacuum. Sales and Ops are often involved to make sure reports reflect how the business actually works. This helps prevent late surprises, like margin drops caused by untracked discounts.
Reports Follow a Real Schedule
Reports follow a consistent calendar. Actuals come in weekly or daily, depending on what the business needs. Once the numbers are in, they’re locked. If something needs to change, there’s an approval process.
The same report packs go out on the same day every month. Everyone sees the same layout, the same structure, and the same logic. That consistency builds trust and cuts down on rework.
Real-time updates are used when they support decisions. OPEX burn, sales pipeline, and working capital often qualify. If a dashboard doesn’t help someone act today, there’s no reason to refresh it every day.
Reporting and planning are connected. If the actuals miss forecast, teams update their assumptions right away instead of waiting for the next cycle.
Clear Structure, Clear Responsibility
Finance can break down results by customer, region, or product. That level of detail is possible when data is structured and built to support multidimensional reporting.
Teams look at margin by SKU and cost breakdowns by transaction. This kind of line-item visibility helps teams understand the actual drivers, not just totals.
Every number is tied to someone who owns it. That kind of accountability comes from clean transactional data and clear roles. Teams know who’s responsible, and they’re close enough to the work to explain what changed.
This way of working usually starts with a bottom-up approach. Local teams don’t just send reports. They take ownership of the data. If your reporting still feels too centralized and slow, here’s a step-by-step guide for moving from top-down to bottom-up reporting.
From Reports to Action: What Good Analytics Looks Like
Analytics isn’t about faster dashboards. It’s about enabling business decisions before the window to act closes.
In well-run teams, analytics supports mid-cycle pivots:
- A negative margin trend triggers price recalibration across SKUs.
- An unexpected OPEX spike leads to immediate spend controls in the affected cost centers.
- Sales compensation is realigned around contribution margin instead of top-line revenue.
The value isn’t in the metric. It’s in how fast Finance can trace variance to its driver, and route the insight to decision-makers who can do something about it.
This is where variance analysis earns its keep. When built on clean, comparable data, it lets Finance go from “what changed” to “what to do about it” within hours, not days.
High-performing teams use analytics not just to explain the past, but to influence forward-looking resource allocation. This is the connective tissue between reporting and strategic financial planning: variance triggers re-forecasting, not just commentary.
“Not everything needs to be in ‘real time.’ Amazon makes billion-dollar decisions using memos. Not dashboards… Faster reporting isn’t better if nobody’s listening.”
Speed doesn’t matter unless it drives a response. That’s the bar analytics needs to clear.
How Two Companies Fixed Reporting and Got Results
You don’t need more data to improve reporting. You need a better structure around the data you already have. These two companies fixed their financial reporting and analytics setups and saw results fast.
Altium: Faster Reporting Across Nine Countries
Altium, a biotech company operating in nine markets, struggled with fragmented reporting. Local teams followed different processes. Actuals came in late. Forecasting was slow, and consolidation took too long.
They moved to a centralized financial model and aligned processes across countries. Reporting cycles became consistent. Forecasts started on time. Finance worked from one source of truth.
The results:
- 30% faster reporting
- 25% shorter forecasting cycle
Altium didn’t simply add more tools. They cleaned up structure, ownership, and timing. That’s what made the difference.
Hrvatski Telekom: Scaling Scenario Planning
With over 50 planners, HT had a different problem. Forecasts came in from dozens of Excel files. Scenarios were hard to consolidate. Reporting logic varied from file to file.
They replaced fragmented spreadsheets with a shared model. Scenario planning became part of the regular cycle. Reports followed a consistent schedule. Teams worked from the same structure, and updates didn’t break the process.
The results:
- 30% faster forecasting
- 80% faster scenario consolidation
HT didn’t need real-time dashboards everywhere. They needed a model built to support fast decisions, and a process that scaled across departments.
Both teams made the same shift: from scattered files to structured reporting. And once that was in place, analytics started to matter.
How to Structure a Reliable Reporting Process
High-quality reporting isn’t a function of software. It’s a function of structure.
In advanced setups, reporting runs on a controlled pipeline:
ERP → staging layer → validation rules → centralized reporting model.
The staging layer serves as a buffer, not a dumping ground. It standardizes data from heterogeneous source systems, runs automated validations (period alignment, FX logic, outliers), and flags anomalies before actuals touch the reporting layer.
From there, actuals integrate into a financial model that also houses budget and forecast data. The model is dimensional (region, channel, product) and versioned (Original Budget, Latest Estimate, etc.). There’s no rework, just changes logged and explained.
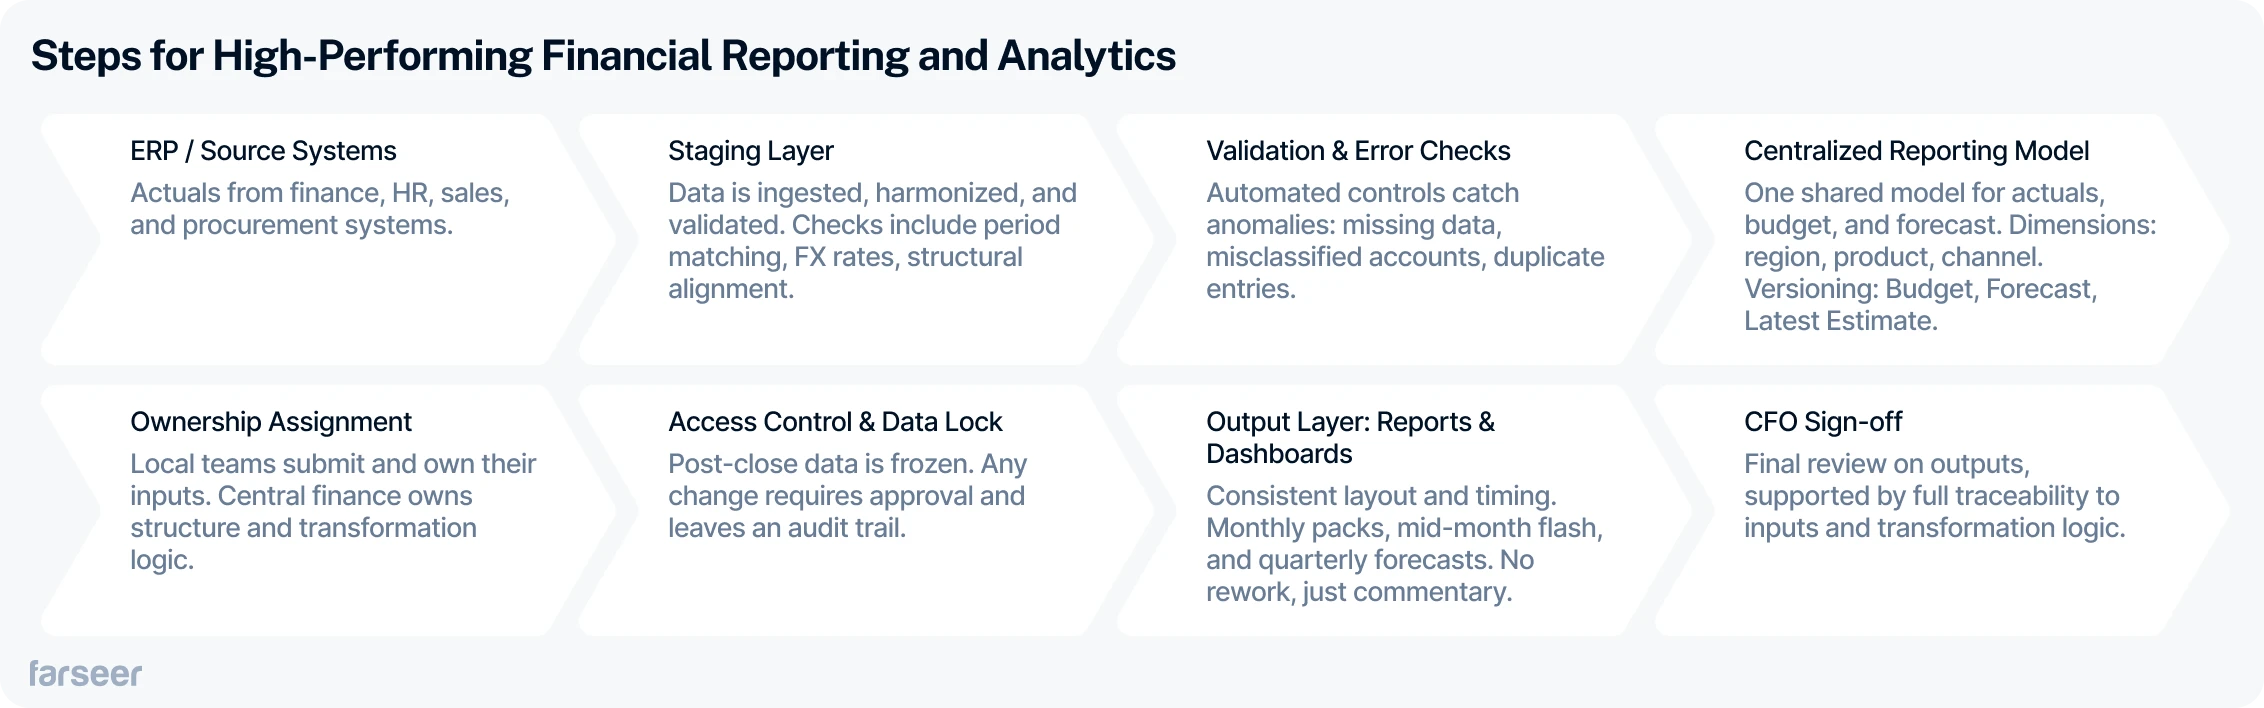
Ownership is distributed:
- Local controllers submit and certify their data.
- Group FP&A owns the reporting logic and transformations.
- CFO sees final output, with traceability to the input.
Access is locked post-close. Edits require audit-logged approvals. This structure lets the team focus on interpreting signals, not reconciling files.
Calendars are stable:
- Close by day 5
- Flash by day 12
- Rolling forecast quarterly, or monthly for volatile business lines
Crucially, the model must treat budget and forecast as separate tools. One sets cost ceilings and accountability. The other adjusts expectations based on actuals. Teams that blur the two often lack clarity when variance hits. This budget vs forecast comparison breaks down where each fits and why both must coexist.
Without structure, reporting becomes reactive. With structure, it becomes predictive.
Common Mistakes That Slow Teams Down
These are the patterns that keep showing up across teams, not because people aren’t capable, but because the structure isn’t solid.
Building reports from scratch every month
Without a reusable reporting model, teams rebuild the same files over and over. It’s repetitive work that introduces risk and delays.
Untracked versioning
When files move across teams without version control, no one knows which version is correct. Finance ends up reconciling reports instead of analyzing them.
Misaligned KPIs
Sales tracks gross revenue. Finance tracks net. Both numbers are technically right, but without shared definitions, they cause confusion. Inconsistent KPIs weaken reporting impact, especially if the finance department hasn’t formalized its performance tracking approach, as covered here in this breakdown on KPI structure.
Excel “heroes” holding it all together
One analyst owns the logic. If they’re out, reporting stalls. There’s no documentation, no backup, and no resilience.
Dashboards that don’t lead to action
Dashboards refresh daily, but no one acts on them. They’re disconnected from decision-making and exist more for optics than performance. Before investing more in dashboards, teams should evaluate whether they’re using the right financial analysis tools to begin with, and if those tools are structured for impact.
Fixing the process matters more than the tools
You can’t automate your way out of a broken structure. Teams that skip process design and jump straight to software often end up back in the same chaos, just with better UI.
Frequently Asked Questions (FAQ)
1. Is financial reporting the same as accounting?
Not really. Accounting tracks and records transactions. Reporting takes that data and turns it into structured outputs like the P&L or balance sheet. It’s the part that shows what’s working and what’s not.
2. What are the main types of financial reporting?
The four standard reports are:
- Income statement (profit and loss)
- Balance sheet (assets, liabilities, equity)
- Cash flow statement (money in and out)
- Equity statement (changes in ownership value)
These are the starting point for almost every analysis.
3. What is variance analysis, and why does it matter?
It’s how Finance compares actuals to budget or forecast. When numbers miss the plan, variance analysis helps explain why. Maybe freight costs spiked. Maybe sales missed target in one region. This is how teams figure out what to fix.
4. What should a junior financial analyst focus on first?
Start with the basics:
- Know how the P&L, balance sheet, and cash flow link together
- Get comfortable working with models, not just raw numbers
- Learn how to explain variances clearly
- Understand what different teams care about in the numbers
5. Do reports need to be real-time to be useful?
Only if someone is going to act on them right away. In most cases, weekly or even monthly is fine. What matters more is that the data is clean, trusted, and tied to decisions.
6. What’s the difference between financial and management reporting?
Financial reporting speaks to regulators, auditors, and external stakeholders. Management reporting helps internal teams track performance, spot issues, and make better calls. This includes statutory reporting, which ensures compliance with GAAP or IFRS requirements and is a crucial part of financial reporting for regulated entities.
Read The Compliance Iceberg: Your Financial Models May Be Missing Billions in Risk