
Enterprise reporting is broken in most companies.
It was meant to align teams, speed up decisions, and bring clarity.
Instead, it became a patchwork of tools, conflicting numbers, and “final_final_v3.xlsx” flying over email.
The problem isn’t the tools. It’s the way reporting is built – disconnected data, no ownership, and dashboards no one uses.
If your reporting setup creates more questions than answers, it’s time to fix the foundation.
Here’s what enterprise reporting should look like – and what stops most companies from getting it right.
Read: Finance Automation in 2025: Tools, Use Cases, and Real-World Strategy
What Is Enterprise Reporting
Enterprise reporting means structured, company-wide reporting based on centralized, trusted data.
It helps leaders and teams make better decisions – fast. Everyone sees the same numbers. In real time. It connects the dots between financials, operations, and strategy – so you’re not just reporting results, but actually understanding what’s driving them.
The best setups are:
- Consistent – no conflicting data across departments
- Automated – no more manual updates or late-night Excel fixes
- Secure – users only see what they should
- Auditable – you know what changed, when, and by whom
This is how reporting actually supports decision-making, not just compliance.
Benefits of enterprise reporting
Why does it matter? Because without solid enterprise reporting, you’re flying blind.
Here’s what strong enterprise reporting actually gives you:
Faster, better decisions – leadership gets the right info at the right time
One version of the truth – no more “wait, which spreadsheet is right?”
Real-time visibility – spot problems before they escalate (In fact, McKinsey found that companies using real-time data outperform peers by up to 20% in EBITDA)
Less manual work – fewer errors, less time wasted on copy-paste
Secure access – people see only what they need to see
Stronger accountability – audit trails show who did what, when, and why
When reporting works, the whole business runs smoother.
Want to see these benefits in action? Read: 10 Ways Farseer Simplifies Enterprise Budgeting and Forecasting
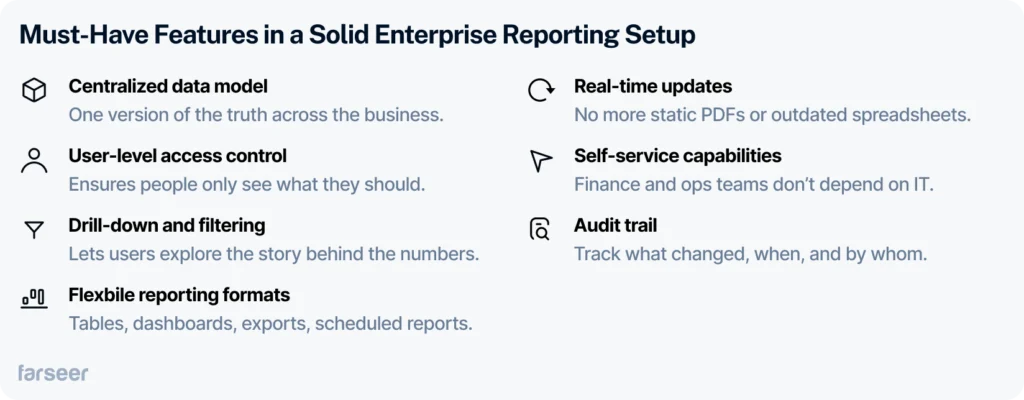
Must-Have Features in a Solid Enterprise Reporting Setup
A good setup isn’t about having all the features. It’s about having the right ones that actually support your business.
Here’s what you really need:
- Centralized data model – one version of the truth across the business.
- User-level access control – ensures people only see what they should.
- Drill-down and filtering – lets users explore the story behind the numbers.
- Flexible reporting formats – tables, dashboards, exports, scheduled reports.
- Real-time updates – no more static PDFs or outdated spreadsheets.
- Self-service capabilities – finance and ops teams don’t depend on IT.
- Audit trail – track what changed, when, and by whom.
How Enterprise Reporting Differs from BI – And Where They Overlap
What they’re for
Enterprise reporting exists to provide structured, recurring updates. It’s about getting the same reliable numbers every week, month, or quarter – fast. Think P&L reports, headcount summaries, budget vs. actuals. It gives leadership a single version of the truth, every time.
Business intelligence (BI), on the other hand, is built for ad hoc exploration. You open it when you have a question and want to dig deeper. It’s less about repetition, more about discovery: spotting trends, testing assumptions, running scenarios.
Who uses it
Reporting tools are built for operational users – CFOs, finance teams, department heads. These people need data to support decisions they make every day, often under pressure. It has to be fast, accurate, and easy to access.
BI tools are more often used by analysts and data-savvy teams. They’re powerful, but require time, skill, and curiosity. BI is great for uncovering “why” something happened – but not always great at reliably showing “what” is happening right now.
Where they overlap
Both tools aim to support better decisions. Both connect to data. Both can create dashboards, filters, and charts. But the difference is in rhythm and purpose. BI is flexible and open-ended. Reporting is consistent and repeatable.
Ideally, you use both: BI to discover the unknown, and reporting to monitor the known. Just don’t expect BI tools to replace structured enterprise reporting – they’re not built for that. And if you try, you’ll end up with frustrated users, broken trust, and a lot of Excel exports.
Still unsure about the difference? Check FP&A Software – A Practical Guide for Finance Teams
Choosing the Right Tools (Without Getting Distracted by Features)
Don’t start with tools. Start with problems. Too many teams jump into vendor demos and get sold on sleek dashboards, AI buzzwords, or 3D pie charts no one asked for.
Stop. Ask yourself first:
- What decisions do we need to support?
- Who uses the data?
- How often?
- In what format?
That’s your shortlist. Everything else is noise.
If you’ve ever sat through one of those vendor demos and thought “this looks powerful, but I have no idea who would actually use it,” you’re not alone. The problem goes deeper than bad UI – it’s a system built to lock you in. Read this no-filter breakdown of why enterprise software is broken – and what needs to change.
Avoid Feature Bloat
Just because a feature exists doesn’t mean your team will use it. A flashy interface won’t fix broken data. And a cool-looking dashboard won’t help if no one opens it.
But some features do move the needle – if they fit your workflow. Like:
- Seamless integration with your data stack
- Real-time performance (not loading time, decision time)
- Self-service options for non-technical users
- Access controls and audit trails
- Smart automation like AI summaries that save hours, not just look fancy
Choose tools your team will actually adopt – not admire from afar.

Know the Difference: BI ≠ Reporting
This one’s big.
Vendors often blur the line between BI and reporting. But they serve different needs.
- BI is for digging. Exploratory. Analyst-driven. Flexible but often slow.
- Reporting is for delivering. Consistent. Trusted. Built for operators and execs.
Mixing them up is how you end up with ten dashboards, no answers, and someone emailing Excel again.
A Softcrylic analysis of Gartner’s Magic Quadrant hits the same point: slow dashboards, duplicate reports, and “multiple versions of the truth” are still common – even with top-rated BI tools.
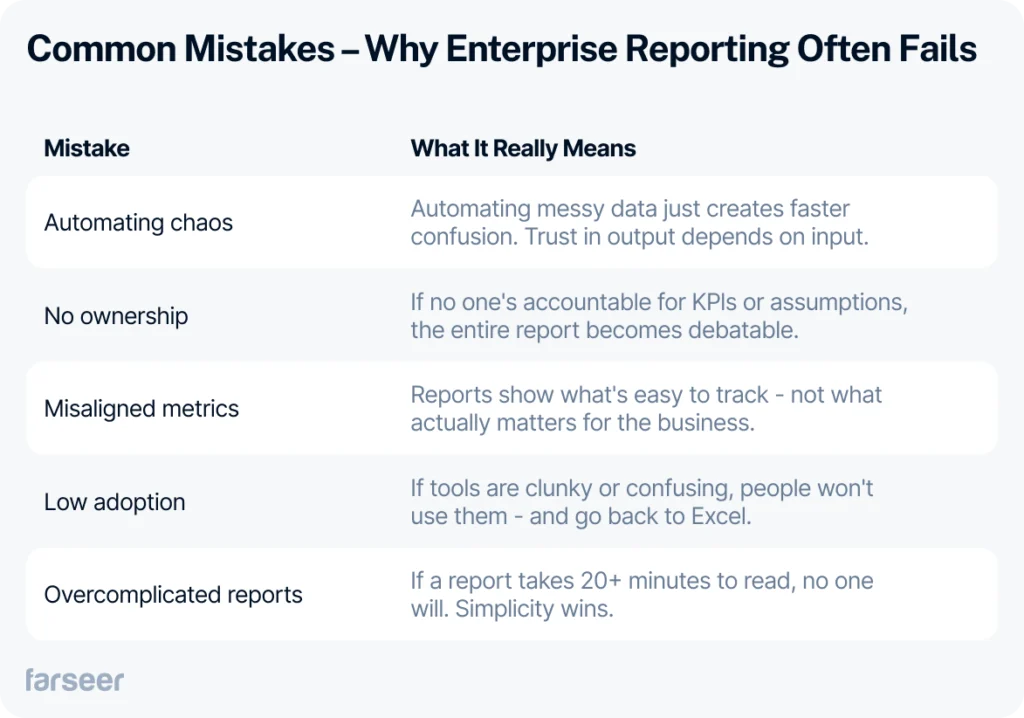
Common Mistakes – Why Enterprise Reporting Often Fails
- Automating chaos instead of solving it
If your data is a mess, automating it just makes the mess faster. You end up with beautiful reports… that still don’t make sense. Automation only works if the process behind it makes sense. If people don’t trust the inputs, no one will trust the output – no matter how slick it looks.
- No clear ownership of the data
Who owns the forecast logic? Who signs off on revenue assumptions? If the answer is “not sure,” you’ve got a problem. Enterprise reporting fails when responsibility is scattered. Without a clear owner, everything becomes debatable – and no one feels accountable.
- Misaligned metrics vs. business goals
Are you reporting what matters – or what’s easiest to measure?
Too many teams track metrics that look good on dashboards but don’t drive decisions. Reporting should reflect real-world targets, not just what your tool can calculate.
- Low adoption
If people don’t use the tool, it doesn’t matter how good it is. Clunky UX, confusing dashboards, or too many steps to get to insights – that’s how adoption dies. And once people lose trust in the system, they go back to old habits (hello, Excel).
- Overcomplicated reports no one reads
If a report takes 20 minutes to understand, it won’t get used. Period. Enterprise reporting should make it easier to see what’s going on – not harder. One clean chart beats ten overloaded dashboards every time.
Want to dig deeper into common reporting mistakes? Read: Financial Reporting Automation – What It Actually Fixes (And Doesn’t)
Real-World Example: How Hrvatski Telekom Fixed Enterprise Reporting
consolidate planning across four subsidiaries. Quarterly planning meant 50+ spreadsheets per planner, slow allocation processes, and days of waiting before reports reached decision-makers.
After switching to Farseer:
- Forecasting time dropped by 30%
- Consolidation of planning scenarios got 80% faster
- 70+ planners moved off spreadsheets
- The team now builds real-time P&L reports for four legal entities in a single model
What used to take 10 days now takes under 2. The CFO’s team isn’t chasing numbers – they’re making decisions.
Why Farseer Works – All-in-One
Most reporting tools solve one piece of the puzzle. Some connect to your ERP. Others build dashboards. A few let you write commentary.
Farseer does all of it – in one place.
You get a single model for budgets, forecasts, and actuals. Reports update in real time. Variances are explained in context. And your team doesn’t need to jump between Excel, BI tools, and emails to get the full picture.
It’s not a BI tool pretending to be reporting. It’s built for structured outputs – the kind your CFO actually uses.
One model. One source of truth. No chaos.
Farseer replaces manual work, not your team. It helps you move faster without losing control. And it scales with your business – no matter how complex the structure.
If your reporting feels like a patchwork of tools and workarounds, it’s time to fix the foundation.
Key takeaways
Enterprise reporting isn’t just dashboards. It’s structured, repeatable reporting built on trusted data – used for decisions, not decoration.
BI ≠ reporting. BI is great for exploring data. Reporting is about delivering reliable numbers to the right people, at the right time.
Tool features won’t fix bad processes. Don’t get distracted by flashy charts or AI gimmicks. If your data is messy, your reports will be too.
Start with the problem, not the vendor. What decisions are you supporting? Who uses the reports? How often? That’s your checklist – not their homepage.
Most failures are human, not tech. No ownership, no alignment on metrics, or reports no one reads – that’s what kills reporting efforts.
Great reporting is boring – in the best way. It’s clean, trusted, consistent, and fast. Farseer helps make that the default, not the exception.