
When two projects both show 40% ROI, most companies assume they are equally attractive. In reality, they may have completely different risk profiles, cash flow timing, and capital impact.
In medium to large manufacturing, FMCG, and pharmaceutical distribution companies, investment decisions are rarely simple. A €3 -10 million CAPEX project affects:
- EBITDA margins
- Cash flow stability
- Debt covenants
- Capacity planning
- Workforce requirements
Yet many investment proposals are still evaluated solely on ROI because it is simple and fast. The biggest issue with ROI is that it ignores time.
Read more: A Complete Guide to Financial Statement Analysis for Strategy Makers
When a business has an investment span of 5 -10 years, which is common in capital-intensive industries, ignoring time can distort capital allocation decisions.
This article explains:
- What ROI actually measures
- What IRR captures that ROI does not
- When to use each metric
- And why structured planning systems like Farseer change how investment decisions are made
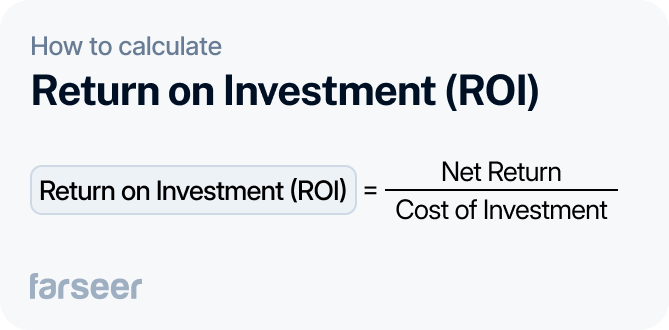
What Is ROI (Return on Investment)?
ROI Formula
ROI = (Net Profit / Investment Cost) × 100
ROI measures how much profit an investment generates relative to its cost.
It answers a simple question:
How much did we earn compared to what we invested?
ROI does not consider:
- When cash flows occur
- Cost of capital
- Risk over time
- Working capital timing
That simplicity explains why it’s widely used.
When Companies Use ROI
ROI works well for:
- Marketing campaigns
- Equipment replacement
- Short-term efficiency initiatives
- Smaller automation projects
Let’s say a distribution company invests €400k in warehouse optimization and expects €120k annual savings. A simple ROI calculation is 30%. For quick screening and short-term projects, ROI is practical and sufficient. But problems start when investments stretch across multiple years.
Example: Production Line Investment
A food manufacturing company invests:
- €2,000,000 in a new production line
- Generates €600,000 additional annual profit
- Project duration: 3 years
Total profit: €1.8 million
ROI = 90%
On paper, it is attractive, but ROI does not show:
- Whether profits come early or late
- The effect of raw material volatility
- Working capital increases in year one
- The company’s cost of capital
ROI treats all euros equally, regardless of timing.
For multi-year strategic investments, that limitation becomes significant.
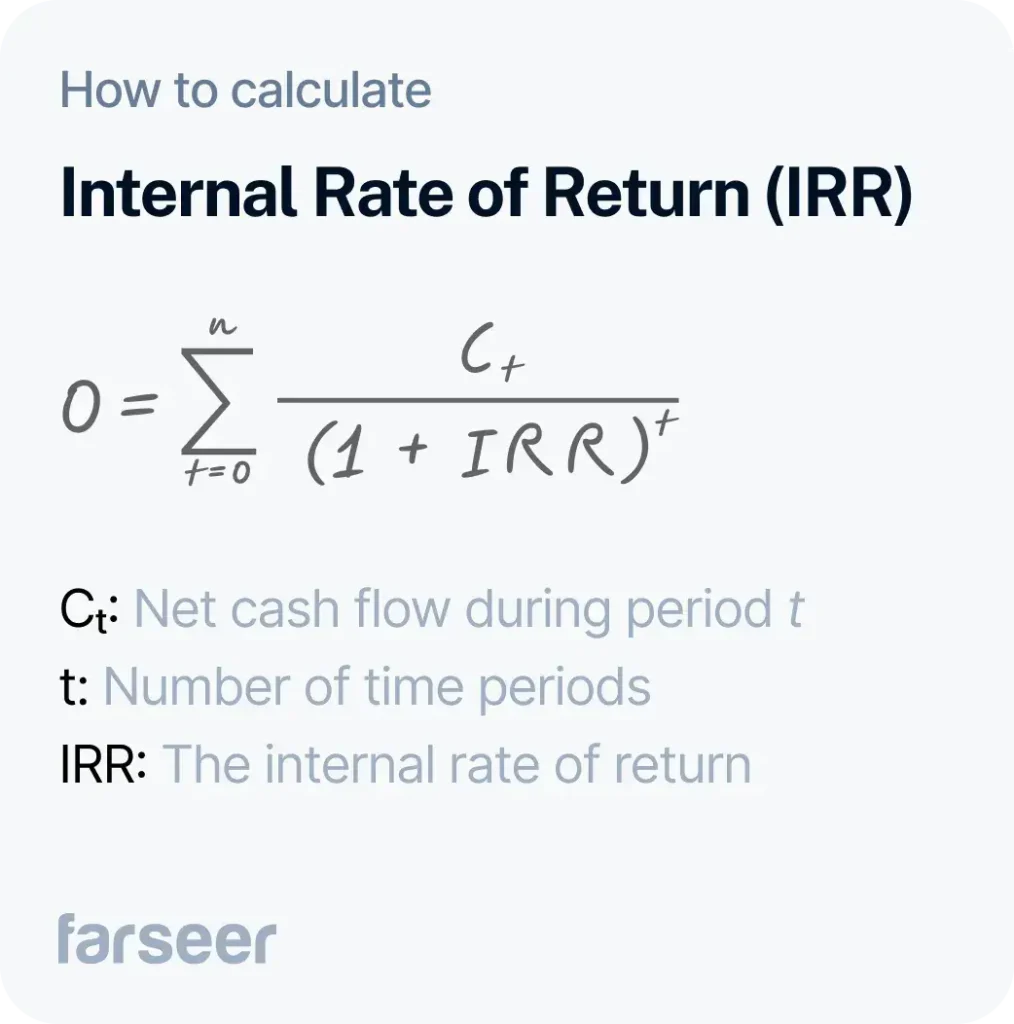
What Is IRR (Internal Rate of Return)?
Internal Rate of Return (IRR) is the discount rate that makes a project’s Net Present Value (NPV) equal to zero.
In simple terms, IRR represents the annualized return generated over the full life of the investment.
Unlike ROI, IRR:
- Accounts for the time value of money
- Uses projected cash flows
- Reflects when money is earned
Decision rule:
- If IRR > WACC → value creation
- If IRR < WACC → value destruction
This makes IRR more suitable for capital-intensive decisions.
Read: Strategic Financial Planning That Actually Drives Results
When IRR Is Essential
IRR becomes critical when:
- Investment spans 5–10 years
- Cash flows are uneven
- Working capital fluctuates
- Terminal value matters
- Financing costs are material
Typical examples include:
- Distribution center expansion
- New production facility
- Automation programs
- Multi-year transformation projects
These projects cannot be evaluated reliably using ROI alone.
Read: Best Capital Budgeting Software: Tools That Go Beyond Approvals
Example: Warehouse Automation Project
A pharmaceutical distributor invests:
- €5,000,000
- Project duration: 7 years
Cash flows increase gradually, with higher returns in later years.
Simple ROI might look strong, but IRR reflects:
- Delayed profitability
- Lifecycle performance
- Sensitivity to the cost of capital
If IRR = 15% and WACC = 11%, the project creates value.
If WACC = 16%, it destroys value, even if ROI appears attractive.
For companies protecting EBITDA margins and liquidity stability, this distinction is critical.
Internal Rate of Return vs ROI: Key Differences
Factor | ROI | IRR |
What it measures | Total return | Annualized return |
Time value of money | Not included | Included |
Data required | Profit & cost | Full cash flow forecast |
Sensitivity to timing | Low | High |
Decision benchmark | Internal target | Compared to WACC |
ROI Is Static
ROI compresses a multi-year investment into a single percentage, ignoring when cash is generated.
It treats €1 million earned in year one and €1 million earned in year seven as financially equivalent. In reality, they carry different liquidity implications, refinancing risks, and opportunity costs.
Early cash improves debt capacity and reinvestment flexibility. Late cash increases exposure to market volatility, demand shifts, and cost fluctuations. From a capital allocation perspective, timing is a risk.
IRR Is Dynamic
Unlike ROI, IRR reflects the full economic lifecycle of an investment.
It incorporates:
- The exact timing of each cash inflow and outflow
- Working capital buildup and release
- CAPEX phasing over multiple periods
- Residual value at the end of the project
IRR measures how efficiently capital is deployed over time, by capturing when cash is tied up, when it is released, and how long the organization remains exposed to operational and market risk.
In other words, IRR translates operational assumptions into capital efficiency.
Common Mistakes When Comparing IRR and ROI
Most mistakes do not come from misunderstanding the formulas. They come from applying the metrics without fully considering capital structure, risk exposure, and forecast reliability.
1. Using ROI for Long-Term Strategic Investments
A common mistake is applying ROI to projects that span many years. Two investments may both show 40% ROI, yet have very different financial profiles:
Project A generates most of its cash in years one and two
Project B produces the majority of returns in years six and seven
From a capital allocation perspective, those outcomes are not equivalent.
Early cash:
- Improves liquidity
- Reduces capital at risk
- Increases reinvestment flexibility
Late cash:
- Extends exposure to operational volatility
- Increases sensitivity to market shifts
- Locks capital in for longer
ROI does not reflect these differences. IRR does.
2. Ignoring the Cost of Capital
IRR only has meaning when evaluated relative to the company’s weighted average cost of capital (WACC).
For example:
- An IRR of 12% creates value if WACC is 9%
- The same 12% IRR destroys value if WACC rises to 14%
In capital-intensive industries, financing costs and leverage levels directly affect investment viability. What matters is the spread between IRR and cost of capital, not the IRR percentage in isolation.
Without this alignment, investment analysis lacks economic discipline.
3. Overestimating Forecast Accuracy
IRR is highly sensitive to long-term assumptions, including:
- Terminal value
- Revenue ramp-up timing
- Late-stage cash flows
- Working capital intensity
Small changes in these inputs can materially shift projected returns.
Read: How to Choose the Right Revenue Forecasting Model for Your Company
A modest delay in implementation or slower market adoption can significantly reduce IRR. When calculations rely on a single forecast, they create false precision.
Structured scenario modeling, base, downside, and stress case, is essential for disciplined capital decisions.
4. Mixing Accounting Profit With Cash Flow
Another frequent mistake is confusing accounting profitability with actual cash generation.
ROI is often based on:
- Net profit
- EBITDA improvement
IRR requires:
- Real cash inflows and outflows
- Working capital adjustments
- Phased CAPEX deployment
Improved EBITDA does not automatically translate into free cash flow. Inventory buildup, payment terms, and capital timing materially influence liquidity.
Investment decisions should be grounded in cash productivity — not accounting optics.
Which Metric Should You Use?
Use ROI When:
ROI is appropriate when the project is operational in nature and limited in scope. It works well when:
- The project duration is short, typically one to three years
- Cash flows are stable and predictable
- Capital exposure is limited relative to overall balance sheet size
- The primary objective is quick screening or prioritization
Read: How to Do a Cash Flow Forecast in Enterprise Environments
Examples include equipment upgrades, process optimizations, or targeted cost-reduction initiatives. In these cases, the timing of cash flows has limited strategic impact, and simplicity improves decision velocity.
ROI provides clarity when the capital at risk is modest and the investment does not materially affect leverage, liquidity, or long-term capacity.

Use IRR When:
IRR becomes essential when investment decisions carry long-term balance sheet consequences. It should be the primary metric when:
- The investment spans multiple years
- Cash flows are uneven or back-loaded
- Working capital intensity is significant
- CAPEX is phased over time
- Financing structure or leverage levels are affected
Strategic CAPEX projects, such as new facilities, distribution expansions, or multi-year automation programs, lock capital into risk for extended periods. In these situations, understanding the annualized return relative to cost of capital is critical.
IRR forces management to evaluate not just profitability, but capital productivity.
A Practical Decision Framework
Instead of reopening the IRR vs ROI debate for every proposal, establish clear capital allocation rules.
Start by categorizing projects based on economic impact, for example:
- Operational efficiency initiatives
- Growth investments
- Strategic or transformational projects
Then define minimum return thresholds aligned with financial discipline:
- ROI thresholds for smaller, short-term initiatives
- IRR thresholds explicitly linked to WACC for multi-year or capital-intensive investments
Finally, require structured scenario analysis for material decisions, including base, downside, and stress cases.
This approach reduces subjective discussions, aligns investment evaluation with capital strategy, and protects long-term value creation.
The Real Differentiator: Planning Infrastructure
The IRR vs ROI debate often focuses on formulas.
In reality, the real constraint is planning infrastructure.
If:
- Cash flow assumptions live in separate spreadsheets
- Scenario modeling requires duplicating files
- Operational drivers are disconnected from financial outputs
- Version control consumes more time than analysis
then even a correct IRR calculation becomes fragile.
This is why many organizations default to ROI, because it is easier to manage in fragmented environments.
As planning complexity grows, with more contributors, more forecasts, and more scenario requests, investment evaluation must become structured.
That requires:
- Centralized planning data
- Driver-based modeling
- Automated scenario recalculation
- Clear ownership of assumptions
This is where platforms like Farseer become critical.
By connecting operational planning (sales volumes, production capacity, pricing, workforce, CAPEX timing) directly to financial outputs, Farseer enables:
- Automatic IRR recalculation when assumptions change
- Instant scenario comparison
- A single source of truth across departments
- Alignment between capital allocation and WACC
Instead of debating whose spreadsheet is correct, teams evaluate investment quality using consistent, transparent assumptions.
At that point, the question is no longer “Which metric should we use?” but “How confident are we in the assumptions behind this decision?”
And that is where structured, system-supported planning, powered by Farseer, makes the difference.
Capital Allocation Is a Process, Not a Formula
ROI tells you how much you earn. IRR tells you how efficiently you use capital over time. But neither metric creates value on its own, structured planning does.
Organizations that improve:
- Data consistency
- Cross-department alignment
- Scenario discipline
- Forecast accuracy
Make stronger capital-allocation decisions and protect margins, liquidity, and long-term value.
The formula matters, but the planning system behind it matters more.
Đurđica Polimac is a former marketer turned product manager, passionate about building impactful SaaS products and fostering connections through compelling content.
FAQ
ROI (Return on Investment) measures total profit relative to the investment cost. It provides a simple percentage showing how much was earned compared to what was invested.
IRR (Internal Rate of Return) measures the annualized return of an investment over its full lifecycle. Unlike ROI, it accounts for the time value of money, cash flow timing, and capital exposure over multiple years.
In short:
- ROI shows how much you earn.
- IRR shows how efficiently you use capital over time.
ROI ignores when cash flows occur. In multi-year investments (5–10 years), timing significantly affects liquidity, risk exposure, and refinancing flexibility.
Two projects may both show 40% ROI, but:
- One generates cash in years 1–2
- The other generates cash in years 6–7
From a capital allocation perspective, these are not financially equivalent. ROI treats all profits as equal, regardless of timing. IRR captures these differences.
IRR should be the primary metric when:
- The investment spans multiple years
- Cash flows are uneven or back-loaded
- Working capital requirements fluctuate
- CAPEX is phased over time
- Financing costs or leverage levels are affected
Typical examples include production facilities, distribution center expansions, automation programs, and multi-year transformation initiatives.
For short-term operational improvements, ROI is often sufficient.
IRR only creates value when it exceeds the company’s Weighted Average Cost of Capital (WACC).
- If IRR > WACC → the project creates value
- If IRR < WACC → the project destroys value
For example:
- IRR = 15% and WACC = 11% → value creation
- IRR = 12% and WACC = 14% → value destruction
The key metric is not IRR alone, but the spread between IRR and cost of capital.
Both ROI and IRR rely on assumptions. If cash flow forecasts, working capital estimates, and CAPEX timing live in disconnected spreadsheets, even a correct IRR calculation becomes unreliable.
Structured planning systems like Farseer enable:
- Centralized data and assumption ownership
- Driver-based financial modeling
- Automated scenario recalculation
- Instant IRR updates when assumptions change
- Clear alignment with WACC
Strong capital allocation is not just about choosing the right formula — it’s about ensuring the assumptions behind the formula are consistent, transparent, and scenario-tested.