
The idea behind a common size balance sheet is simple. Instead of looking at raw numbers, you show each item (inventory, receivables, or fixed assets), as a percentage of total assets.
This makes it much easier to compare different business units, subsidiaries, or even the same company over time. For example, one unit might have €50M in inventory and another €20M. At first glance, that might seem normal, the larger unit should hold more stock. But once you look at the percentages, you realize the first has 40% of its assets in inventory, while the second only has 15%.
That first unit is tying up too much in inventory, maybe overproducing or not selling fast enough. The second one runs leaner and more efficiently. Same numbers, very different story.
If you’re responsible for group reporting, internal benchmarking, or reviewing acquisition targets, this format helps you cut through the noise and focus on structure rather than just size.
In this post, we’ll guide you through where the common size balance sheet fits in, how it helps, and how to avoid the common mistakes finance teams make with it.
Read more: Scenario Planning: How to Prepare Your Business for Uncertainty
What Is a Common Size Balance Sheet?
A common size balance sheet doesn’t replace the standard balance sheet, it adds context. This format is widely used in finance teams and by external analysts to spot structural shifts and highlight inefficiencies that aren’t visible in absolute numbers.
When you look at percentages instead of raw figures, you immediately see where a business is concentrated: in inventory, fixed assets, receivables, or elsewhere.
Let’s take a look in the two abovementioned business units and line items:
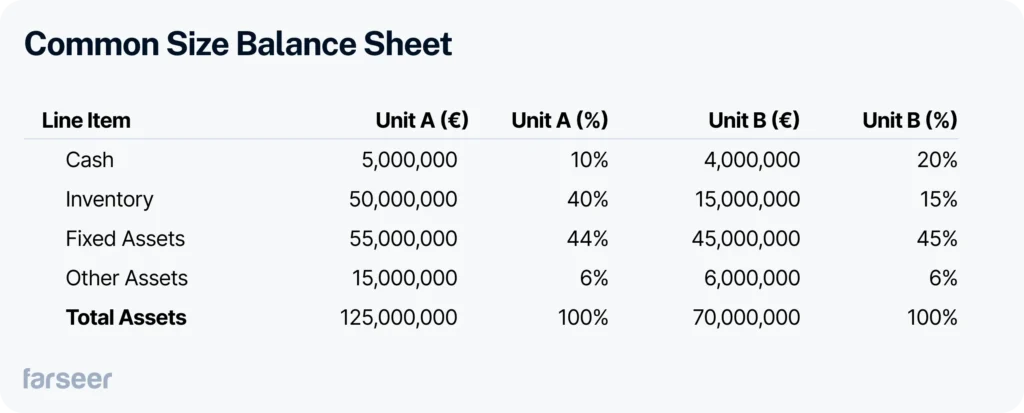
Both units operate in the same group. Unit A holds much more inventory, but when you look at the percentages, it’s clear that inventory makes up 40% of its total assets, compared to just 15% for Unit B.
That shift in perspective can quickly raise questions: Is Unit A overproducing? Is inventory turning slower? Is Unit B more efficient?
This is the value of the common size format, it brings structure into focus, not just size.
How Common Size Balance Sheets Expose Inefficiencies Across Subsidiaries
In group finance, comparing performance across business units is standard, but the raw numbers often don’t tell the full story.
Take the example from earlier: Unit A has 40% of its assets in inventory, while Unit B has just 15%. On paper, both may look profitable. But the structure of their balance sheets reveals something else entirely.
Unit A could be overproducing, turning inventory too slowly, or simply managing stock inefficiently. Unit B, by comparison, runs leaner and holds more cash, 20% vs. 10%, which could indicate better liquidity and working capital discipline.
These insights don’t show up when you’re just looking at totals. But they do when everything is shown as a percentage of total assets.
That’s the value of the common size balance sheet. It gives group finance teams a consistent way to:
- Spot inefficiencies quickly
- Benchmark subsidiaries accurately
- Allocate capital and attention where it’s needed most
Without it, you’re comparing apples to oranges, and often missing what matters.

Key Use Cases for Common Size Balance Sheets
Common-size balance sheets are practical tools that solve specific problems in complex finance environments. Here are a few typical situations where they add immediate value:
Subsidiary Benchmarking
When you’re managing multiple business units across countries or regions, size alone can hide inefficiencies. As shown earlier, one unit might have 40% of its assets tied up in inventory, while another operates with just 15%. The commonsize format makes it clear where resources are being used inefficiently, or too cautiously.
M&A Due Diligence
In acquisition scenarios, a target company might show healthy totals, but a common-size view reveals concentration risks. For example, if a pharmaceutical company has 70% of its assets in intangibles, that could raise questions about valuation, IP risk, or lack of physical infrastructure.
Year-over-Year Structural Shifts
When comparing the same company across time, the common size view helps track how the asset structure evolves. Did inventory rise from 20% to 35% of total assets? Did fixed assets shrink? You see strategic shifts immediately, without being distracted by growth in absolute numbers.
Internal Controls and Policy Enforcement
If your working capital policy aims to keep inventory below 25% of assets, common-size reports help you track compliance across all entities, without creating dozens of custom Excel checks.
Board and Stakeholder Reporting
Common-size balance sheets simplify presentations for non-finance stakeholders. Ratios and percentages are easier to digest than line-by-line numbers. That means clearer communication, and fewer follow-up questions.
Typical Mistakes Finance Teams Make With Common Size Balance Sheets
Even though the concept is simple, common-size balance sheets can be misused, especially when prepared manually or used in isolation. Here are a few common mistakes to watch for:
Comparing Before Cleaning the Data
If the base data isn’t consistent, for example, if different subsidiaries apply slightly different classifications, the percentages won’t mean much. One unit might include advances under receivables, another under other assets. Before applying common-size logic, make sure you’re working with aligned structures.
Ignoring Seasonality
Looking at a single balance sheet snapshot can mislead. A unit might show high inventory in December due to year-end stockpiling. Compare multiple periods or use rolling averages to spot real trends rather than reacting to seasonal noise.
Building It All in Excel
Many teams still build common-size reports manually in Excel. That works, until you add five entities, ten months, and a board deadline. At that point, the risk of formula errors and misaligned totals jumps. Automating this format inside your planning or reporting tool saves hours and avoids errors.

Using It Without Context
Common size is a helpful lens, but not a complete analysis. High receivables might look risky until you realize that business unit deals mostly with government contracts that pay on long terms. Always combine structure-based analysis with operational context.
When done right, common-size reporting brings clarity. When done quickly or inconsistently, it creates confusion. Standardizing the approach across all entities, ideally inside your planning system, makes all the difference.
Standardize the Common Size Format, But Don't Skip the Analysis
By now, it’s clear that the common size balance sheet does more than simplify reporting, it sharpens your view of structure, highlights inefficiencies, and supports better decisions. But only if it’s done right.
Creating it manually works for one entity, one month. Scale that across ten business units and multiple reporting cycles, and the manual approach quickly becomes a liability. Formula errors, inconsistent logic, and wasted hours become the norm, not the exception.
That’s why standardizing and automating this view inside your planning or reporting tool makes sense. As highlighted in KPMG’s Guide to Annual Financial Statements, a consistent format and clear disclosures are key to improving transparency and comparability across the group. And Gartner’s software reviews show that more companies are turning to technology to reduce risk and increase reporting speed.
Still, automation isn’t the final step.
Seeing 40% of assets in inventory might suggest a problem. But whether it’s a red flag or just seasonality depends on context. That’s where operational insight, market understanding, and finance judgment come in.
So yes, automate it. Make it part of your regular reporting cycle. Just don’t stop there. Because percentages alone don’t tell the whole story, but they do help you start asking better questions.
Đurđica Polimac is a former marketer turned product manager, passionate about building impactful SaaS products and fostering connections through compelling content.