YOY (Year-over-Year): Meaning, Formula & Examples

Year-over-year (YOY) measures growth by comparing a metric, such as revenue, from one period to the same period a year earlier.
Why is this important?
Well first, it helps understand trends on a higher scale. And second, it removes the influence of short term events or seasonal fluctuations from the equation.
Read: A Complete Guide to Financial Statement Analysis for Strategy Makers
Let’s see how to calculate it the right way and how it’s used in real life.
How to Perform a YoY Calculation
The YoY calculation formula is simple:
![Formula diagram showing how to calculate Year-over-Year (YoY) Growth Rate: [(Current Period Value − Previous Period Value) ÷ Previous Period Value] × 100. Includes Farseer branding.](https://www.farseer.com/wp-content/uploads/2026/03/yoy_growth.webp)
A company made $10 million in revenue last year and $12 million this year.
YoY Growth Rate = ((12,000,000 – 10,000,000) / 10,000,000) × 100 = 20%
Revenue grew by 20% YoY.
YoY calculation works for revenue, expenses, profit margins, and any other metric that changes over time. It helps track long-term performance and cuts through short-term noise. Horizontal analysis goes a step further by comparing multiple periods to spot trends.
A higher YoY number is not always good. A lower one is not always bad. Context matters.
Example: A 20% revenue increase sounds great, but if expenses grow 30%, the company is losing efficiency. Also, a 10% drop in expenses looks positive, but if it comes from cutting R&D or marketing, growth could slow.
Practical YoY Calculation Examples
Without context, YoY numbers don’t mean much. Here are some examples that show how changes in revenue, expenses, and margins impact your business.
Revenue Growth
A company made $10 million in 2023 and $12 million in 2024.
YoY Growth Rate = ((12M – 10M) / 10M) × 100 = 20%
That sounds like solid growth, but what caused it? If the company expanded into a new market or launched a product, 20% might not be enough. If nothing major changed, it could signal steady organic growth.
Profit Margins
Revenue stayed at $50 million, but gross margin fell from 40% to 37% YoY.
YoY Change = ((37 – 40) / 40) × 100 = -7.5%
A 7.5% drop in gross margin points to rising costs or pricing pressure. If production costs went up, the issue is internal. If competitors lowered prices, the market shifted. Horizontal analysis helps figure out what happened.
Budget vs. Actual Performance

A company expected $20 million in net income but ended up with $16 million.
YoY Forecast Variance = ((16M – 20M) / 20M) × 100 = -20%
A 20% gap between budgeted and actual income isn’t just a miss—it’s a sign something went wrong. Maybe revenue didn’t grow as planned. Maybe costs were higher than expected. Looking at budget vs. actual results helps you figure out what caused the gap and how to fix it.
YoY Calculation vs. Other Growth Metrics
YoY shows how a business is growing year over year, but it’s not always the best way to measure performance. Other metrics can tell a different story.
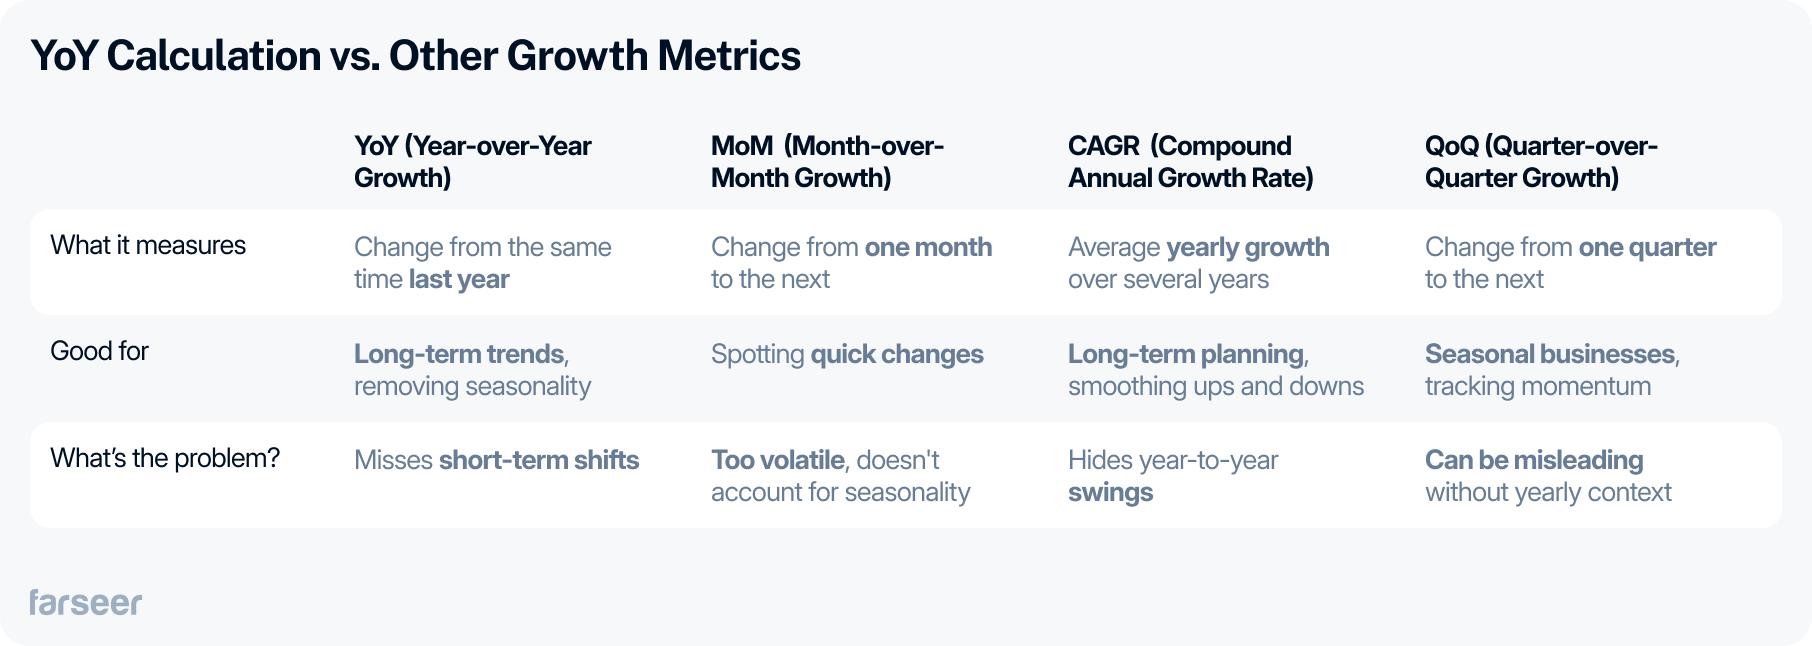
YoY vs. MoM (Month-over-Month Calculation)
MoM tracks short-term changes, while YoY gives a bigger picture. MoM works well for spotting quick trends, but it can be misleading.
Example: A retailer reports a 50% MoM revenue jump in December, but that’s just holiday sales. The real question is whether December outperformed the same month last year. That’s why YoY is more useful for long-term trends.
YoY vs. CAGR (Compound Annual Growth Rate)
YoY looks at growth one year at a time. CAGR tracks the average growth rate over multiple years. If performance swings up and down, CAGR smooths it out.
Example: A company’s revenue grew 10% YoY in 2021, 25% in 2022, and 5% in 2023. CAGR shows the average growth rate over those years, giving a clearer long-term trend.
YoY vs. QoQ (Quarter-over-Quarter Calculation)
QoQ compares performance between consecutive quarters. It works well for seasonal businesses, while YoY removes those fluctuations.
Example: A travel company reports a 40% QoQ revenue increase in Q3, but that’s expected due to summer demand. YoY is better for seeing if Q3 actually outperformed last year.
How YoY Calculation Can Mislead You
The YoY calculation is simple, but it’s easy to misread. Here’s how businesses get it wrong.
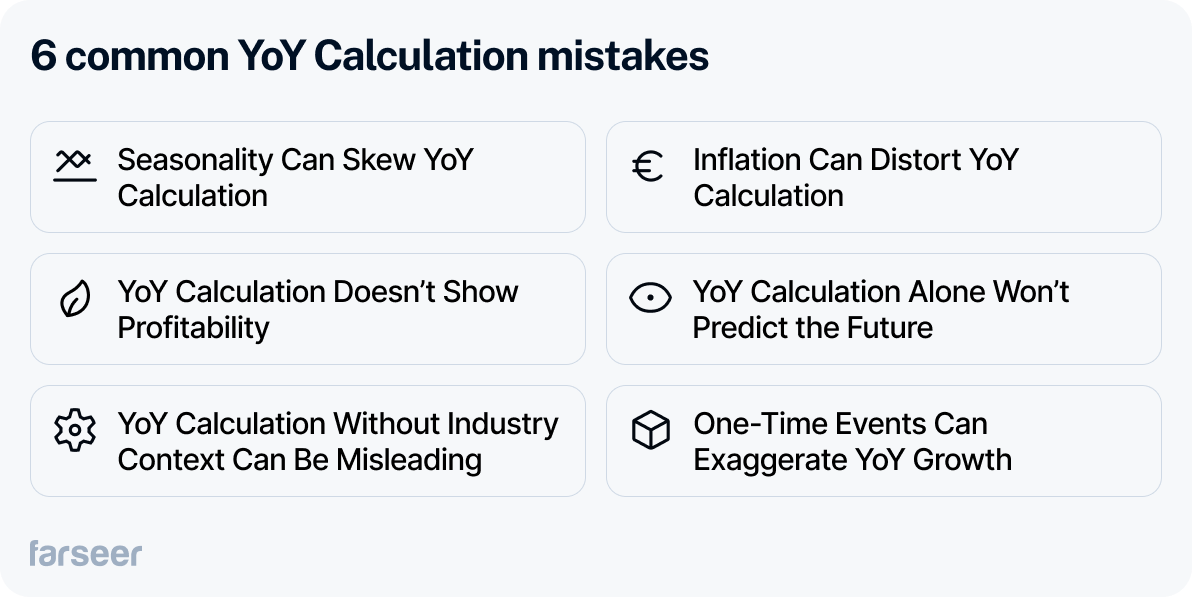
Seasonality Can Skew YoY Calculation
A company reports 30% YoY revenue growth in Q4, but like mentioned earlier, that might just be holiday sales. If last year’s Q4 also had a spike, the real growth could be much lower. Relying only on YoY calculation without adjusting for seasonality can give a false sense of success.
Inflation Can Distort YoY Calculation
Revenue grew 5% YoY, but inflation was 6%. That means real purchasing power actually declined. Without adjusting YoY calculation for inflation, growth numbers don’t tell the full story.
YoY Calculation Doesn’t Show Profitability
Revenue growth doesn’t mean much if profits shrink. As mentioned earlier, a company that grows 15% YoY but sees a 10% drop in net profit margin might be spending too much to sustain growth. Looking beyond YoY calculation is crucial for understanding financial health.
YoY Calculation Alone Won’t Predict the Future
YoY tracks past performance, but it doesn’t show what’s coming. Growth might look strong today, but if demand is slowing or costs are rising, it could become a problem next year. Conducting a spend analysis reveals spending patterns behind YoY changes, helping businesses identify cost drivers and inefficiencies that impact future performance.
Pairing this with rolling forecasts ensures that financial projections stay dynamic, continuously adjusting to real-time data. Instead of relying solely on past trends, businesses can use spend insights to refine forecasts, anticipate shifts, and make proactive financial decisions.
YoY Calculation Without Industry Context Can Be Misleading
A company reports 20% YoY revenue growth, which sounds great—until the industry grew 30% YoY. That means the business actually lost market share. YoY numbers need to be compared against competitors and industry trends to see the full picture.
One-Time Events Can Exaggerate YoY Growth
A company reports 40% YoY profit growth, but last year included a huge one-time expense that lowered the base for comparison. Without adjusting for one-time events, YoY growth can look much stronger (or weaker) than it is.
YoY Calculation and Why Spreadsheets Fall Short
Excel and Google Sheets work for basic YoY calculations. A simple formula like =(New Value – Old Value) / Old Value * 100 gets the job done. But, large datasets, manual updates, and version control issues make spreadsheets unreliable for serious financial analysis.

BI Tools Show Trends, But Don’t Solve the Problem
Power BI and Tableau automate YoY reporting and create dashboards, but they only show the data – they don’t integrate with financial models or explain why YoY numbers change. That leaves gaps in decision-making.
Farseer: The Best Solution for YoY Analysis
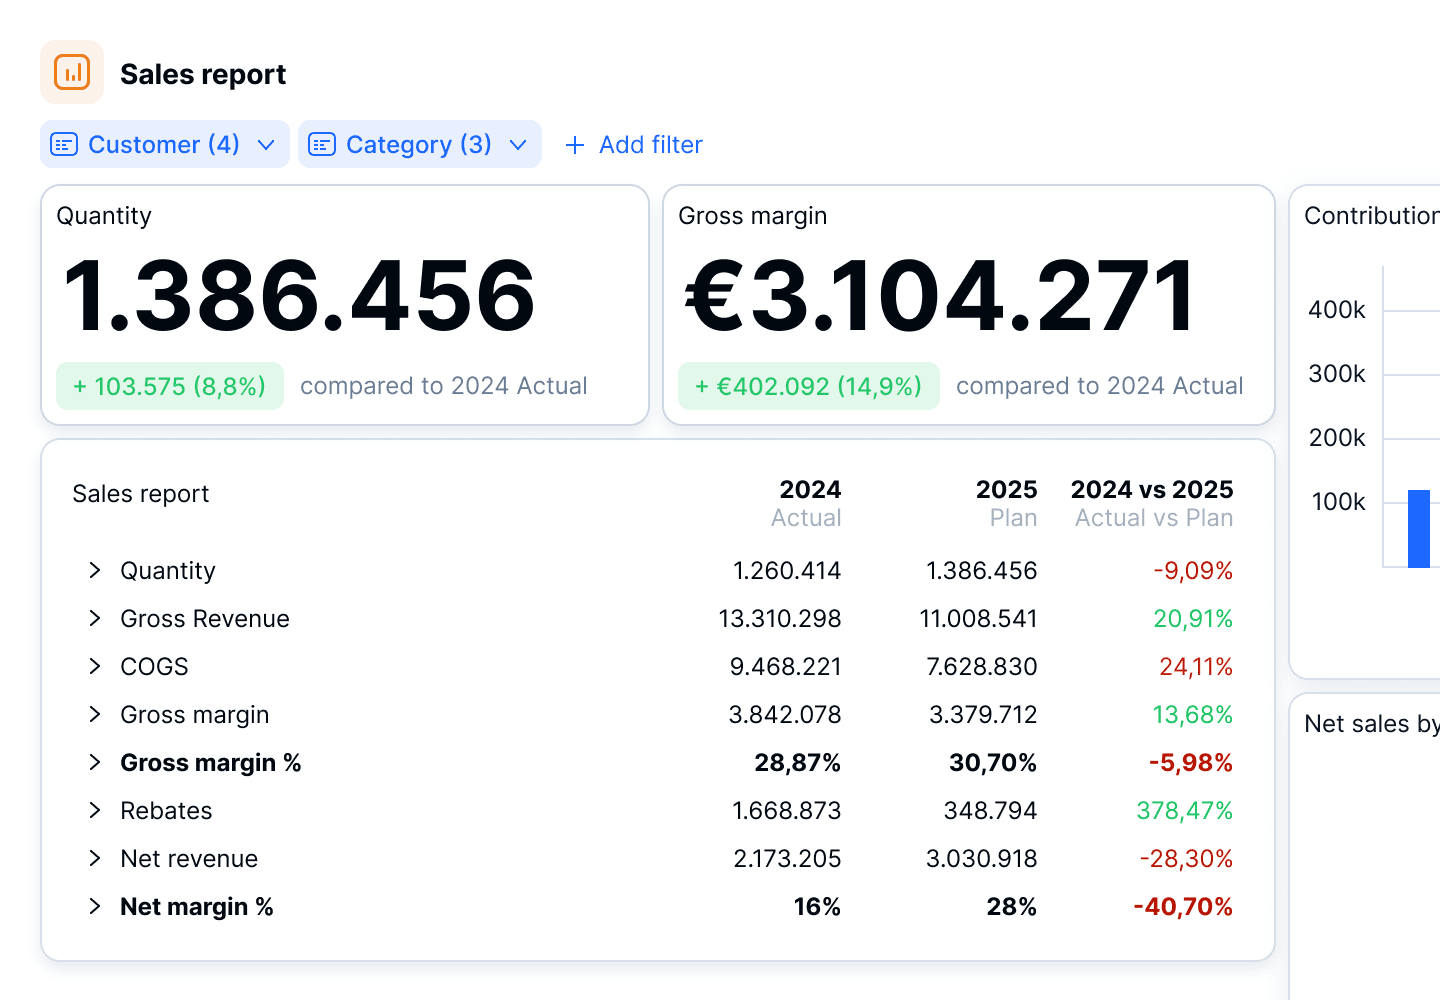
Other tools just show YoY numbers. Farseer automates accurate, real-time YoY calculations and connects them to the bigger financial picture. It does the work for you:
- Live data sync – No more updating spreadsheets or importing CSVs. Farseer pulls YoY data automatically from your ERP, BI tools, and accounting software.
- One-click drill-down – Click on any YoY number to instantly see what changed, why, and how it affects your business.
- Scenario modeling – Want to see how a 5% cost increase impacts YoY growth? Adjust one input and get instant answers—no spreadsheets needed.
- AI-powered YoY forecasting – Stop reacting, start predicting. Farseer analyzes past trends and external factors to forecast where the YoY is headed next—so you can fix problems before they happen.
Stop messing with spreadsheets and outdated reports. Let Farseer handle YoY calculations for you, so you can focus on decisions that actually move the business forward.
Conclusion
YoY calculation helps track business growth, but only when done right.
Without the right context, it can be misleading – seasonality, inflation, industry trends, and one-time events all play a role.
While spreadsheets and BI tools can calculate YoY, they don’t automate the process or explain what’s driving the numbers. Farseer eliminates the guesswork. It automates YoY tracking, connects the data to financial models, and even forecasts future trends.
Stop wasting time on manual reports and let Farseer handle the calculations so you can focus on making the right moves.


Financial Statement Analysis: The Complete Guide (With Step-by-Step Process)
Read more
Best Financial Analysis Tools in 2026: Compare Features & Pricing
Read more