What are ratio analysis limitations?
Ratio analysis is one of the most common ways finance teams measure company performance. It’s designed to give you a quick snapshot of liquidity, profitability, leverage, and efficiency. That’s why they show up in almost every monthly report, board pack, and variance analysis.
But the problem starts when ratios are treated as the full story, when in reality, they’re just high-level summaries based on past performance. As the Corporate Finance Institute explains, ratio analysis is fundamentally backward-looking, which limits its usefulness for forecasting or decision-making. It tells you what changed, but not why.
A recent working paper on ratio analysis backs this up, noting that ratios often fail to reflect the broader context, such as operational risks, future scenarios, or even data inconsistencies caused by siloed systems.
In this blog, we’ll explore why traditional ratio analysis no longer meets the needs of complex finance environments, and show practical, modern alternatives that support faster, more informed decision-making.
Read more: Scenario Planning: How to Prepare Your Business for Uncertainty
Ratio Analysis Limitations: Why It Falls Short in Real Financial Decision-Making
Ratio analysis works well for high-level reporting, but not for real decision-making. Its limitations are obvious in companies where data is scattered across multiple ERPs, Excel files, and BI tools. Just getting the numbers right is slow and manual, and the insight you get in the end is minimal.
Here are some ratio analysis limitations that are critical if you and your team rely solely on ratio analysis.
Limited Business Context
Ratios measure relationships between financial figures, but they don’t explain the underlying reasons. If gross margin drops, the ratio won’t tell you whether the issue was unplanned downtime, increased freight costs, or a pricing decision made by sales. This forces finance teams into manual deep dives just to answer basic questions.
Too Slow for Real-Time Planning
By the time ratios are compiled, validated, and shared, the business situation may have already changed. This delay is especially painful in industries like manufacturing or FMCG, where cost structures and demand fluctuate week to week. Static KPIs can’t support agile decision-making, they simply show where you’ve been, not where you’re heading.
No Support for What-If Scenarios
Planning requires understanding how different decisions might affect outcomes. Supplier risks, FX exposure, shifts in customer payment behavior, have one thing in common – they all need testing. Ratio analysis isn’t equipped for this. It offers no way to test assumptions or model different scenarios, leaving decision-makers without clear guidance.
Built on Fragmented, Manual Workflows
In many companies, financial data lives across multiple ERPs, Excel files, and BI tools. That means ratios are often pulled from disconnected systems, stitched together manually, and prone to inconsistency. When the data isn’t aligned, the ratios built on top of it are hard to trust, and even harder to explain under pressure. Therefore, its important to know ratio analysis limitations.

What Better Looks Like
By addressing only ratio analysis you’ll get a snapshot of the entire financial image. To stay in line with everyday finance you’ll need something more like a live dashboard with a steering wheel. It’s not about replacing ratios entirely, it’s about building a system where financial data is connected, forward-looking, and tied to actual business activity. Here’s what that looks like in practice:
1. From Static Ratios to Driver-Based Models
Instead of just measuring results, better reporting starts with identifying what’s driving them. A 2% drop in gross margin isn’t helpful unless you can trace it to changes in production output, raw material costs, or discount levels. Driver-based models link financial performance to operational levers, so you can explain results clearly and adjust them proactively.
For example, we can take a regional food manufacturer with connected SKU-level sales, production hours, and material costs in a single model. Having everything in one model helped the finance team spot that a seemingly small shift in product mix was eroding margins faster than expected.
2. From Historical KPIs to Scenario-Based Planning
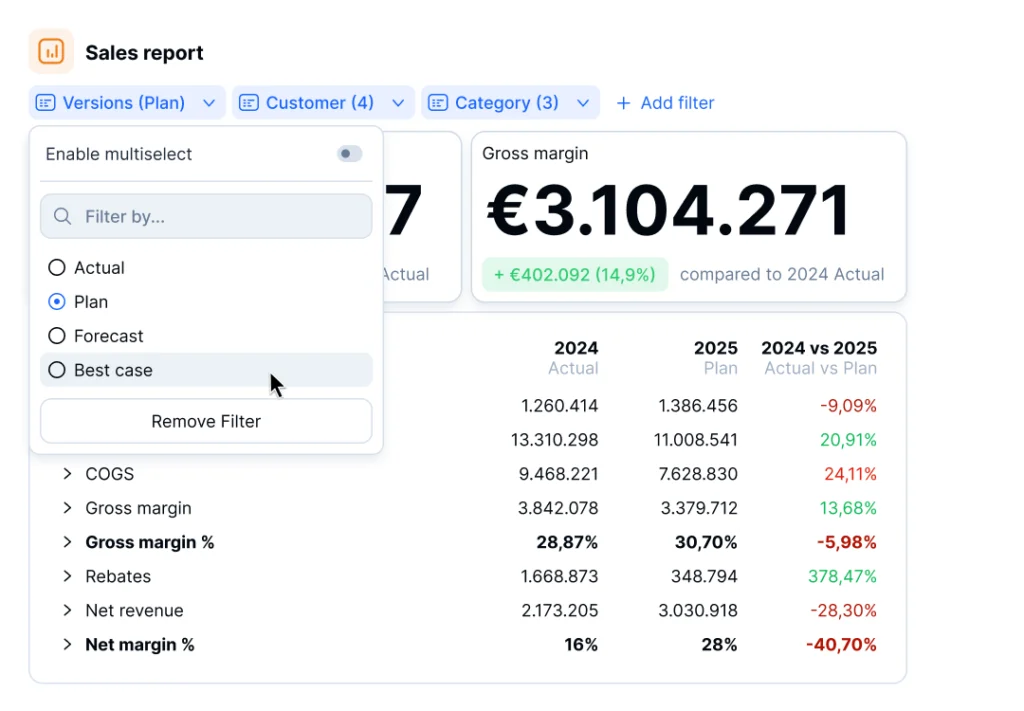
In unpredictable environments (volatile input prices, supply chain disruptions, labor shortages) finance teams need to understand how different decisions will affect outcomes before they happen. That’s where scenario planning comes in.
Instead of relying on static KPIs, modern reporting enables teams to test questions like:
- What happens to EBITDA if raw material costs rise by 8%?
- Can we absorb a 10-day delay in receivables from our largest customer?
These are everyday challenges in industries like pharma, logistics, and manufacturing. As Gartner explains, scenario planning helps finance leaders respond faster to change by modeling risks and shifting conditions, instead of reacting too late.
3. From Siloed Tools to Integrated, Real-Time Data
Many companies still build their financial reports using a mix of ERP exports, Excel workbooks, and BI dashboards. This setup often leads to errors, delays, and a lot of manual work. In fact, research shows that even well-used spreadsheets carry formula-level error rates that can, in some instances, cost organizations millions of dollars.
Moving to an integrated data platform changes that. It removes the need for manual consolidation, reduces the risk of errors, and speeds up both closing and planning cycles. With a single source of truth in place, finance teams spend less time fixing spreadsheets, and more time delivering the insight leadership needs to make confident, timely decisions.
4. From Reporting Outputs to Real Business Insight
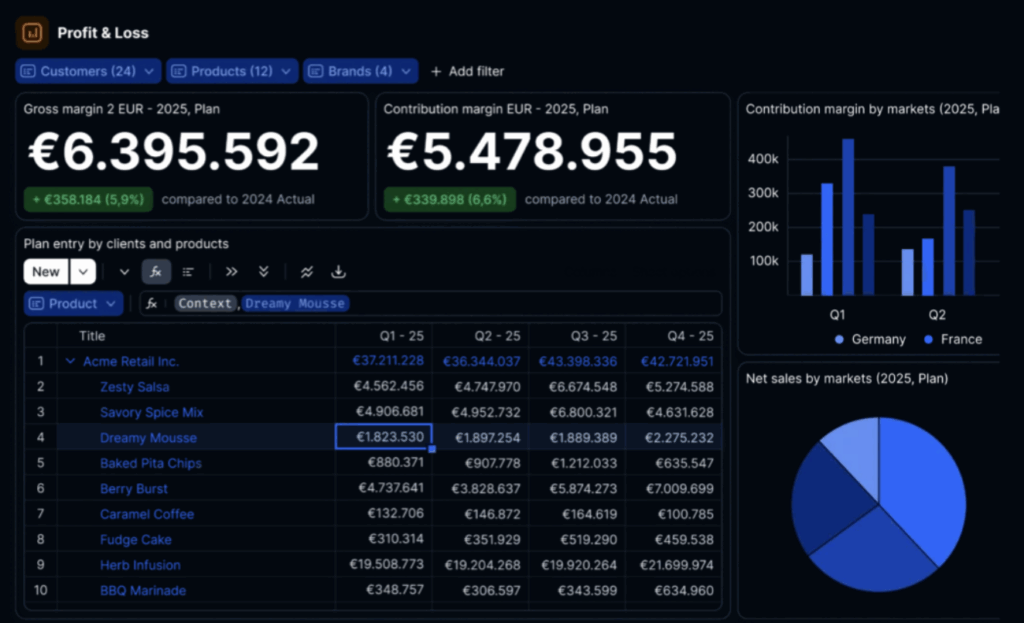
The best finance teams enable decisions through their numbers. Better tools allow them to build custom dashboards with real operational insight behind the KPIs. Instead of reporting that margin dropped, they can explain exactly where and why, and what can be done about it.
Ratio analysis isn’t going away, it still has its place in financial reporting. But relying on it as your main tool for understanding and steering the business is no longer enough. Today’s finance teams need reporting that does more than summarize the past. They need tools that help them explain results, test assumptions, and guide decisions with confidence.
Better Reporting Starts With Better Questions
Finance teams that can, in real time, answer questions: What’s behind this number? What happens if we change course? What do we need to act on now?, will lead the way in business impact.
Better reporting is all about building finance functions that helps the business ask smarter questions, and answer them faster. When your team can explain the why behind performance, model the impact of change, and support strategic choices with confidence, reporting becomes a source of value. If ratio analysis is your routine, it’s time to challenge what you’re getting out of it. Better questions lead to better decisions, and that’s where real financial leadership begins.
Ratio analysis still has a place, but it’s no longer the backbone of effective financial reporting. If you’re still building reports around static ratios and manual exports, it’s worth asking: what is that really costing your team in time, clarity, and agility?
Đurđica Polimac is a former marketer turned product manager, passionate about building impactful SaaS products and fostering connections through compelling content.

