
A forecasting tool isn’t something most finance teams actively picked from the start. They defaulted to Excel – not because it’s great for rolling forecasts, but because it was already there.
It works – until it doesn’t.
If this sounds familiar, you’re not alone. Excel simply wasn’t made for fast, flexible forecasting across multiple teams or companies. It’s time-consuming, it breaks easily, and it lacks real-time data sync, especially when pulling inputs from several systems like ERPs, CRMs, or DWHs. That’s why so many companies are now actively looking for a better way.
Read: Rolling Forecast – 101 Guide For Smarter Planning
But what does “better” actually mean when it comes to rolling forecasts?
Let’s break it down.
What the “Right Tool” Really Means for Rolling Forecasting
Switching from Excel may seem like a true nightmare at first – you’re probably thinking about a huge amount of data that needs to be moved somewhere else, data sync, education of all departments involved in the system, etc. But what you’re maybe not aware of at the beginning is how easy your life would be afterwards.
If you pick the right forecasting tool, of course.
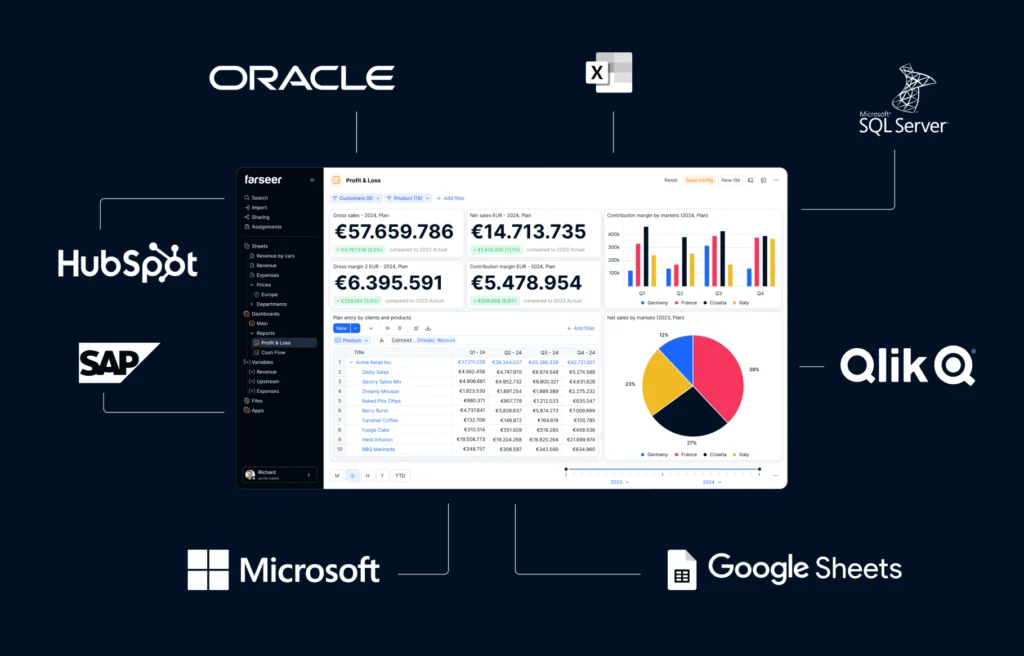
The right forecasting tool should connect directly to your ERP and data warehouse, not force you to export and clean data every week. If actuals from SAP or Microsoft Dynamics take two days to get to your forecast model, you’re always playing catch-up.
You also need the flexibility to run multiple scenarios (best case, base case, worst case) without building three separate files. That flexibility becomes even more valuable when you’re working with a hybrid revenue forecasting model, where different inputs and assumptions need to stay aligned in real time. Finance teams should be able to compare the impact of a price change or hiring freeze in minutes, not days.
And then there are different time levels. Some teams forecast monthly, others do it quarterly, and some switch depending on the department. Your tool needs to keep up without creating a new model from scratch every time.
How to Evaluate Forecasting Tools
There’s a multitude of tools out there claiming to “streamline forecasting.” But most of them fall short where it counts. Here’s what to keep in mind.
Integrations
Start with integration. Your forecasting tool should seamlessly connect with the systems you already use – your ERP, CRM, and data warehouse. If pulling actuals from SAP, Microsoft Dynamics, or NetSuite requires exporting spreadsheets, transforming data manually, or writing scripts, you’re bringing in risk and wasting time.
The same goes for reporting. You should be able to push forecasts directly into tools like Power BI or Tableau without the need for custom APIs or developer support.
Finance teams need to be self-sufficient. If every model refresh or report update depends on IT, it slows down decision-making and creates unnecessary delays. That’s not sustainable when you’re managing forecasts that shift monthly, or even weekly.
Integration is in fact a core requirement that ensures speed and control.
Before shortlisting vendors, review our guide to Planful competitors to see strengths, limitations, and fit for rolling forecasts.
Ease of use
A forecasting tool shouldn’t require a week of training or a background in SQL just to make a simple update. It needs to work for the entire finance team – whether that’s a group of five planners or twenty contributors across multiple business units.
If only one person on the team knows how to maintain the model, what happens when they’re out or leave the company? You’ve exchanged Excel chaos for a different kind of risk: a knowledge bottleneck.
And in many cases, that bottleneck isn’t just bad luck – it’s how most enterprise tools are designed. Overcomplicated on purpose.
Here’s why so much enterprise software keeps you dependent – and what we should expect instead.
Instead, look for tools with clear logic flows, user-friendly interfaces, and guided workflows. Planners should be able to input data, adjust assumptions, and run scenarios without the need to rely on that one person that knows it to “fix the model” every time something changes.
Transparency
Another critical piece: transparency. You need to see exactly how your numbers are built – no hidden logic, no unexplained variances, no guesswork.
Every formula, assumption, and driver in your forecast should be easy to trace and audit. Whether it’s a revenue growth rate pulled from historicals or a headcount driver linked to HR data, the path should be clear and easily editable.
This isn’t just about internal clarity. During reviews or board meetings, leadership will ask, “Why did we forecast a 12% increase here?” If you need to dig through layers of hard-coded cells or undocumented rules to find an answer, you’ve lost trust before you’ve even explained the number.
It’s even more important when you’re dealing with auditors or regulators.
Transparency isn’t optional – it’s how you defend your model, your assumptions, and your decisions.
A modern forecasting tool should make it easy to understand what’s driving your outputs. If it feels like a black box, it’s not built for finance.
Read Projection vs. Forecast – Why Rolling Forecasts Are A Better Choice
Regulatory support
Speaking of audits – regulatory support is often overlooked until it’s too late. Most teams focus on speed and flexibility when choosing a forecasting tool, but forget about compliance until it becomes a problem.
If your company operates in a regulated industry or plans to expand into one, audit support isn’t optional. Your tool should log changes, track user input, and provide version control you can actually rely on.
A forecast might be forward-looking, but the evidence behind it needs to hold up under scrutiny.
Rolling Forecast Features That Actually Save Time
Modern forecasting tools should do more than just replicate what you already have in Excel – they should remove the repetitive work entirely.
Start with driver-based forecasting. When your models are built on business logic, like revenue per unit or cost per hire, you only need to update the drivers, not every single line item – even quick tools like a profit margin calculator can help validate assumptions in real time.
Then look at template reuse. If each department or subsidiary has to build its own model from scratch, you’re making a perfect setting for inconsistency and duplication. The right tool lets you apply the same structure across different business units, but still allows local input and control.
And now, AI support is pushing efficiency even further. With, for example, Farseer AI, you can detect anomalies in forecasts, surface key trends automatically, and even get suggestions for adjusting assumptions based on historical patterns. That means less time digging into the data – and more time acting on it.
And don’t underestimate the value of collaborative workflows. When multiple users can input data simultaneously, without sending files back and forth, you cut weeks off your planning cycle. Approvals, comments, and adjustments happen inside the tool, not over endless email threads.
Final Checklist: 7 Questions to Ask Vendor About Rolling Forecasts
Before you choose a forecasting tool, make sure it can answer these questions:
- Can we run multiple scenarios in parallel across business units?
- How long does it take to import actuals from our ERP?
- Can non-technical users maintain the model without IT support?
- Is there full version control and audit history?
- How does it support our reporting stack (Power BI, Tableau, etc.)?
- Can we adjust time granularity without rebuilding the model?
- How are assumptions, drivers, and formulas documented and tracked?
If a vendor can’t give you clear answers, or better yet, show you live, it’s a red flag.
Your Rolling Forcasting Tool Should Scale With You
Rolling forecasts are supposed to make your planning more agile, not harder to manage. But that only happens if the tool fits how your business actually works.
As companies grow, their planning needs get more complex. More data, more stakeholders, more scenarios. The right forecasting tool should bring efficiency, control, and adaptability, not more manual work.
Whether you’re centralizing planning across subsidiaries, running frequent reforecasts, or preparing for ESG audits, your tool shouldn’t hold you back. It should help you move faster, stay accurate, and stay in control.
If you’d like to give Farseer a try, we’d be happy to give you a test run. Make sure to schedule a demo, and let’s see how Farseer’s rolling forecasts can help you scale your business.