Choosing the Right Financial Reporting Tool: 9 Options Compared

In many mid-sized and enterprise companies, financial reporting still relies on a fragile setup. Teams use Excel for consolidation, a BI tool for dashboards, and an ERP that was never built for flexible analysis. As a result, reporting takes too long. Reconciliations stay manual. And finance teams keep answering the same question: which numbers are correct?
As companies grow, this setup stops working. More entities, frequent forecasts, and higher expectations from management increase the pressure on finance teams. They need fast access to accurate data. Static reports prepared weeks after month-end no longer help.
Read more: What Great Financial Reporting and Analytics Actually Look Like
Because of this, companies now rethink how they handle reporting and planning. According to Gartner, by 2026, 70% of organizations will unify financial and operational planning using extended planning and analysis (xP&A) platforms.
The reason is simple. Modern financial reporting tools help teams:
- Reduce manual consolidation and reconciliation
- Improve data consistency across entities and departments
- Compare actuals vs. plan without rebuilding reports
- Shorten reporting cycles and react faster to change
Therefore, in industries like manufacturing, pharmaceuticals, retail, and logistics, reporting often determines whether finance supports decisions or only documents the past.
In this article, we compare 9 financial reporting tools used by complex organizations today. For each one, we show where it works well and where it falls short. This should help you decide which options deserve deeper evaluation.
Microsoft Power BI - Strong Visualization, Limited Financial Logic
Power BI is one of the most widely used reporting tools. Many companies adopt it when they move away from static Excel reports. It works especially well in organizations already using Microsoft products.
However, Power BI is not a financial reporting tool by design. It focuses on visualization. As a result, finance logic such as allocations or budget vs. forecast comparisons must be built manually.
Key Reporting Capabilities
- Interactive dashboards and visual reports
- Fast analysis of large datasets
- Integration with Excel, SQL databases, and ERP systems
- Drill-down and filtering across dimensions
Pros
- Strong visualization and dashboarding capabilities
- Familiar ecosystem for Excel and Microsoft users
- Scales well with large volumes of data
- Useful for management-level KPI reporting
Cons
- No native financial planning or reporting logic
- Heavy reliance on DAX models and technical setup
- Finance teams often depend on BI or IT support
- Actuals vs. plan reporting requires custom modeling
When Power BI Is a Good Fit
Power BI works best for companies that:
- Already have clean, structured data in a data warehouse
- Need visual dashboards rather than finance-driven reports
- Have BI or IT resources to maintain data models
- Use Power BI as a layer on top of other planning tools
Typical Limitation in Practice
In many manufacturing and retail companies, Power BI sits on top of Excel planning. This often creates duplicated logic and reconciliation issues.
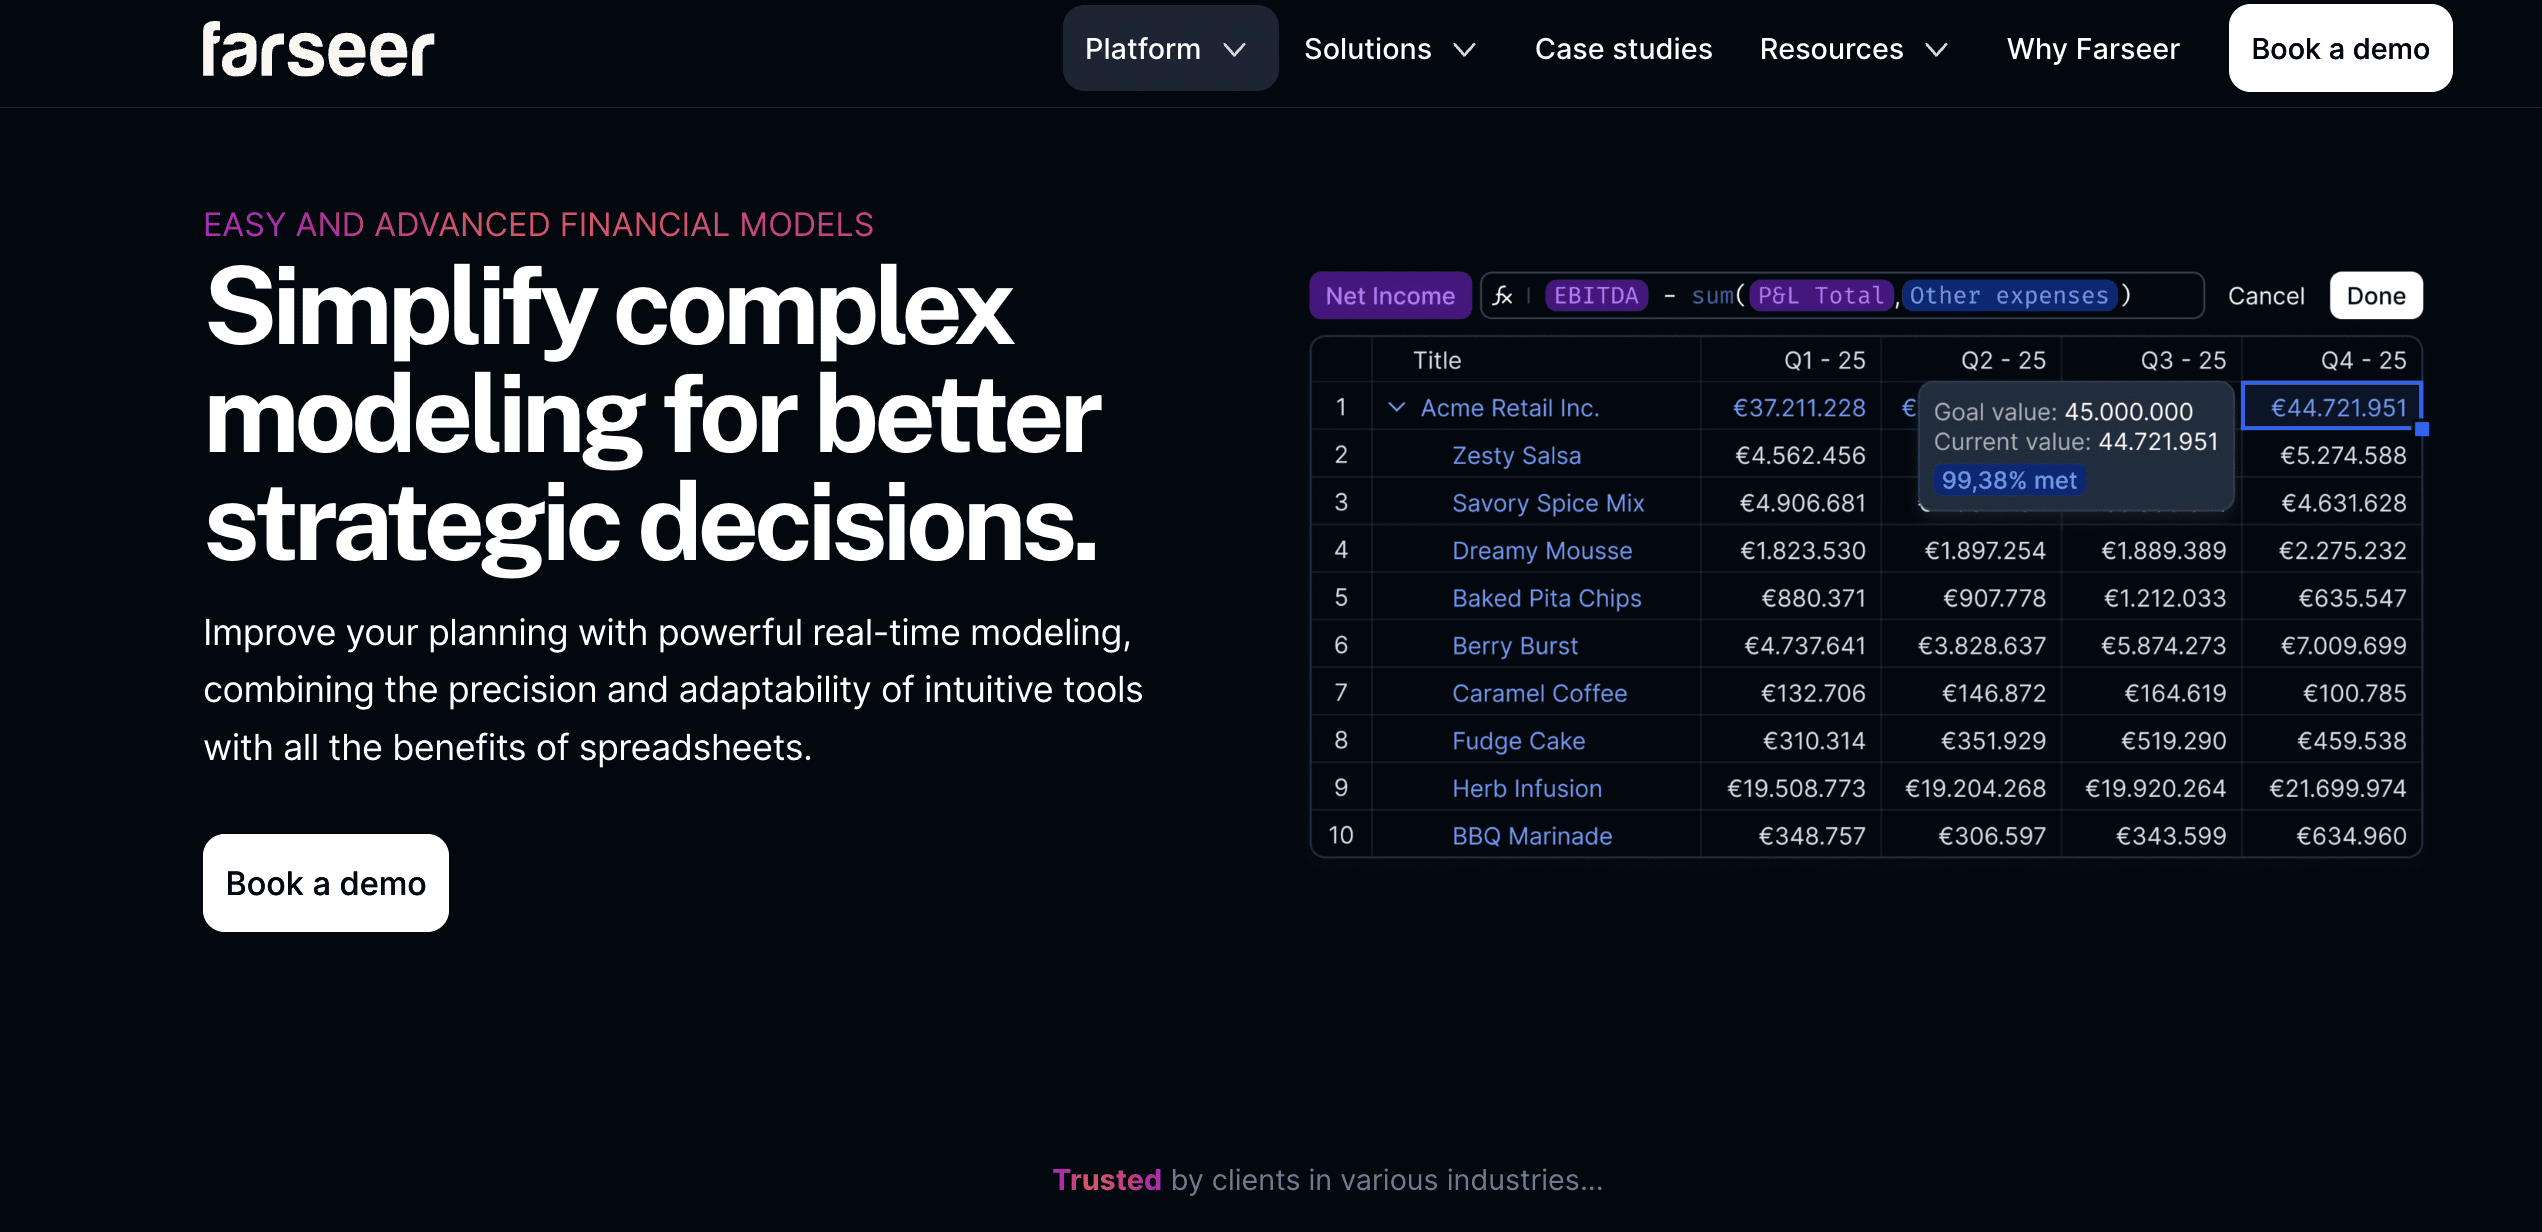
Farseer - Financial Reporting Built for Integrated Planning
Farseer is a financial reporting and planning platform for companies that have outgrown Excel and disconnected BI tools. It combines reporting, budgeting, forecasting, and scenario analysis in one system. As a result, it fits organizations with complex structures and frequent planning cycles.
Unlike BI tools, Farseer uses finance logic at its core. Reports connect directly to plans and forecasts. Therefore, actuals vs. plan reporting, rolling forecasts, and multi-entity consolidation all run in the same model.
Key Reporting Capabilities
- Actuals vs. budget vs. forecast reporting in one view
- Multi-entity and multi-currency consolidation
- Drill-down from the group level to the cost center or account
- Driver-based reporting linked to operational data
- Real-time updates when assumptions change
Pros
- Strong finance logic without heavy IT dependency
- Reporting and planning in the same environment
- Handles complex structures (entities, departments, regions) well
- Faster reporting cycles compared to Excel-based setups
- Flexible for industries like manufacturing, pharma, and retail
Cons
- Assumes a defined planning and reporting process
- Less suitable for very small teams with basic reporting needs
When Farseer Is a Good Fit
Farseer is well-suited for companies that:
- Need reliable actuals vs. plan reporting
- Operate across multiple entities or countries
- Want to reduce Excel dependency
- Run budgeting and forecasting several times per year
Typical Usage in Practice
Finance teams use Farseer to keep reporting aligned with budgeting and forecasting as assumptions change. They handle consolidation and management reporting without rebuilding Excel files.
Tableau - Advanced Analytics, Limited Finance Structure
Tableau is a well-known analytics and visualization platform. Companies often use it to improve visibility and give management interactive reports.
From a financial reporting perspective, Tableau focuses on analysis, not structure. While it displays financial data well, finance teams must design reporting logic outside the tool.
Key Reporting Capabilities
- Highly interactive dashboards and visual analytics
- Strong drill-down and filtering across large datasets
- Integration with databases, data warehouses, and ERP exports
- Flexible visual design for management reporting
Pros
- Powerful analytics and visualization capabilities
- Suitable for exploratory analysis and ad-hoc reporting
- Scales well in complex data environments
- Widely used across business functions
Cons
- No native financial reporting or planning logic
- Actuals vs. budget or forecast comparisons require external modeling
- Finance teams depend on IT or data teams for setup and maintenance
- Limited control over financial structures like entities and allocations
When Tableau Is a Good Fit
Tableau works best for companies that:
- Already have a centralized data warehouse
- Need advanced visual analytics rather than structured financial reporting
- Use Tableau mainly for management dashboards
- Complement it with another tool for budgeting and planning
Typical Limitation in Practice
Retail and logistics companies often use Tableau after consolidation happens elsewhere. This delays insights when numbers change.
Workday Adaptive Planning - Enterprise-Grade CPM with Reporting Capabilities
Workday Adaptive Planning is a CPM platform mainly used by large organizations. It supports budgeting, forecasting, and financial reporting at scale.
Adaptive relies on predefined structures. Therefore, it supports standardized processes rather than flexible, finance-owned models.
Read: 4 Workday Adaptive Planning Competitors Worth Considering in 2026
Key Reporting Capabilities
- Standard financial statements (P&L, balance sheet, cash flow)
- Actuals vs. budget and forecast reporting
- Multi-entity consolidation and currency handling
- Predefined dashboards for management reporting
- Integration with ERP and HR systems
Pros
- Strong structure for enterprise-wide reporting
- Well-suited for standardized financial processes
- Handles complex organizational hierarchies
- Part of the broader Workday ecosystem
Cons
- Long implementation cycles compared to mid-market tools
- Custom reporting often requires consultants
- Less flexible for rapid model changes
- Heavier process overhead for finance teams
When Adaptive Planning Is a Good Fit
Adaptive Planning works best for companies that:
- Operate at enterprise scale with standardized processes
- Prefer structured, template-driven reporting
- Already use Workday for HR or financials
- Accept longer implementation and change cycles
Typical Limitation in Practice
In companies with frequent forecast updates, reporting changes often take too long because external support is required.
Jedox - Excel-Oriented Reporting with CPM Capabilities
Jedox combines financial reporting and planning with a strong Excel focus. Companies often choose it when they want more structure but still prefer spreadsheets.
Read: Looking for Jedox Competitors? Here Are the 7 Best Options
Key Reporting Capabilities
- Financial statements and management reports
- Actuals vs. budget and forecast comparisons
- Multi-entity and multi-currency consolidation
- Excel and web-based reporting interfaces
- Workflow support for reporting cycles
Pros
- Familiar Excel-like experience for finance teams
- Combines reporting and planning in one platform
- Suitable for structured group reporting
- Flexible reporting layouts
Cons
- Heavy reliance on Excel logic remains
- Customization often requires consultants
- The interface can feel less intuitive for non-finance users
- Performance can be affected by very large datasets
When Jedox Is a Good Fit
Jedox works best for companies that:
- Want to keep Excel at the center of reporting
- Need structured financial statements and consolidation
- Have a finance team comfortable with spreadsheet logic
- Prefer gradual process changes rather than a full redesign
Typical Limitation in Practice
In FMCG and manufacturing, Jedox often becomes an organized Excel layer. This improves structure but limits flexibility when requirements change.
IBM Planning Analytics - High-Performance Engine for Complex Reporting
IBM Planning Analytics (TM1) is known for performance and scale. Large organizations use it for complex reporting and modeling.

Key Reporting Capabilities
- High-performance multi-dimensional reporting
- Complex actuals vs. plan and scenario analysis
- Multi-entity consolidation at scale
- Custom financial models and calculations
- Integration with ERP and data warehouses
Pros
- Very fast calculation engine
- Handles highly complex reporting models
- Scales well across large organizations
- Proven solution in enterprise environments
Cons
- Steep learning curve for finance users
- Heavy reliance on IT or specialized TM1 modelers
- Reporting changes often require technical effort
- User interface feels dated compared to newer platforms
When IBM Planning Analytics Is a Good Fit
IBM Planning Analytics works best for companies that:
- Have very complex reporting and modeling needs
- Operate at enterprise scale
- Maintain internal technical resources or external partners
- Prioritize performance over usability
Typical Limitation in Practice
In practice, many teams rely on a few TM1 experts. This slows reporting changes.
Oracle NetSuite Planning and Budgeting - ERP-Centric Reporting for NetSuite Users
Oracle NetSuite Planning and Budgeting is a CPM module built for companies that already use NetSuite ERP. It extends ERP data into budgeting, forecasting, and financial reporting.
The tool works best when reporting follows NetSuite’s data structures. When finance teams need more flexibility or external data, reporting becomes harder to adapt.
Key Reporting Capabilities
- Standard financial statements based on NetSuite data
- Actuals vs. budget and forecast reporting
- Multi-entity and subsidiary reporting
- Predefined reporting templates
- Native integration with NetSuite ERP
Pros
- Tight integration with NetSuite ERP
- Single vendor setup for ERP and reporting
- Structured reporting for standardized finance processes
- Reduced need for data exports
Cons
- Limited flexibility outside NetSuite data models
- Custom reporting often requires consultants
- Less suitable for complex driver-based reporting
- Not ideal for companies with multiple ERPs
When NetSuite Planning and Budgeting Is a Good Fit
This tool works best for companies that:
- Use NetSuite as their core ERP
- Want ERP-aligned financial reporting
- Prefer standardized reporting structures
- Have relatively stable reporting requirements
Typical Limitation in Practice
In multi-country retail and distribution companies, finance teams struggle to adjust reports when local rules differ or when operational data sits outside NetSuite.
Vena Solutions - Excel-Centric Reporting with Strong Governance
Vena is a CPM platform built around Excel. It adds control, workflow, and audit trails to spreadsheet-based reporting. Many finance teams choose it to improve governance while keeping familiar Excel processes.
Vena centralizes data but keeps reports in Excel. As a result, it improves control but limits flexibility when reporting needs change often.
Read: 7 Vena Alternatives and Competitors to Take a Look at in 2026
Key Reporting Capabilities
- Financial statements and management reports in Excel
- Actuals vs. budget and forecast reporting
- Centralized data model with Excel front-end
- Workflow and approval processes
- Audit trails and version control
Pros
- Very familiar Excel-based experience
- Strong control, governance, and auditability
- Low adoption barrier for finance teams
- Clear ownership of reporting processes
Cons
- Core reporting logic remains Excel-based
- Limited flexibility for advanced driver-based reporting
- Performance depends on spreadsheet complexity
- Less suitable for real-time reporting needs
When Vena Is a Good Fit
Vena works best for companies that:
- Want to keep Excel as the primary reporting interface
- Need stronger governance and audit trails
- Have stable reporting structures
- Prefer incremental improvements over full process redesign
Typical Limitation in Practice
In consumer goods and distribution companies, frequent forecast changes make Excel-based reports slow to adapt when drivers change.
Prophix - Structured Financial Reporting for the Mid-Market
Prophix is a CPM platform designed for recurring financial reporting, budgeting, and forecasting. Mid-sized companies often use it to replace spreadsheets with a more structured process.
Prophix focuses on consistency. It supports standard financial statements and repeatable reporting cycles but offers less flexibility for custom models.
Key Reporting Capabilities
- Standard financial statements (P&L, balance sheet, cash flow)
- Actuals vs. budget and forecast reporting
- Automated report distribution
- Workflow and approval management
- Multi-entity reporting support
Pros
- Structured approach to financial reporting
- Clear workflows and ownership
- Reduced manual effort compared to spreadsheets
- Suitable for recurring monthly reporting
Cons
- Limited flexibility for non-standard reporting models
- Changes to structures can be time-consuming
- Less suitable for complex driver-based reporting
- UI and reporting experience can feel rigid
When Prophix Is a Good Fit
Prophix works best for companies that:
- Have relatively stable reporting requirements
- Focus on standardized financial statements
- Want to reduce spreadsheet dependency
- Prefer predefined reporting processes
Typical Limitation in Practice
In manufacturing and distribution companies with frequent changes to cost structures or reporting logic, finance teams may find Prophix restrictive when adapting reports to new business questions.
How to Choose the Right Financial Reporting Tool
Financial reporting tools solve very different problems. Some are built for visualization, others for governance, and some for enterprise-scale standardization. The key is understanding where reporting sits in your finance process, and how closely it needs to be connected to planning and forecasting.
If reporting relies on frequent manual consolidation, repeated explanations, or rebuilding reports after every forecast, the limitation is usually the tool, not the team. In those cases, integrated platforms can reduce fragmentation by keeping actuals, plans, and scenarios in one model.
This is where Farseer is typically evaluated. It’s used by companies that want financial reporting to evolve alongside planning, without adding another BI layer or increasing IT dependency.
If that reflects your current setup, it’s worth seeing how reporting and planning can work together in practice.
FAQ
What is the difference between a financial reporting tool and a BI tool?
Many BI tools focus on visualization and dashboards, while financial reporting tools are built around finance logic such as consolidation, allocations, and actuals vs. plan comparisons. If reporting requires structured financial statements, multi-entity consolidation, and integrated planning, a dedicated financial reporting platform is often more suitable than a standalone BI solution.
When should a company replace Excel-based financial reporting?
Excel works well for small teams and simple structures. However, as companies grow, manual consolidation, reconciliation issues, version control problems, and frequent forecast updates make spreadsheets fragile. When reporting cycles become slow or finance repeatedly rebuilds reports, it may be time to evaluate a more structured financial reporting tool.
How important is integration between reporting, budgeting, and forecasting?
Integration is critical. When reporting is disconnected from planning, finance teams duplicate logic across Excel, BI tools, and ERP systems. Integrated platforms connect actuals, budgets, forecasts, and scenarios in one model, reducing reconciliation effort and improving consistency across entities and departments.
Which financial reporting tool is best for multi-entity or multi-country organizations?
Companies operating across multiple entities, currencies, or regions need tools that support consolidation and structured reporting at scale. Platforms designed for multi-entity environments simplify group reporting and reduce manual adjustments compared to tools that rely heavily on spreadsheets or custom modeling.
How do you choose the right financial reporting tool for your organization?
The right tool depends on your reporting complexity, planning frequency, IT dependency, and organizational structure. Companies should evaluate whether they need visualization only, governance over spreadsheets, or an integrated reporting and planning system that reduces manual work and supports frequent forecasting.


What Great Financial Reporting and Analytics Actually Look Like
Read more
Ad Hoc Reporting for Finance Teams Who Can’t Wait on IT
Read more